


Key takeaways:
-
At least two classic technical patterns are flashing bullish reversal signals on XRP’s charts.
-
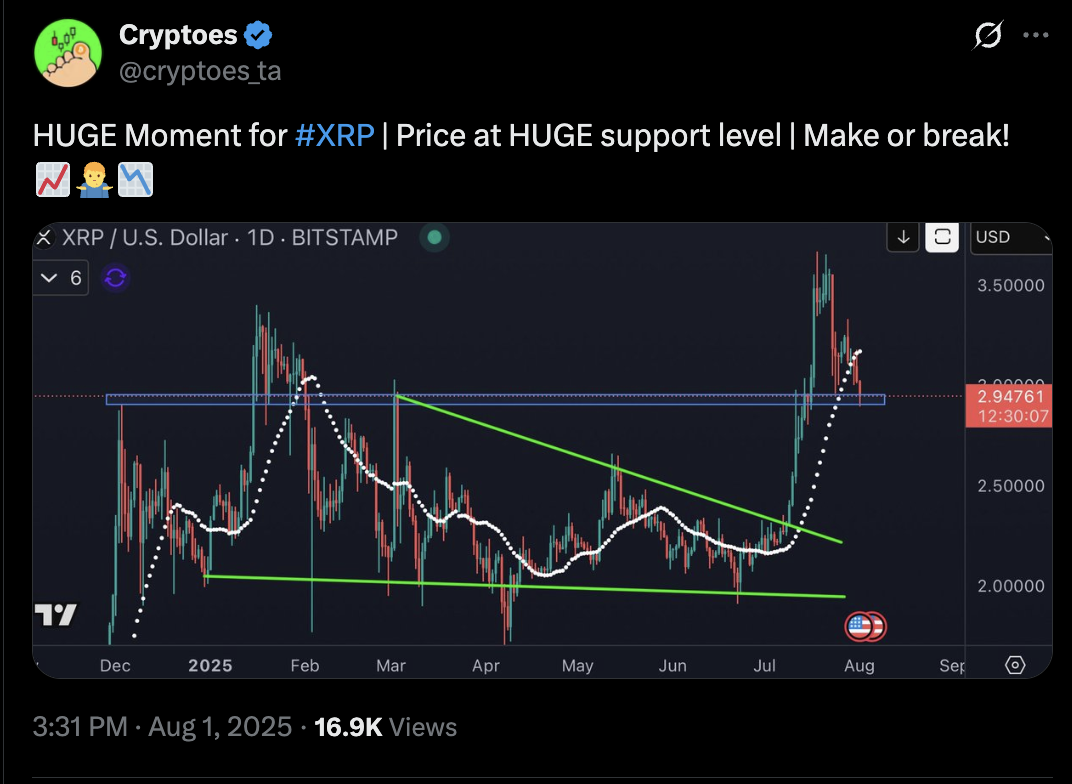
$2.80–$2.95 remains a key support zone, with analysts calling it a “make-or-break” level.
XRP (XRP) may be gearing up for a short-term rebound, with signs pointing to a potential 20% price jump by the end of August.
Bullish divergence signals fading XRP sell-pressure
On its four-hour candle chart, XRP shows a bullish divergence, a common signal often hinting at a potential trend reversal.
In this case, XRP’s price has been making lower lows, while the relative strength index (RSI), a momentum indicator, is making higher lows. Such a disconnect suggests that the recent selling pressure has been losing strength.
Another bullish signal is coming from XRP’s daily chart, on which the price is printing what appears to be a Dragonfly Doji candlestick pattern.
This candlestick has a long lower wick and little to no upper shadow, with the open and close prices near the top of the candle, suggesting that buyers stepped in strongly after early selling pressure.
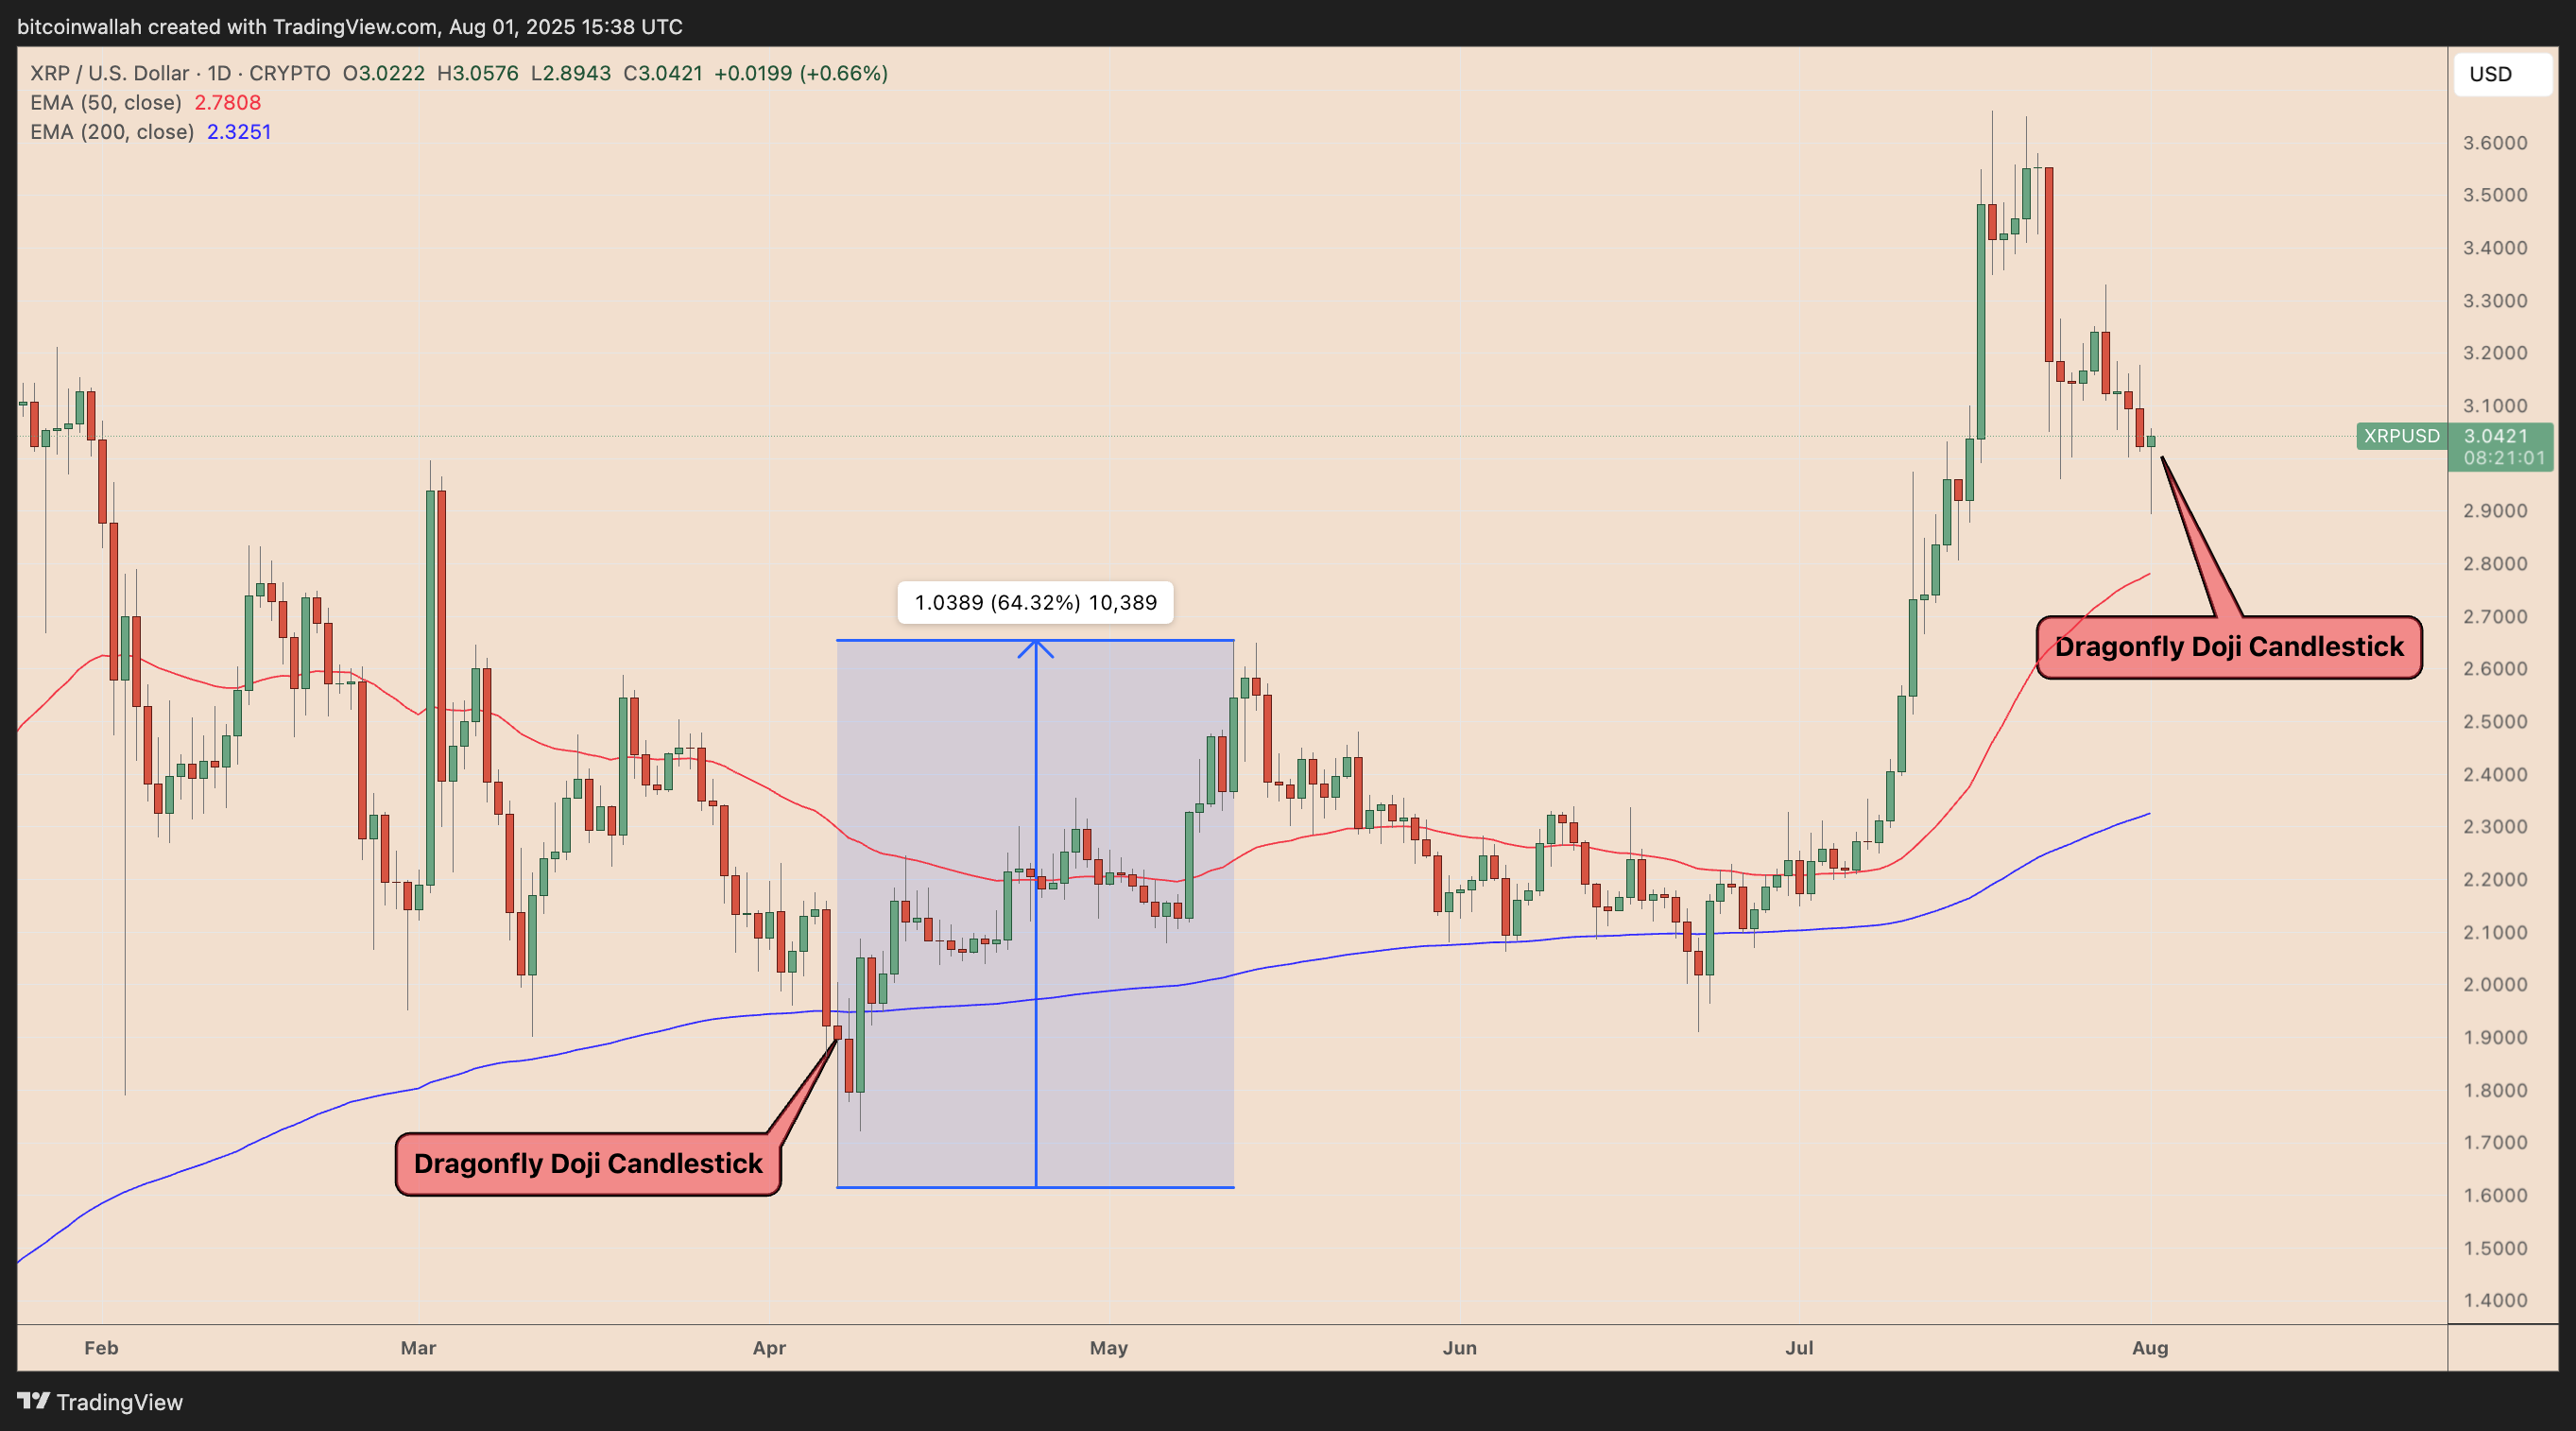
XRP bounced roughly 65% after printing a similar Doji candlestick in April.
Analyst Cryptoes anticipates XRP will retain its prevailing bullish momentum if the price is above the $2.80-2.95 support range, calling it a “make-or-break” level.
XRP price in a falling wedge breakout
XRP is flashing a classic falling wedge pattern on its four-hour chart, a bullish reversal setup that may hint at a strong upside move.
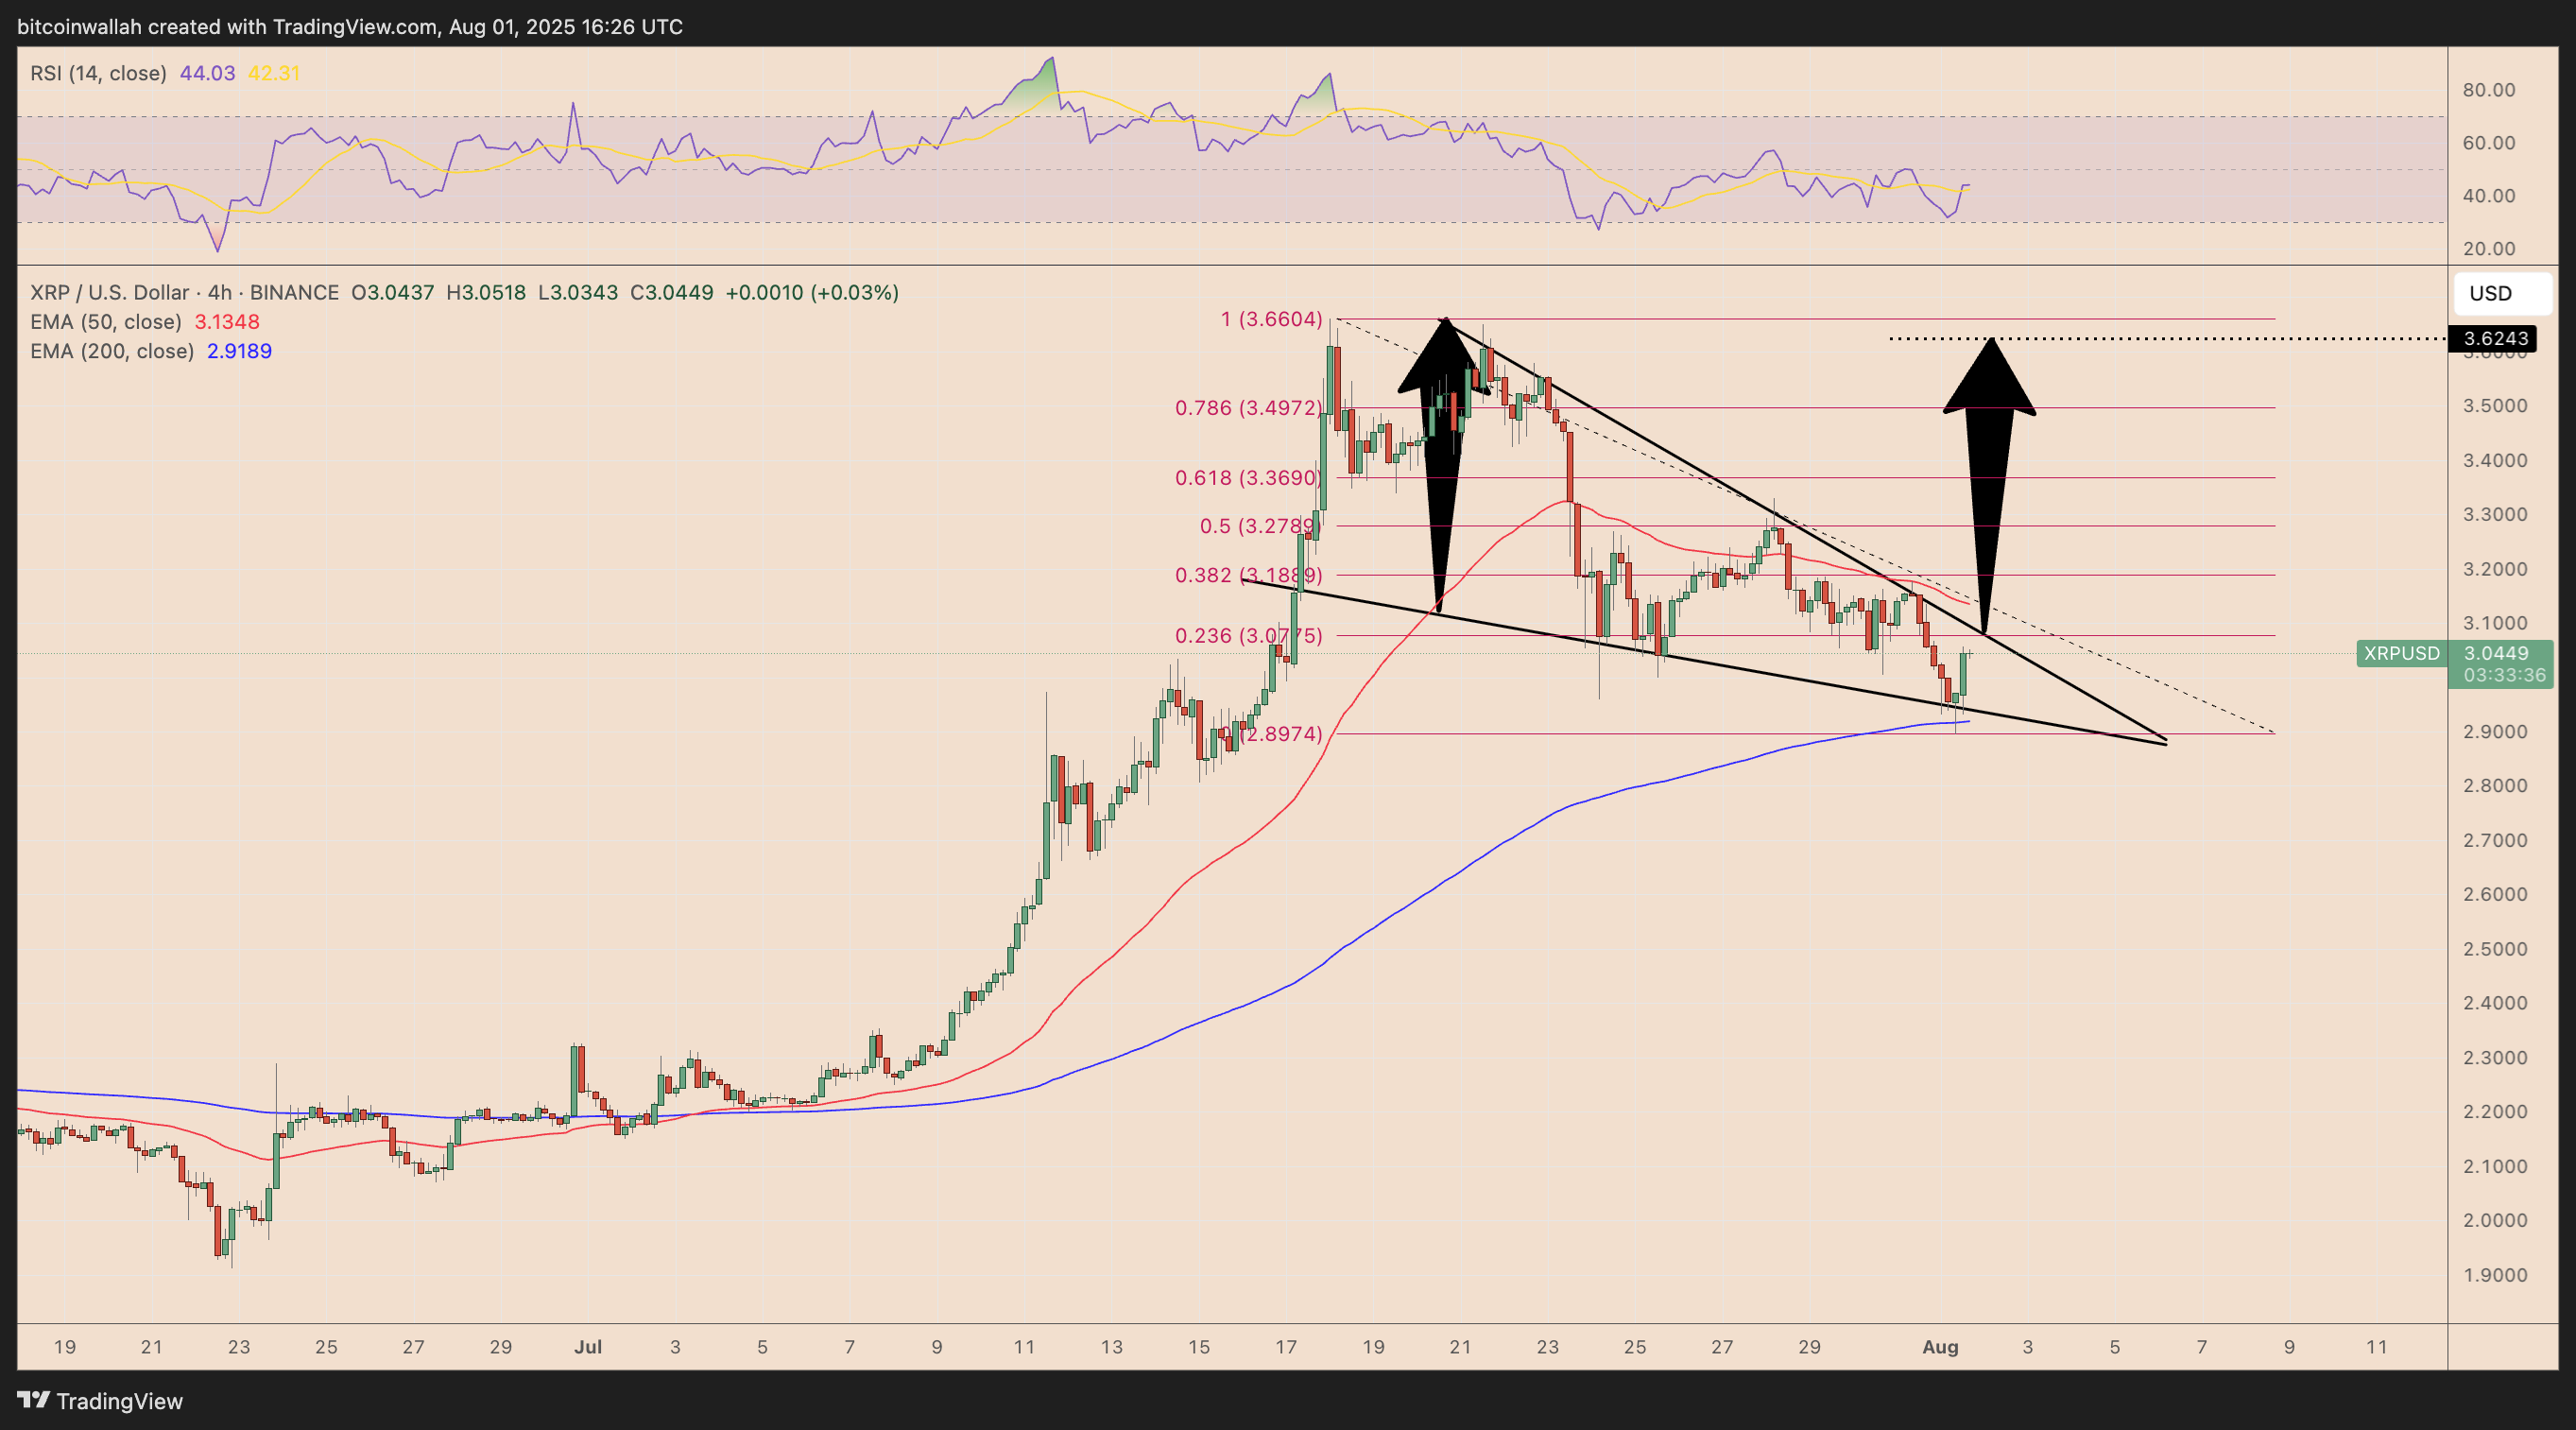
The XRP/USD pair bounced off the wedge’s lower boundary near the 200-4H exponential moving average (200-4H EMA; the blue wave), showing strong demand at support.
Related: ‘Real fun starts’ if XRP price ends July above $3, new analysis says
A 20% rally toward the $3.60–$3.65 range could unfold in the coming days if the price breaks above the wedge’s upper trendline, aligning with the 0.236 Fib line at around $3.07.
This article does not contain investment advice or recommendations. Every investment and trading move involves risk, and readers should conduct their own research when making a decision.
