


Key takeaways:
-
XRP whales continue accumulating on the dips, boosting chances of a recovery.
-
XRP price must hold above $2.70 support to continue upside toward $4.
XRP (XRP) price displayed strength on Wednesday, up 6.8% from Monday’s lows of around $2.70 as traders adjusted to the latest sell-off following an overleveraged market.
A strong technical setup and onchain data show that the XRP/USD pair is primed for a trend reversal toward $4.
XRP symmetrical triangle pattern eyes 42% rally
Data from Cointelegraph Markets Pro and TradingView shows XRP bouncing off the lower trend line of a symmetrical triangle on the daily time frame, as shown in the chart below.
A symmetrical triangle chart pattern is a technical formation where price consolidates between two converging trend lines, forming a triangle. It indicates indecision, with decreasing volatility, often preceding a breakout.
Related: XRP ETF pump ‘disappointment,’ Bitcoin to see out 2025 at $173K: Trade Secrets
In XRP’s case, an upward breakout above the triangle’s resistance line at $3 could signal a trend reversal. Such a move could open the way toward the measured target of the triangle at $4.08, representing a 42% climb from current levels.
Before reaching the target, bulls would have to overcome resistance from the $3.40 and the eight-year high at $3.66.
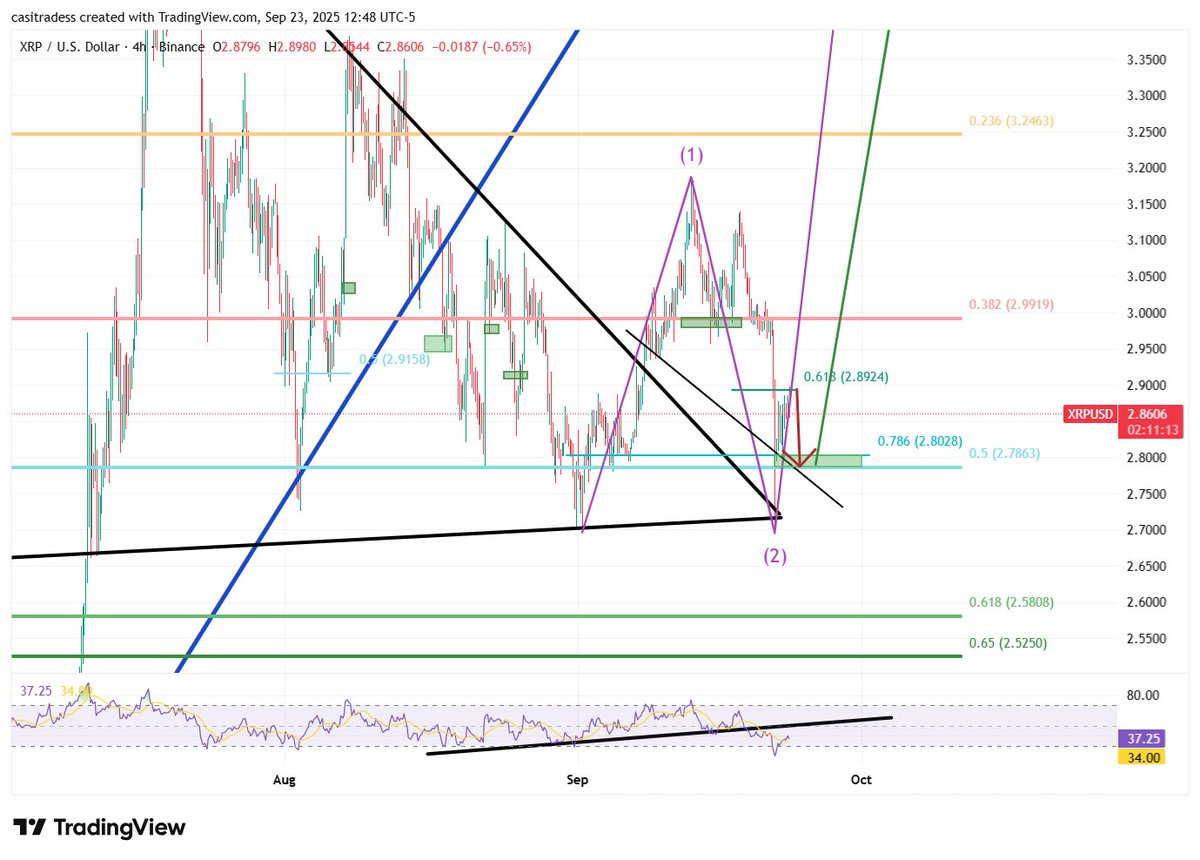
Zooming in, trader and analyst CasiTrades pointed out that XRP created a “massive wick down to a double bottom near $2.70” on the four-hour chart.
“A double bottom like this still fits within a valid Wave 2 count, as long as the price holds above $2.70,” she said in an X post on Tuesday.
For CasiTrades, key levels to watch on the downside were the immediate support at $2.79 and the recent low at $2.70. A drop below this level would bring the $2.58 support into the picture.
“Looking above, the next major resistance targets are $4.00 and $4.40,” based on Fibonacci extension levels, the trader said, adding:
“The market is preparing for a major trend shift.”
The bullish outlook was mirrored by crypto analyst CryptoBull, who said the XRP price could rally to $5 in October if it breaks out of a bull flag pattern.
Can whale accumulation ignite XRP rebound?
Several indicators show that XRP price may continue its uptrend despite possible fears of further losses following Monday’s sell-off.
For instance, Santiment’s Supply Distribution metric shows a steady rise in the supply held by entities with a 1 million –10 million token balance over the last few days. These addresses now own 6.77 billion XRP, after scooping up 30 million more tokens between Monday and Tuesday. This represents 11% of the total XRP circulating supply.
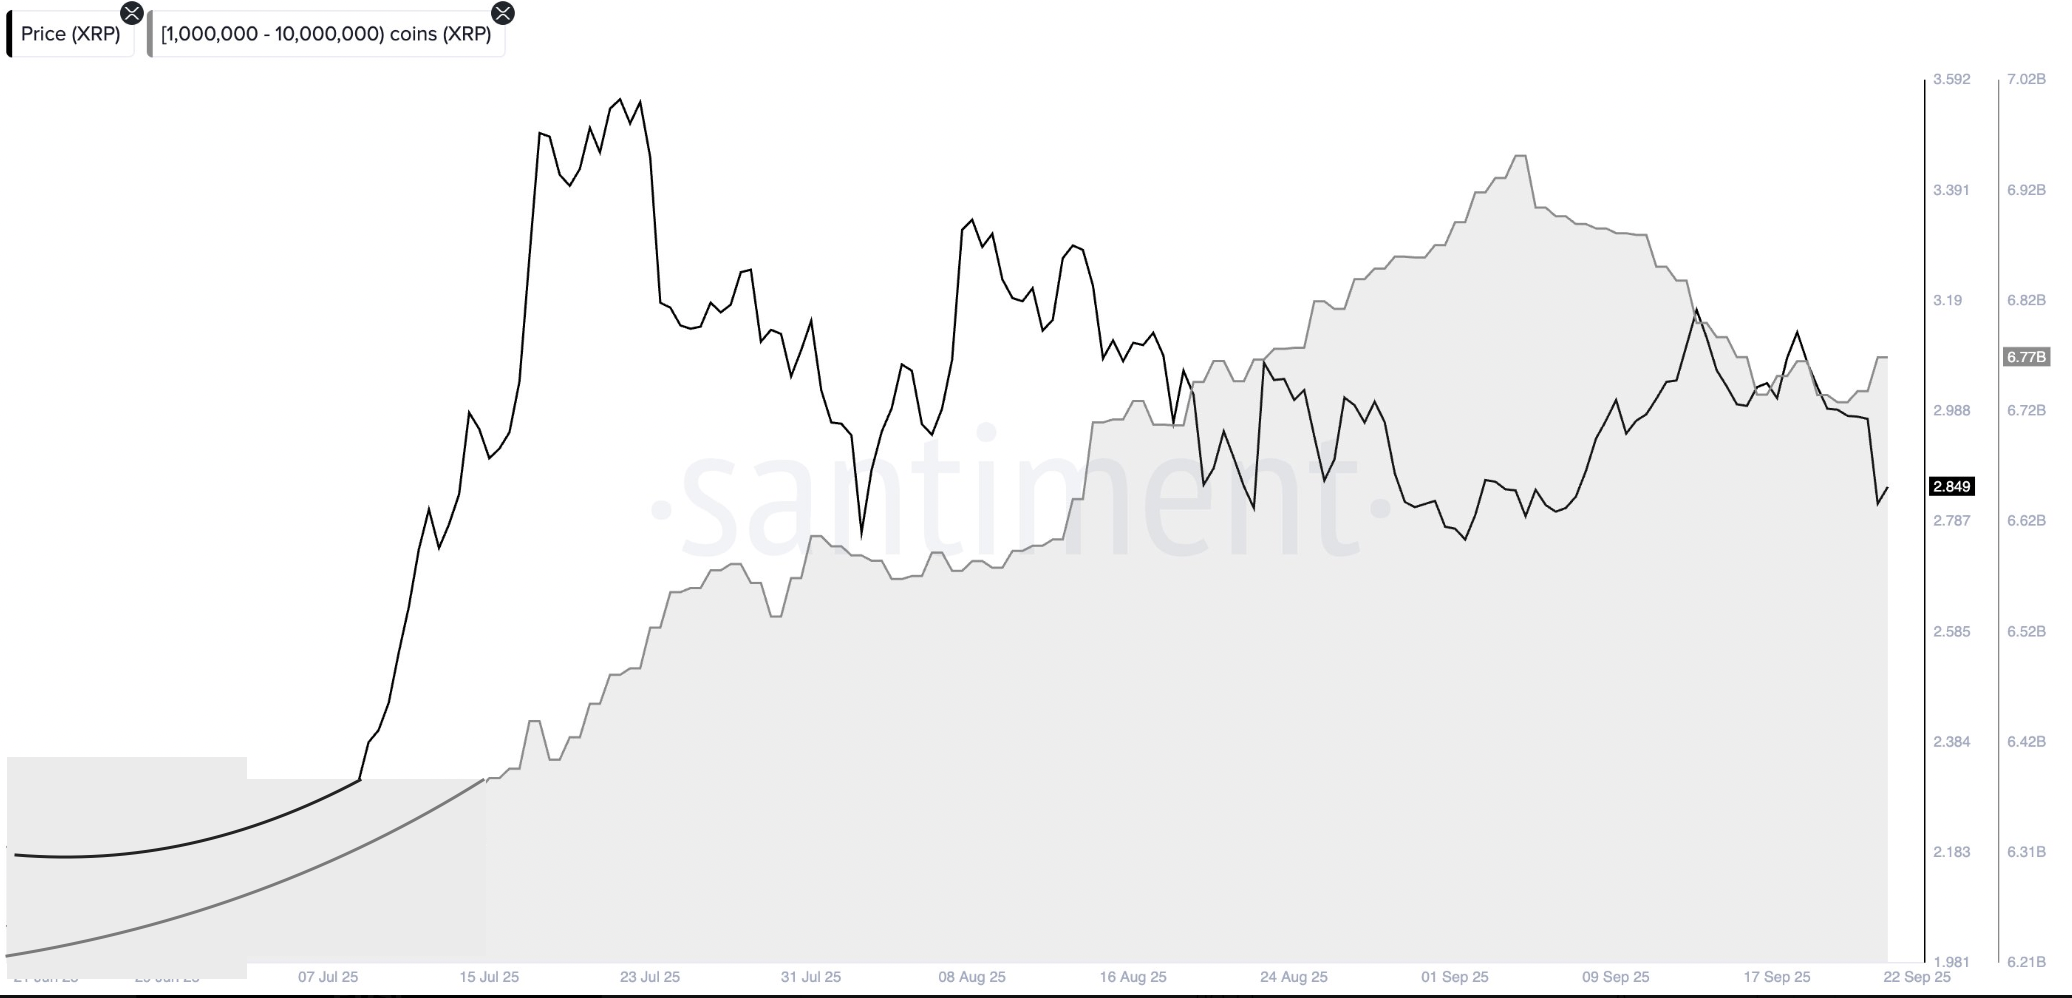
In other words, most whales did not sell on this week’s drop to $2.70 but accumulated XRP, suggesting they’re confident of further price increases.
By buying the dips, these large entities can reduce selling pressure and create a floor for the price, encouraging smaller retail investors to follow suit.
Meanwhile, XRP’s net holder position change has been strongly positive since Aug. 22. This shift followed a stretch of red outflows in July and early August, coinciding with profit-taking after the $3.66 multi-year highs.
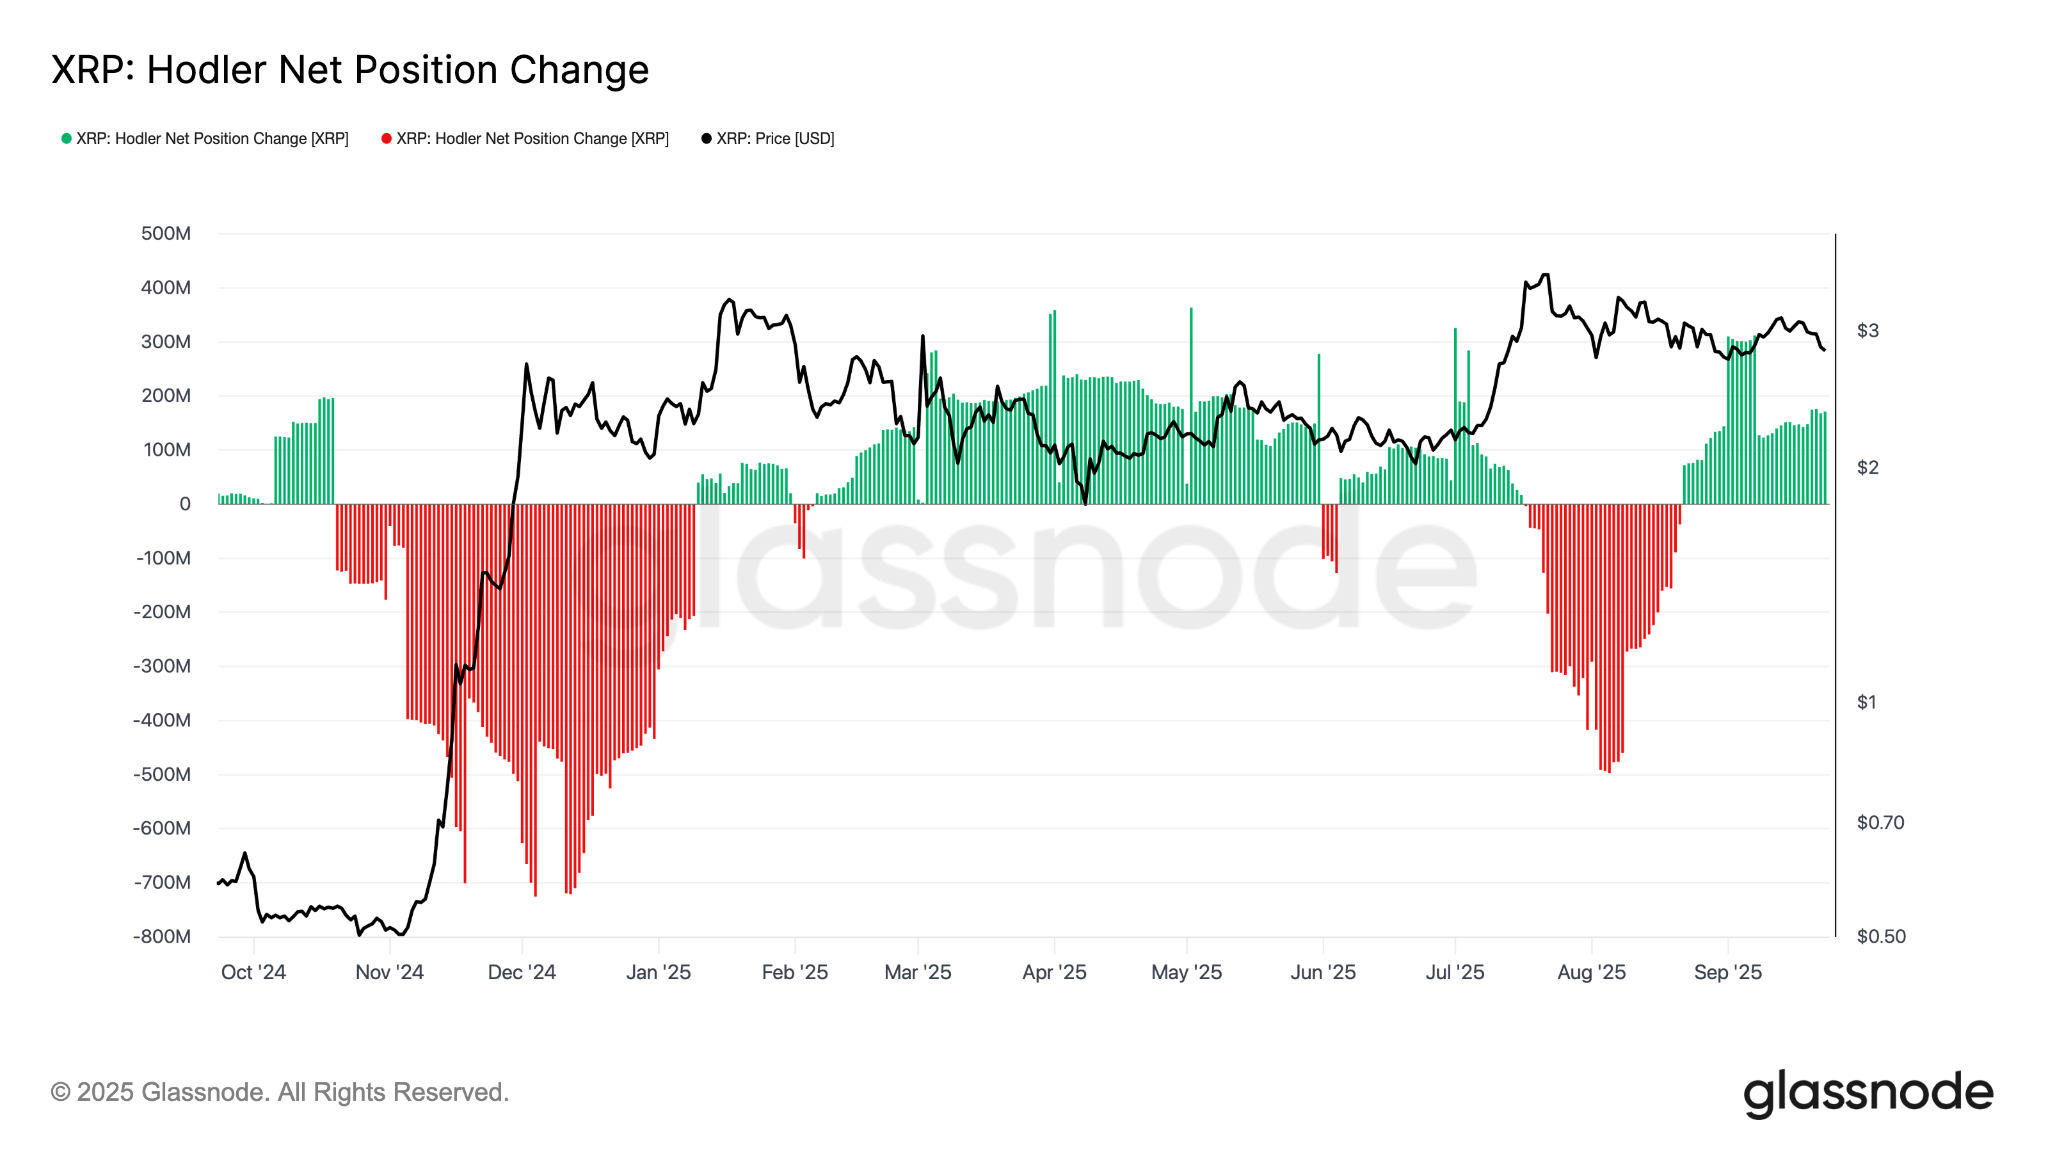
The chart above shows that much XRP accumulation happened in the $2.70–$3 range, indicating that investors are positioning for upside rather than exiting the market.
It also explains why these are important levels to watch for XRP traders moving forward.
This article does not contain investment advice or recommendations. Every investment and trading move involves risk, and readers should conduct their own research when making a decision.
