


Key takeaways:
XRP (XRP) extended its downtrend on Friday, dropping 3% over the last 24 hours to trade at $1.93. The inability to hold above $2 now puts the altcoin’s recovery possibilities in question, with traders asking how much further it can fall.
Classic XRP pattern targets $0.88
The XRP/USD pair has formed a megaphone pattern in the weekly time frame, suggesting that a deeper correction was in store for the altcoin.
A megaphone pattern, also known as a broadening wedge, forms when the price creates a series of higher highs and lower lows. As a technical rule, a breakout below the pattern’s lower boundary may trigger a sharp drop.
Related: ETF altseason? Solana, XRP funds buck crypto’s market sell-off
In XRP’s case, the pattern will be confirmed once the price breaks above the lower trend line around $1.80.
The measured target for this pattern is $0.88, or a 54% increase from the current level.
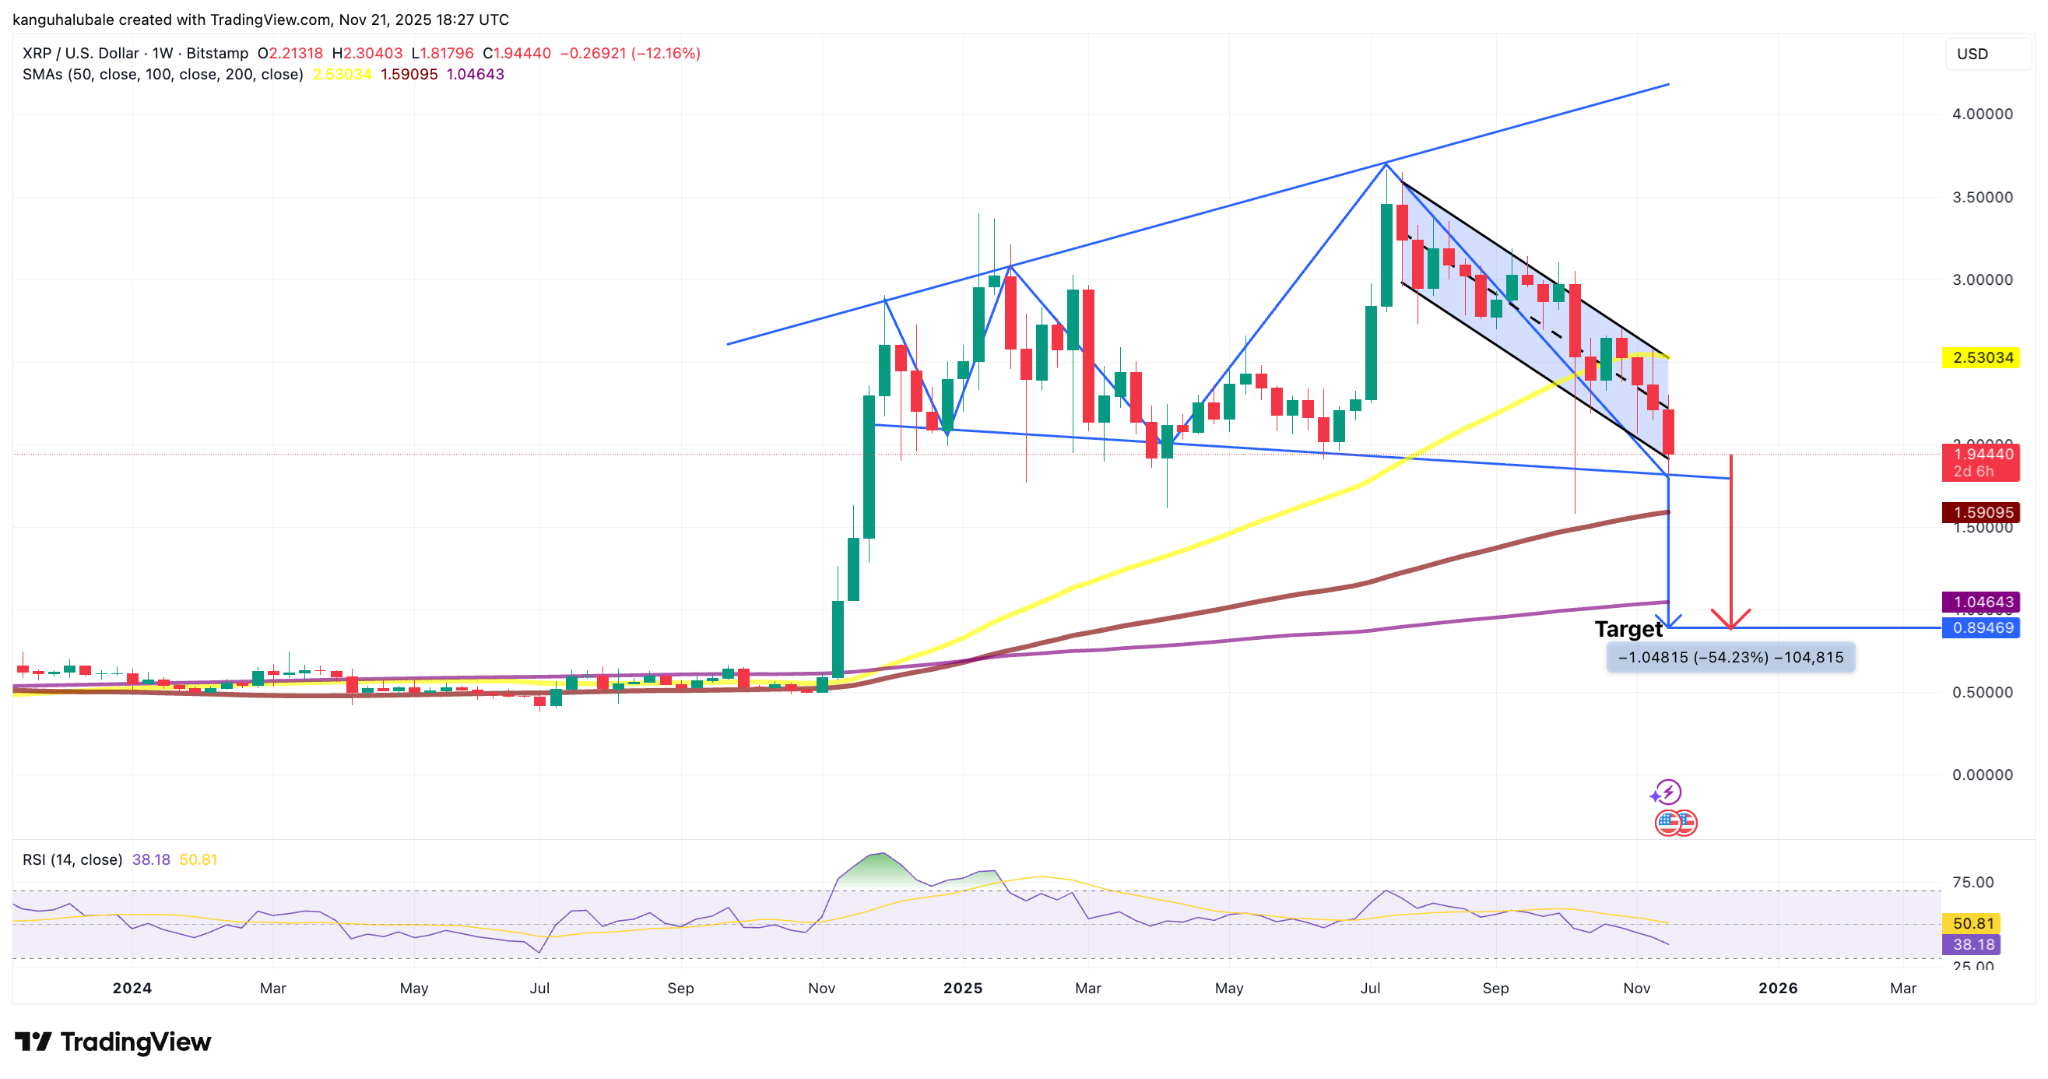
Key levels to watch before this target is reached are the 100-week simple moving average (SMA) at $1.60 and the 200-week SMA at $1.05.
The weekly RSI dropped to 39 on Friday, down from extremely overbought levels of 91 in December 2024, suggesting steadily increasing downward momentum over this period.
Meanwhile, XRP’s Net Unrealized Profit/Loss (NUPL) has moved from euphoria to denial, and now anxiety is creeping in.
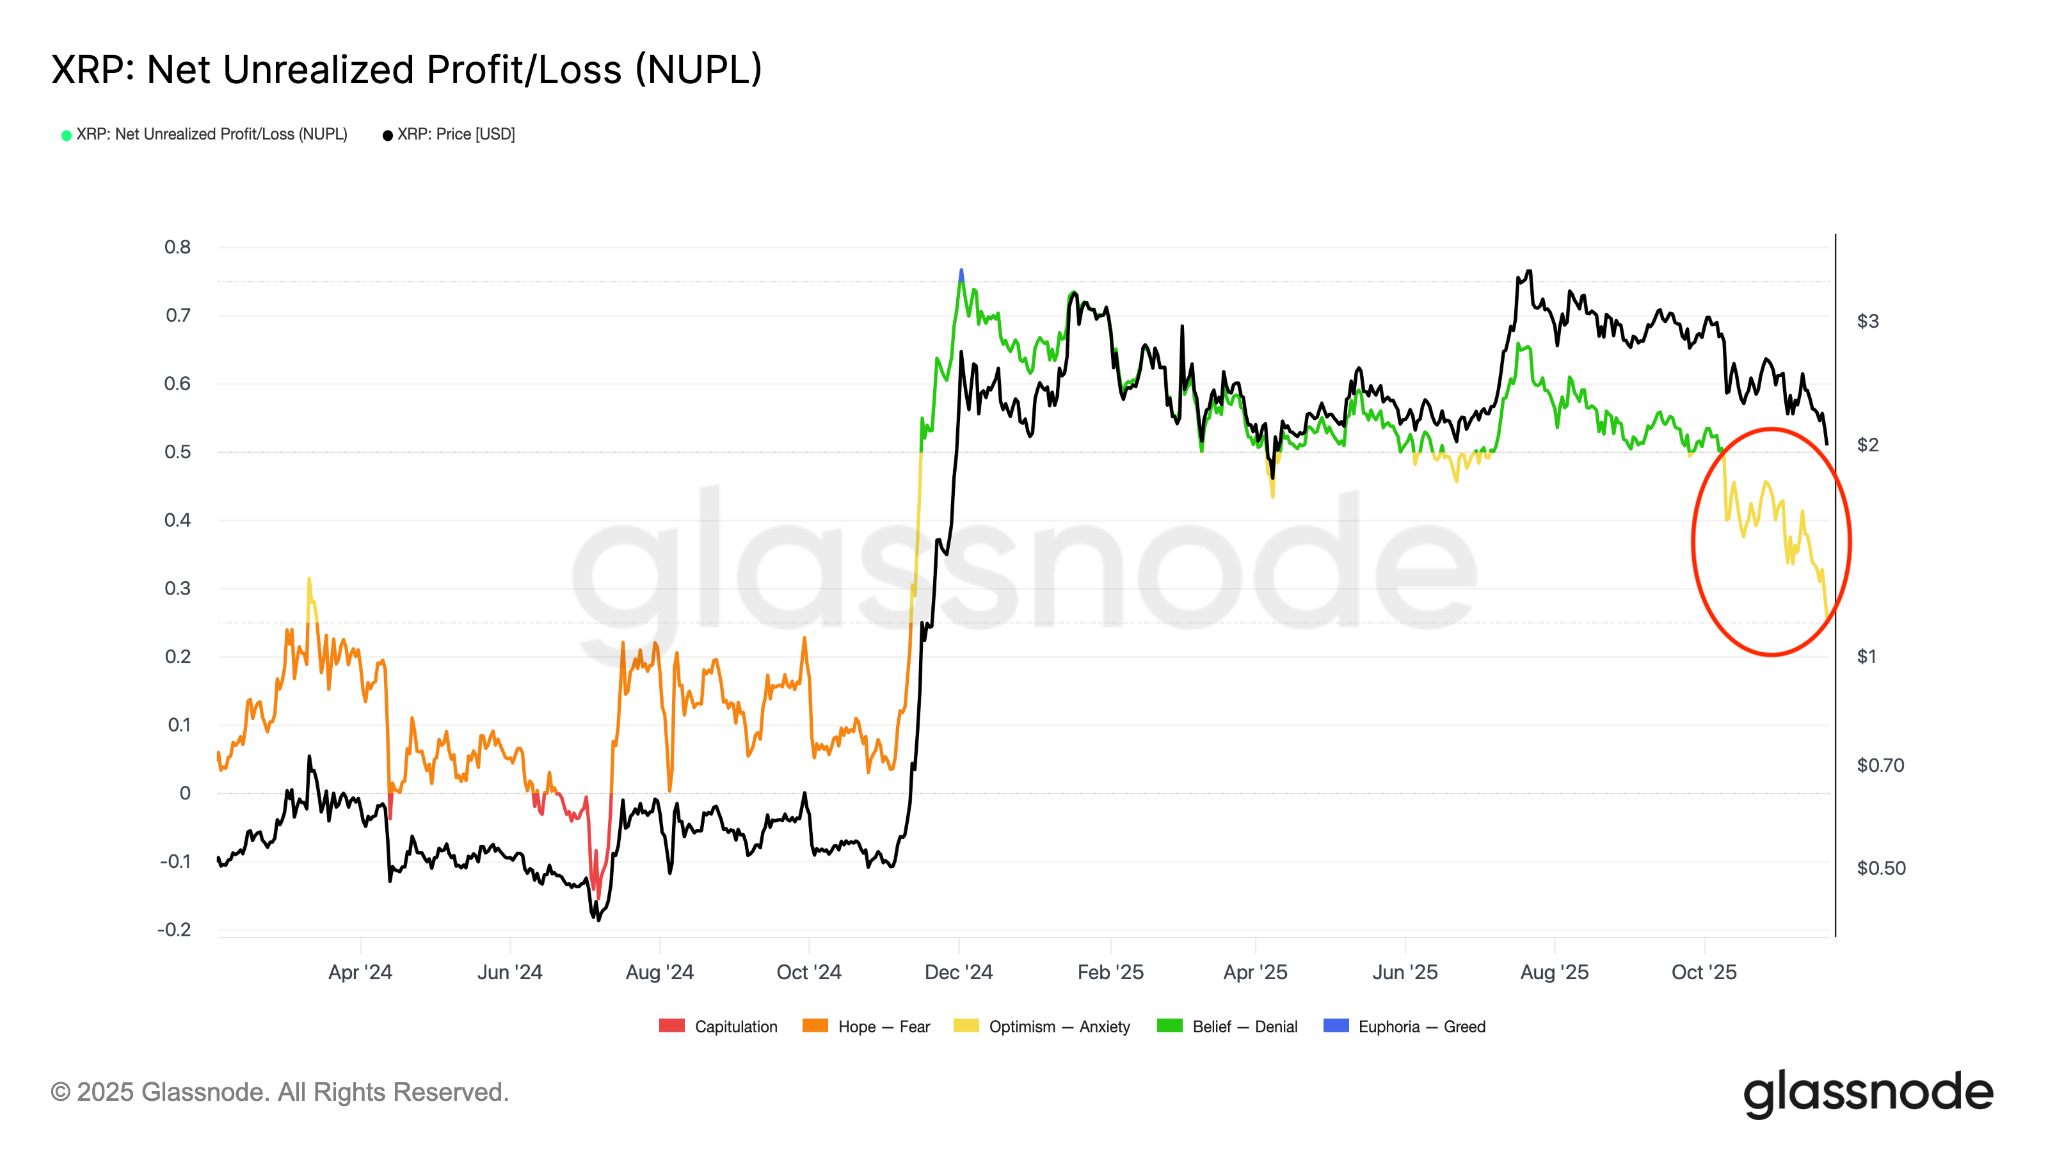
With more than 41.5% of XRP holders underwater at current prices, there is a likelihood of increased sell-side pressure as investors count their losses. Such setups in 2018 and 2021 preceded sharp corrections, raising the possibility of similar pullbacks over the next few weeks.
XRP realized losses rise to seven-month highs
XRP dropped to an intraday low of $1.81, levels last seen in April, according to data from Cointelegraph Markets Pro and TradingView.
Mounting selling pressure has prompted many investors to sell at a loss, reminiscent of major historic market crashes.
Realized losses on XRP have surged to levels not seen since April, according to blockchain data platform Glassnode.
“The 30D-EMA of daily realized losses has spiked to about $75M per day,” Glassnode said in an X post on Friday.
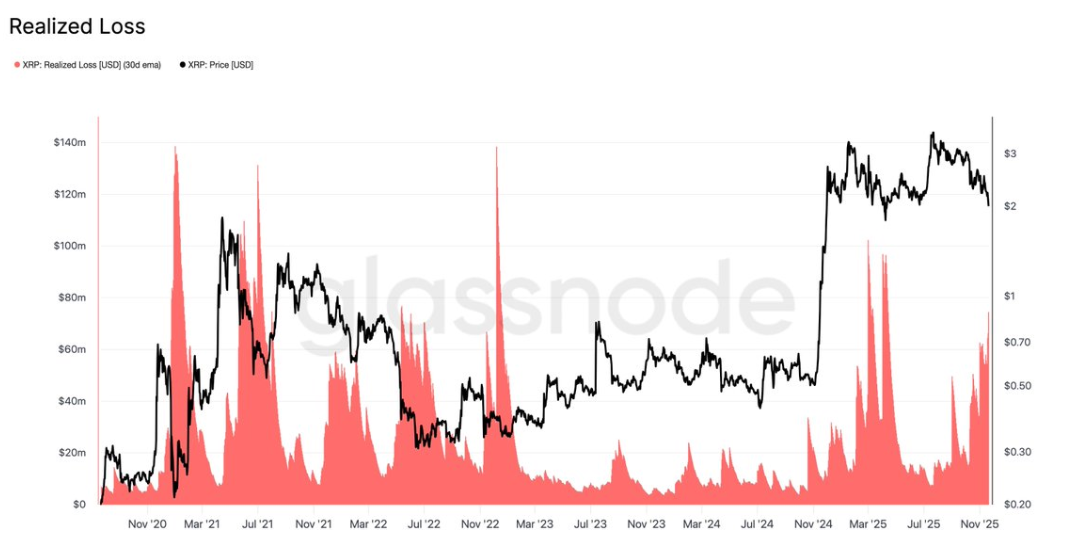
Glassnode’s observation came minutes before XRP slipped below $2, marking a 50% decline from its multi-year high of $3.66 recorded in mid-July.
As Cointelegraph reported, lack of onchain demand and persistent profit-taking by whales could amplify XRP’s sell-off risks.
This article does not contain investment advice or recommendations. Every investment and trading move involves risk, and readers should conduct their own research when making a decision.
