


Key points:
-
Bitcoin has been facing intense selling pressure, opening the doors for a fall to the crucial support at $73,777.
-
Several major altcoins have slipped below their support levels, indicating that bears remain in firm control.
Bitcoin (BTC) attempted a recovery on Friday, but the bears continued to exert pressure, bringing the price as low as $80,000 at Binance. The sentiment remains weak as US stock markets deepened their correction this week amid concerns about excessive valuations in the artificial intelligence sector. Additionally, expectations of a December rate cut by the Federal Reserve have dropped to 33.1% from 98.1% on Oct. 21, according to the CME FedWatch Tool.
The question on everyone’s mind is how low could BTC go? Bitwise European head of research André Dragosch said in a post on X that BTC is likely to bottom out in the zone between BlackRock’s IBIT cost-basis of $84,000 and Strategy’s cost-basis near $73,000.
Select analysts view the current dip as a positive development. Veteran trader Peter Brandt said in a post on X that the correction was the “best thing” that could have happened to BTC. He added that he remains long-term bullish on BTC, expecting the price to rally to $200,000 around the third quarter of 2029.
What are the crucial overhead resistance levels to watch out for in BTC and major altcoins? Let’s analyze the charts of the top 10 cryptocurrencies to find out.
Bitcoin price prediction
BTC sliced through several short-term support levels and plunged to $80,600, signaling aggressive selling by the bears.
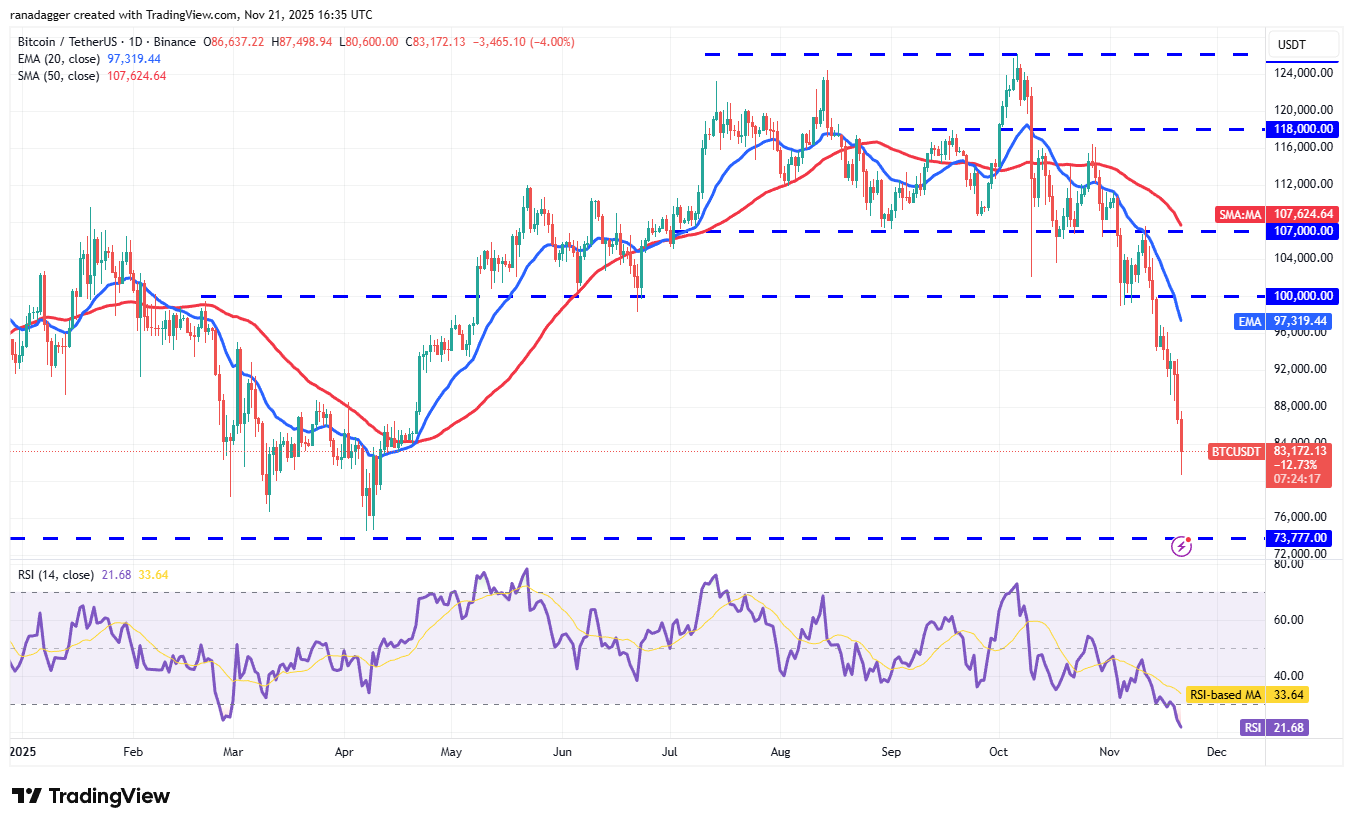
The next major support on the downside is at $73,777. Buyers are expected to defend the $73,777 level with all their might, as a break below it opens the gates for a collapse to $53,500.
Sharp corrections are followed by an equally sharp rally. The oversold levels on the relative strength index (RSI) indicate a potential relief rally in the near term. That could push the BTC/USDT pair to the 20-day exponential moving average ($97,319), where the bears are expected to mount a strong defense.
Ether price prediction
Ether (ETH) closed below the $3,000 level on Thursday, clearing the path for a collapse to $2,500.
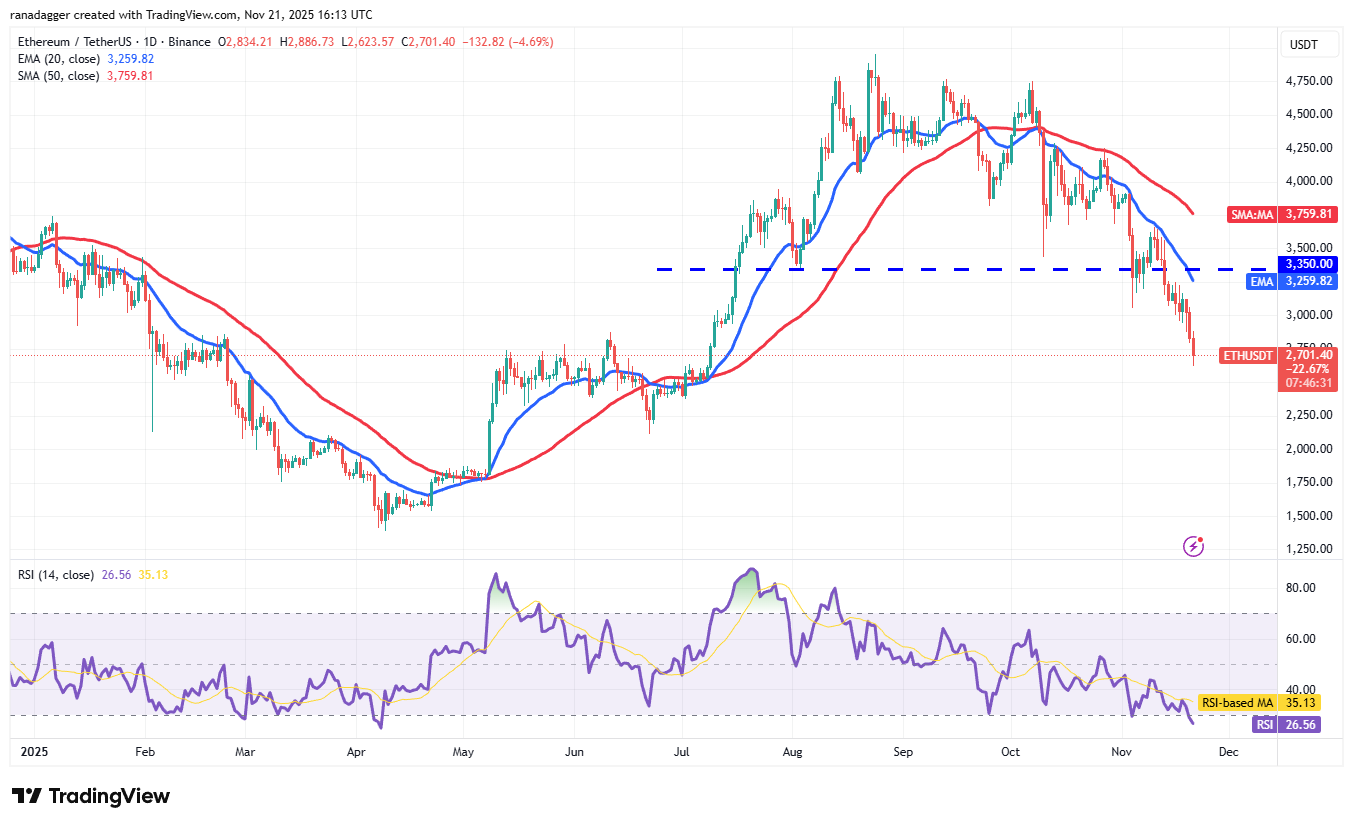
The fall has pushed the RSI into the oversold zone, signaling that a relief rally is possible in the near term. If the Ether price turns up from the current level or rebounds off $2,500, the ETH/USDT pair could reach the breakdown level of $3,350.
On the contrary, a shallow bounce off $2,500 suggests weak demand from the bulls. That increases the risk of the continuation of the downward trend. The pair could then tumble to the $2,111 level.
XRP price prediction
XRP (XRP) slipped below the support line of the descending channel pattern on Friday, indicating that the bears are in charge.
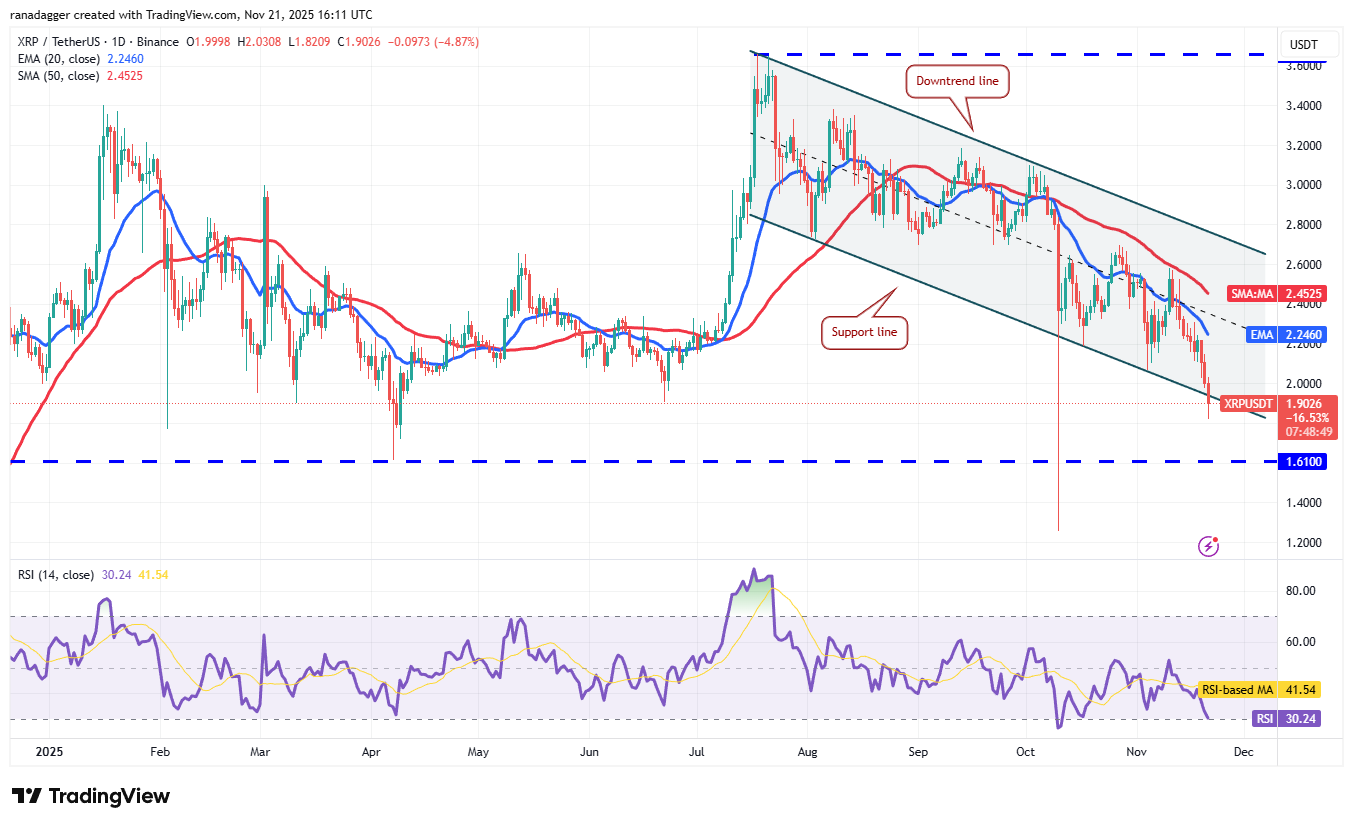
If the price closes below the support line, the XRP/USDT pair may descend to the $1.61 support. Buyers are expected to defend the $1.61 level with all their might, as a break below it could start a new downtrend to $1.27 and then to $1.
On the upside, the zone between the 50-day simple moving average ($2.45) and the downtrend line is the key resistance to keep an eye on. Buyers will have to thrust the XRP price above the downtrend line to signal a potential trend change.
BNB price prediction
BNB (BNB) remains in a firm bear grip as sellers attempt to maintain the price below the $860 support.
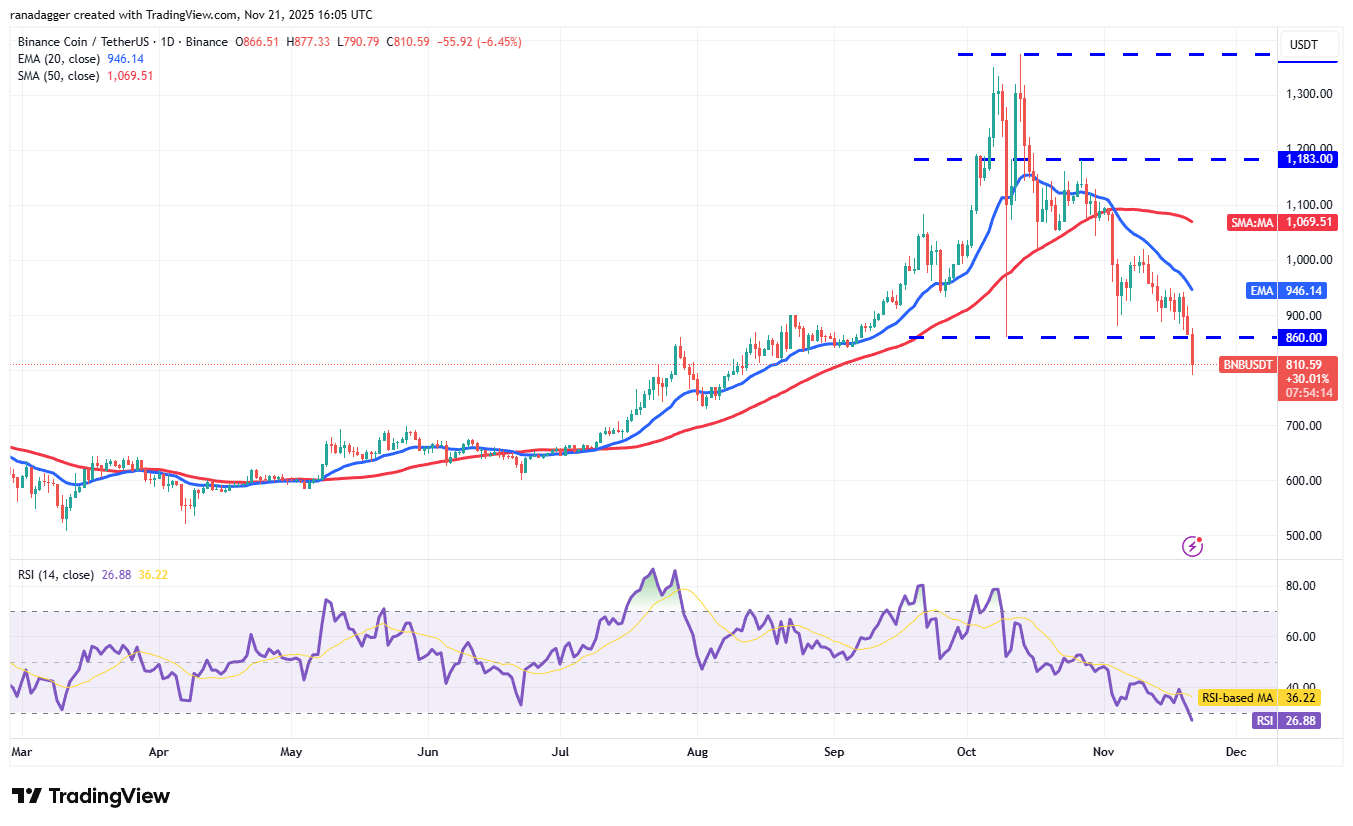
A close below $860 could intensify selling, pulling the BNB price to $818 and then to $730. The sharp fall of the past few days has pulled the RSI into oversold territory, suggesting a relief rally in the near term.
Any recovery attempt is expected to face selling at the breakdown level of $860 and then at the 20-day EMA ($946). If the price turns down from the overhead resistance, the bears will strive to pull the BNB/USDT pair to $625. The first sign of strength will be a close above the 20-day EMA. That opens the doors for a rally to $1,019 and then to the 50-day SMA ($1,069).
Solana price prediction
Buyers attempted a relief rally in Solana (SOL) on Thursday, but the long wick on the candlestick shows that the bears are active at higher levels.
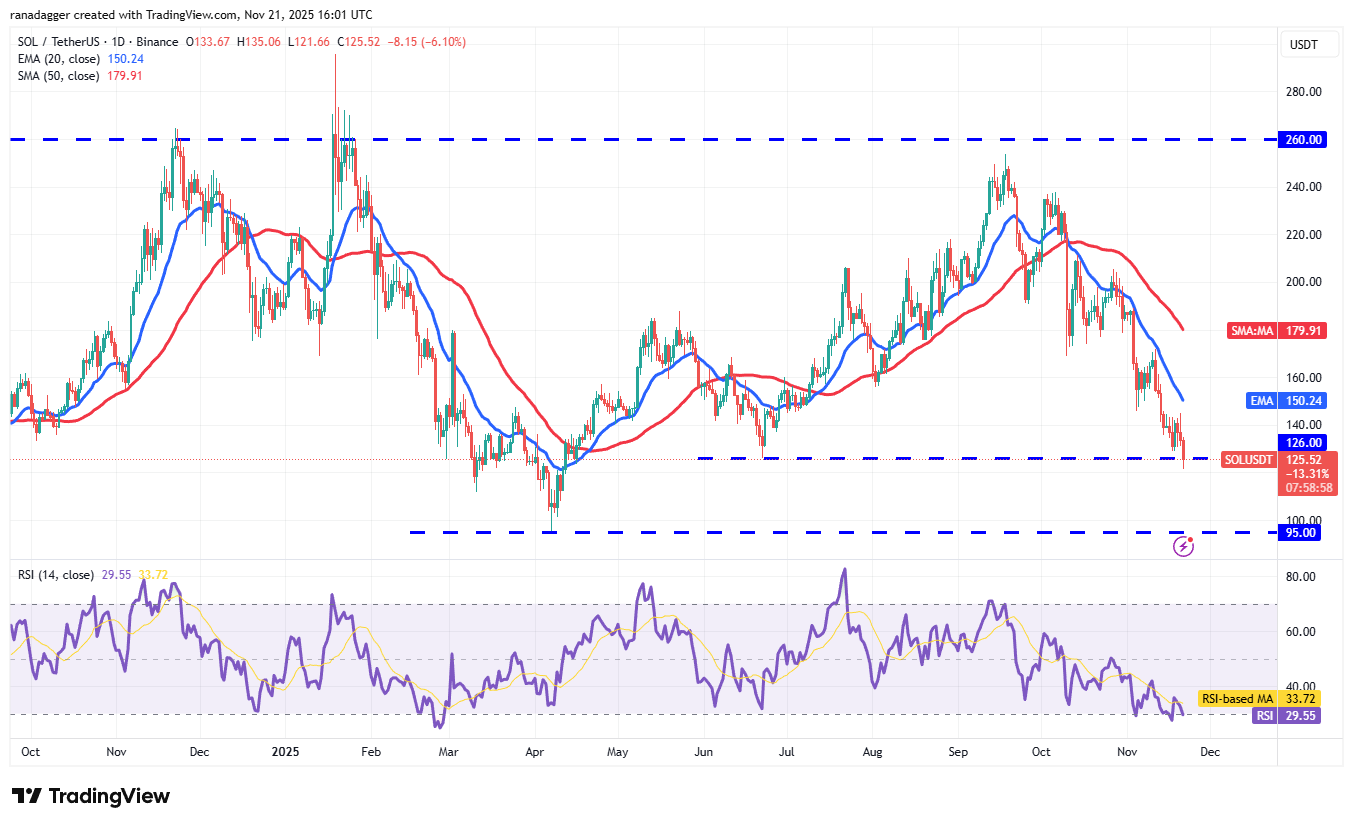
The bears are trying to strengthen their position by sustaining the Solana price below the $126 support. If they manage to do that, the selling could pick up and the SOL/USDT pair could decline to $110 and later to $95.
The 20-day EMA ($150) remains the key short-term resistance to watch out for on the upside. Buyers will have to pierce the 20-day EMA to signal the start of a sustained recovery to the 50-day SMA ($179).
Dogecoin price prediction
Dogecoin (DOGE) has reached the bottom of the $0.14 to $0.29 range, where the buyers are expected to step in.
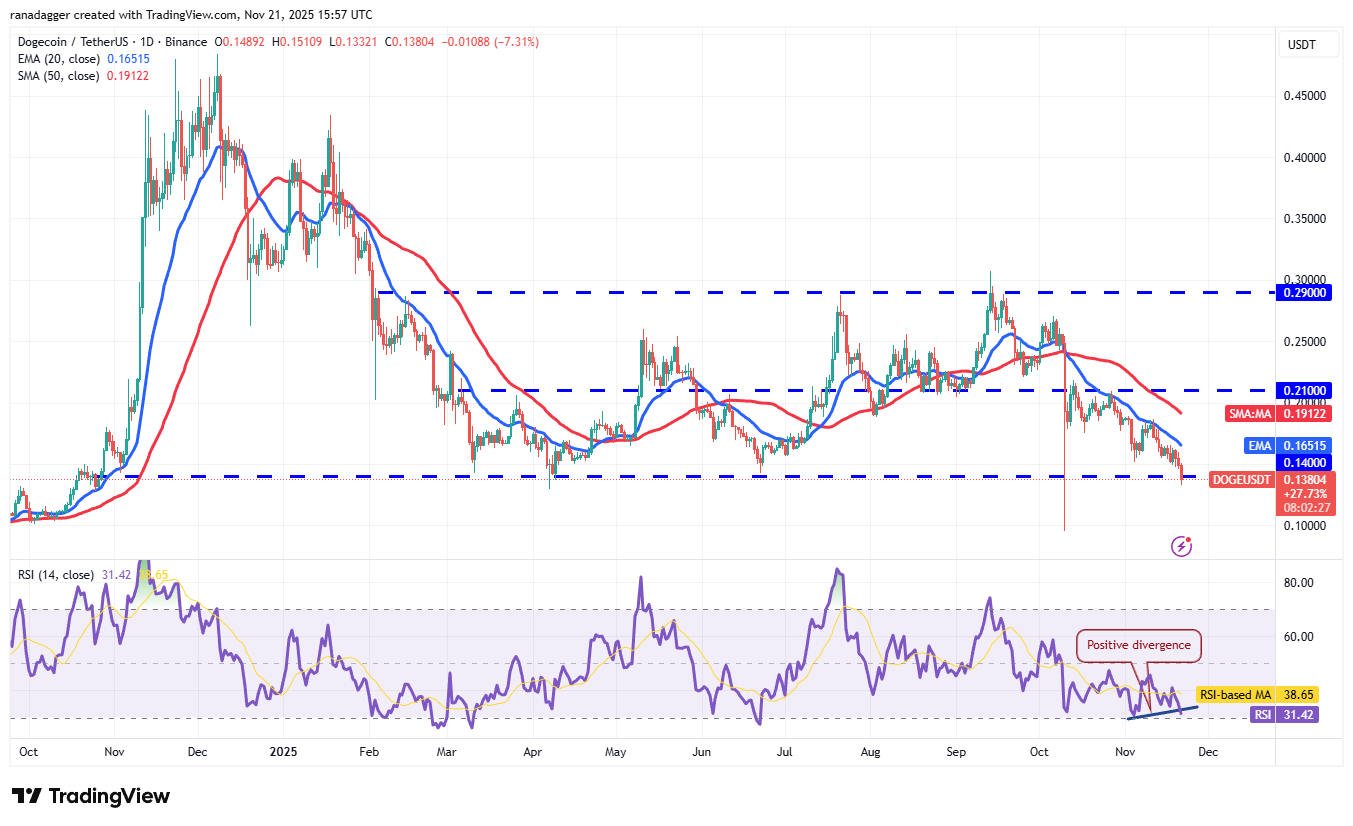
The bulls will have to push the Dogecoin price above the 20-day EMA ($0.16) to signal strength. The DOGE/USDT pair may then rise to the 50-day SMA and later to the $0.21 level. Such a move suggests that the pair may extend its stay inside the wide range for a while longer.
Alternatively, a break and close below $0.14 indicates that the bears have overpowered the bulls. The pair may then start a new downtrend toward the Oct. 10 low of $0.10.
Cardano price prediction
Cardano (ADA) continued its slide and reached the first support at $0.40, indicating that the bears are in command.
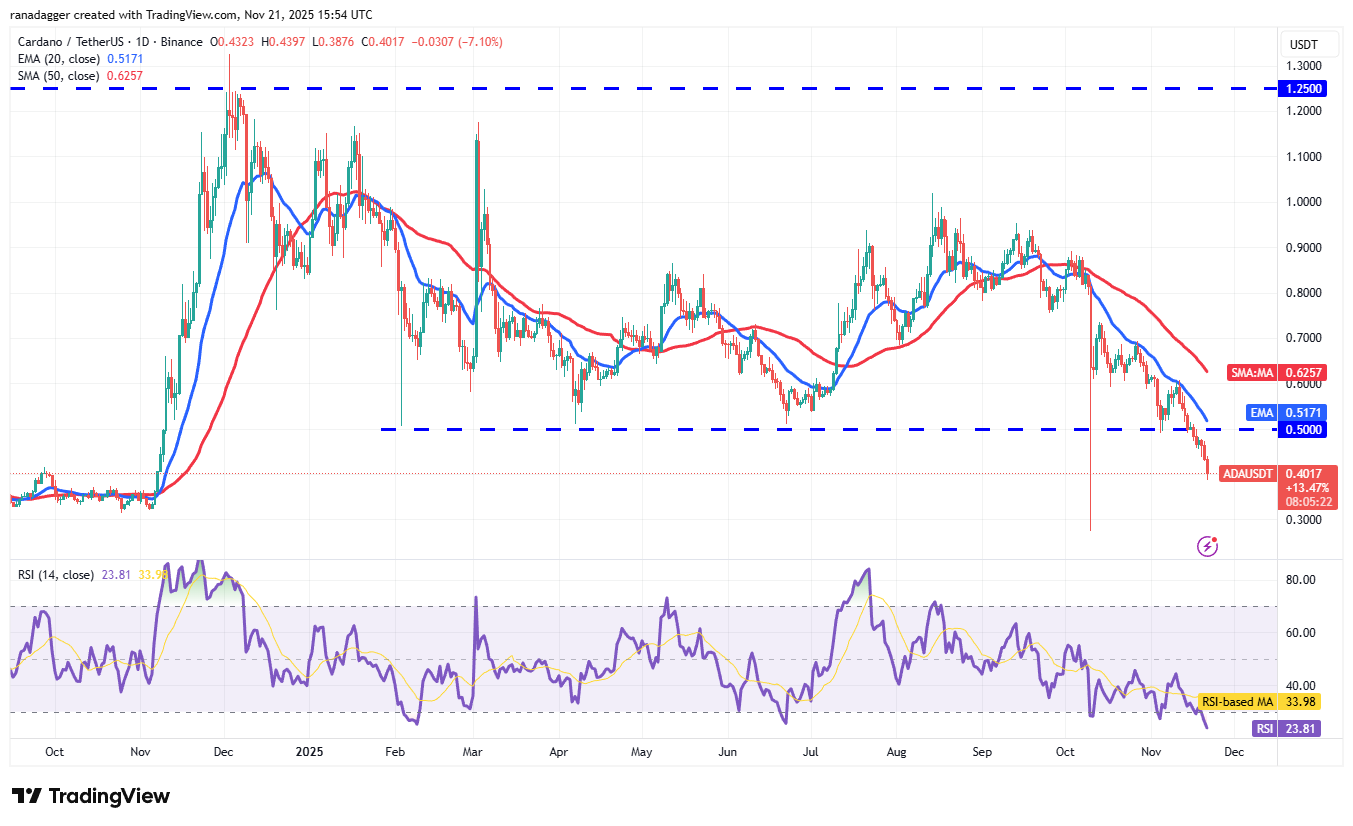
The sharp fall has pulled the RSI into the oversold territory, suggesting a recovery may be around the corner. The relief rally is expected to face selling at the breakdown level of $0.50. If the Cardano price turns down from $0.50, it suggests that the bears have flipped the level into resistance. That increases the risk of a drop toward $0.27.
On the contrary, if buyers drive the price above the 20-day EMA ($0.51), it signals that the bears are losing their grip. The ADA/USDT pair may then climb to the 50-day SMA ($0.62).
Related: Bitcoin realized losses rise to FTX crash levels: Where is the bottom?
Hyperliquid price prediction
Hyperliquid (HYPE) tried to rise above the 20-day EMA ($39.04) on Thursday, but the bears held their ground.
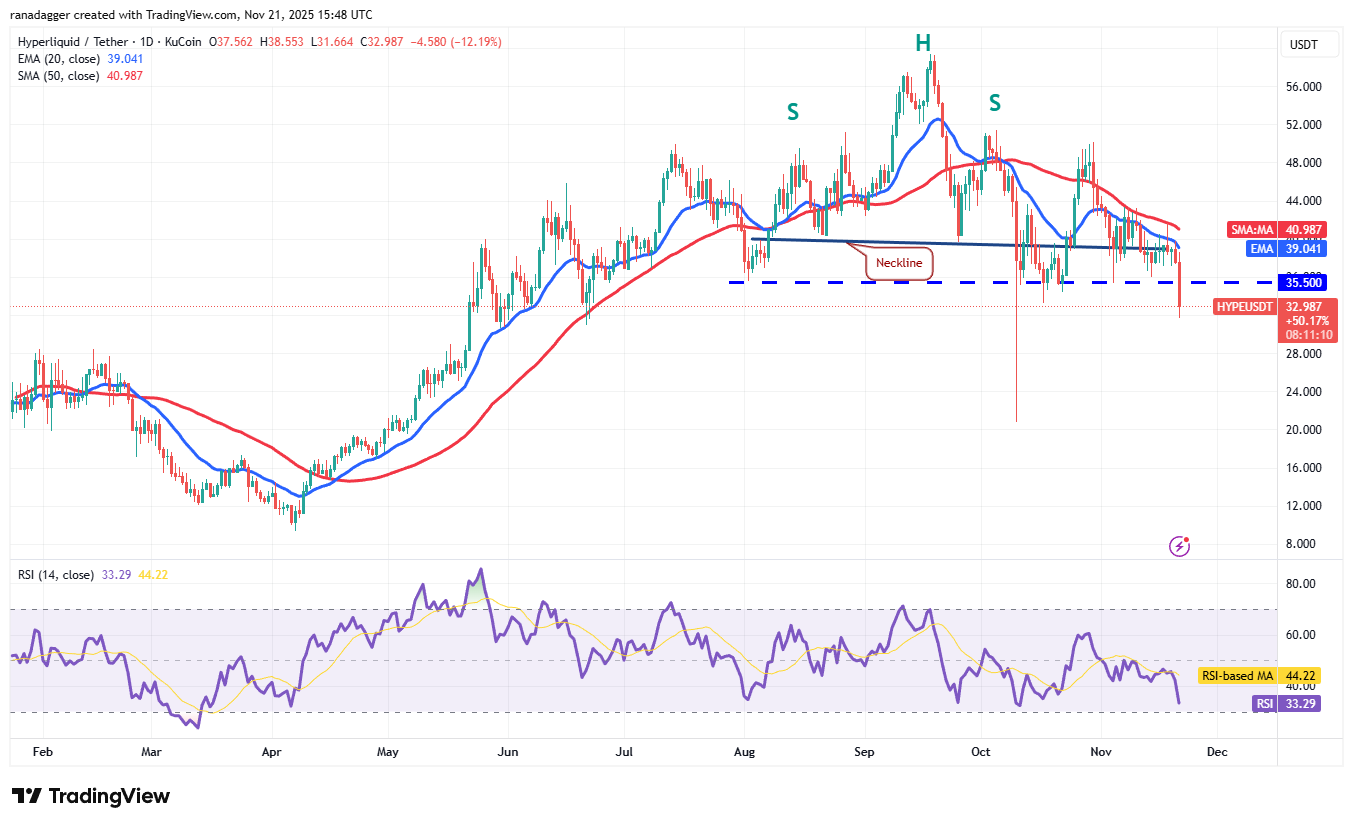
The selling picked up, and the bears pulled the price below the $35.50 support on Friday. If the price closes below $35.50, the HYPE/USDT pair could start a new downtrend toward $28 and then $24.
Buyers will have to quickly reclaim the $35.50 level to signal that the market has rejected the breakdown. The bulls will gain the upper hand after they propel the Hyperliquid price above the 50-day SMA ($40.98).
Zcash price prediction
Zcash (ZEC) bounced off the 20-day EMA ($559) on Tuesday, but the up move is facing selling near $750.
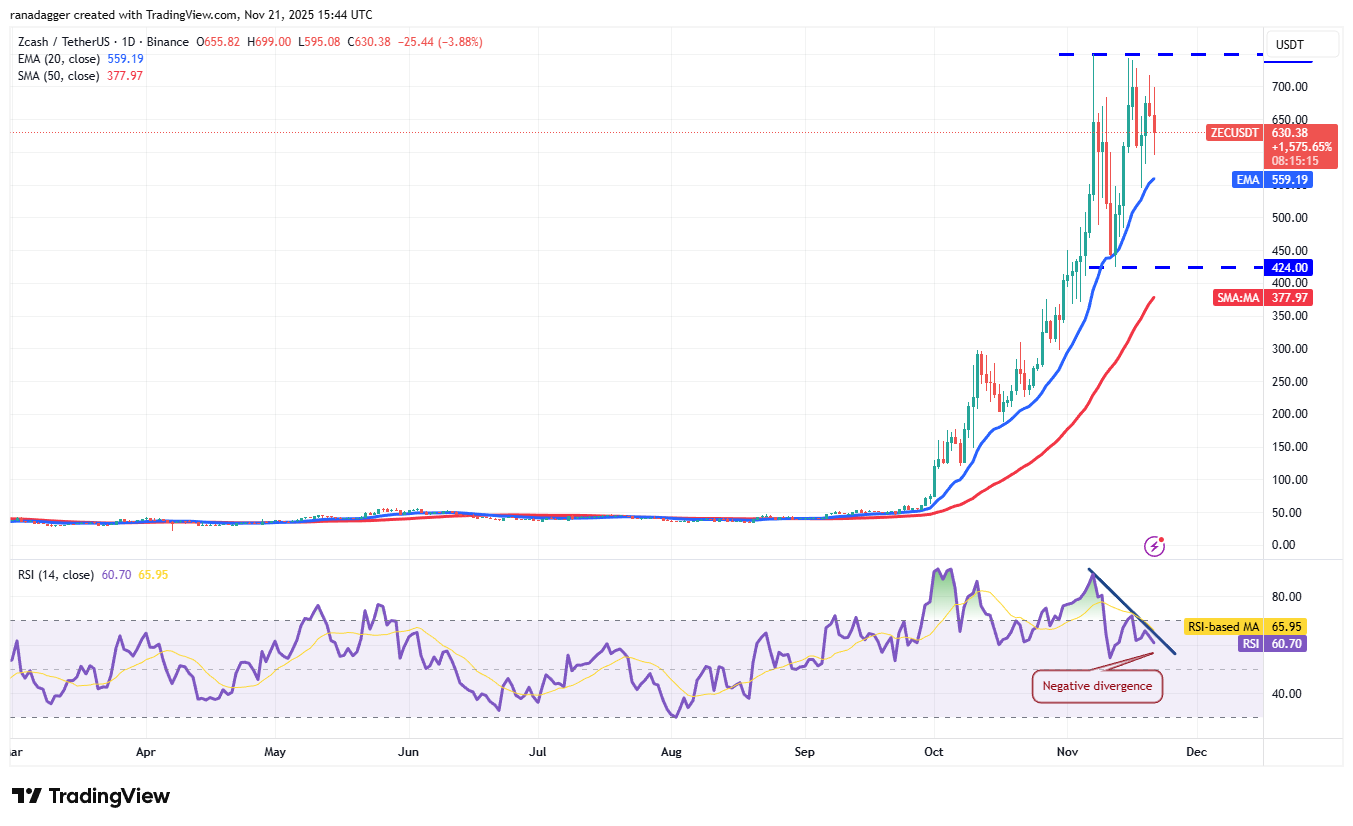
The negative divergence on the RSI suggests weakening bullish momentum. Sellers will try to pull the Zcash price below the 20-day EMA. If they manage to do that, the ZEC/USDT pair could correct to $424.
On the other hand, the bulls will have to defend the 20-day EMA if they want to retain the advantage. A close above the $750 resistance could start the next leg of the uptrend toward the psychological level of $1,000.
Bitcoin Cash price prediction
Bitcoin Cash (BCH) made a sharp recovery from the solid support at $443, indicating that the bulls are aggressively defending the level.
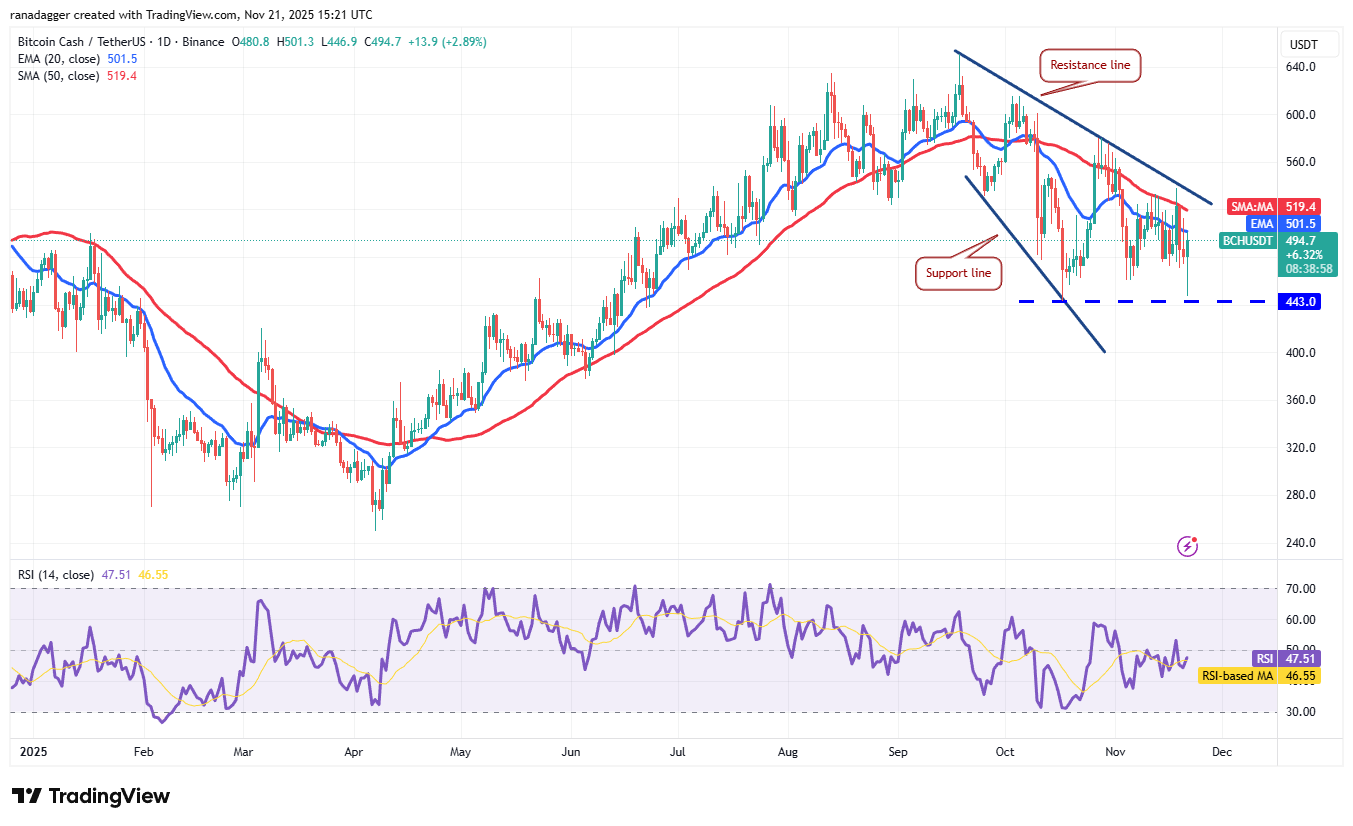
The relief rally is expected to face selling at the resistance line of the falling wedge pattern. If the price turns down from the resistance line and breaks below the moving averages, it suggests that the bears remain active at higher levels. The bears will then make one more attempt to sink the BCH/USDT pair below $443.
Conversely, a break and close above the resistance line signals a potential trend change. The Bitcoin Cash price could rally to $580 and then to $615.
This article does not contain investment advice or recommendations. Every investment and trading move involves risk, and readers should conduct their own research when making a decision.
