


Bitcoin (BTC) slipped into its deepest undervaluation against gold (XAU) on Friday, reviving expectations of a potential capital rotation away from the precious metal and back into cryptocurrency markets in 2026.
Key takeaways:
-
Bitcoin is at a record undervaluation versus gold, a level historically linked to major BTC bottoms.
-
Past gold-led cycles favor a bullish outlook for BTC price in 2026.
Bitcoin will “massively outperform gold” in 2026
The undervalued reading came from the BTC–XAU ratio’s Z-score, a metric that measures how far the current ratio deviates from its long-term average.
A reading below −2 indicated that Bitcoin was trading more than two standard deviations below its historical norm compared to gold, which is extremely rare. In this case, BTC entered the model’s lowest band for the first time on record.
Historically, moves in the BTC/XAU ratio toward the −2 standard deviation zone preceded extended periods of Bitcoin outperforming gold, as shown in the Power-Law bands graph below.
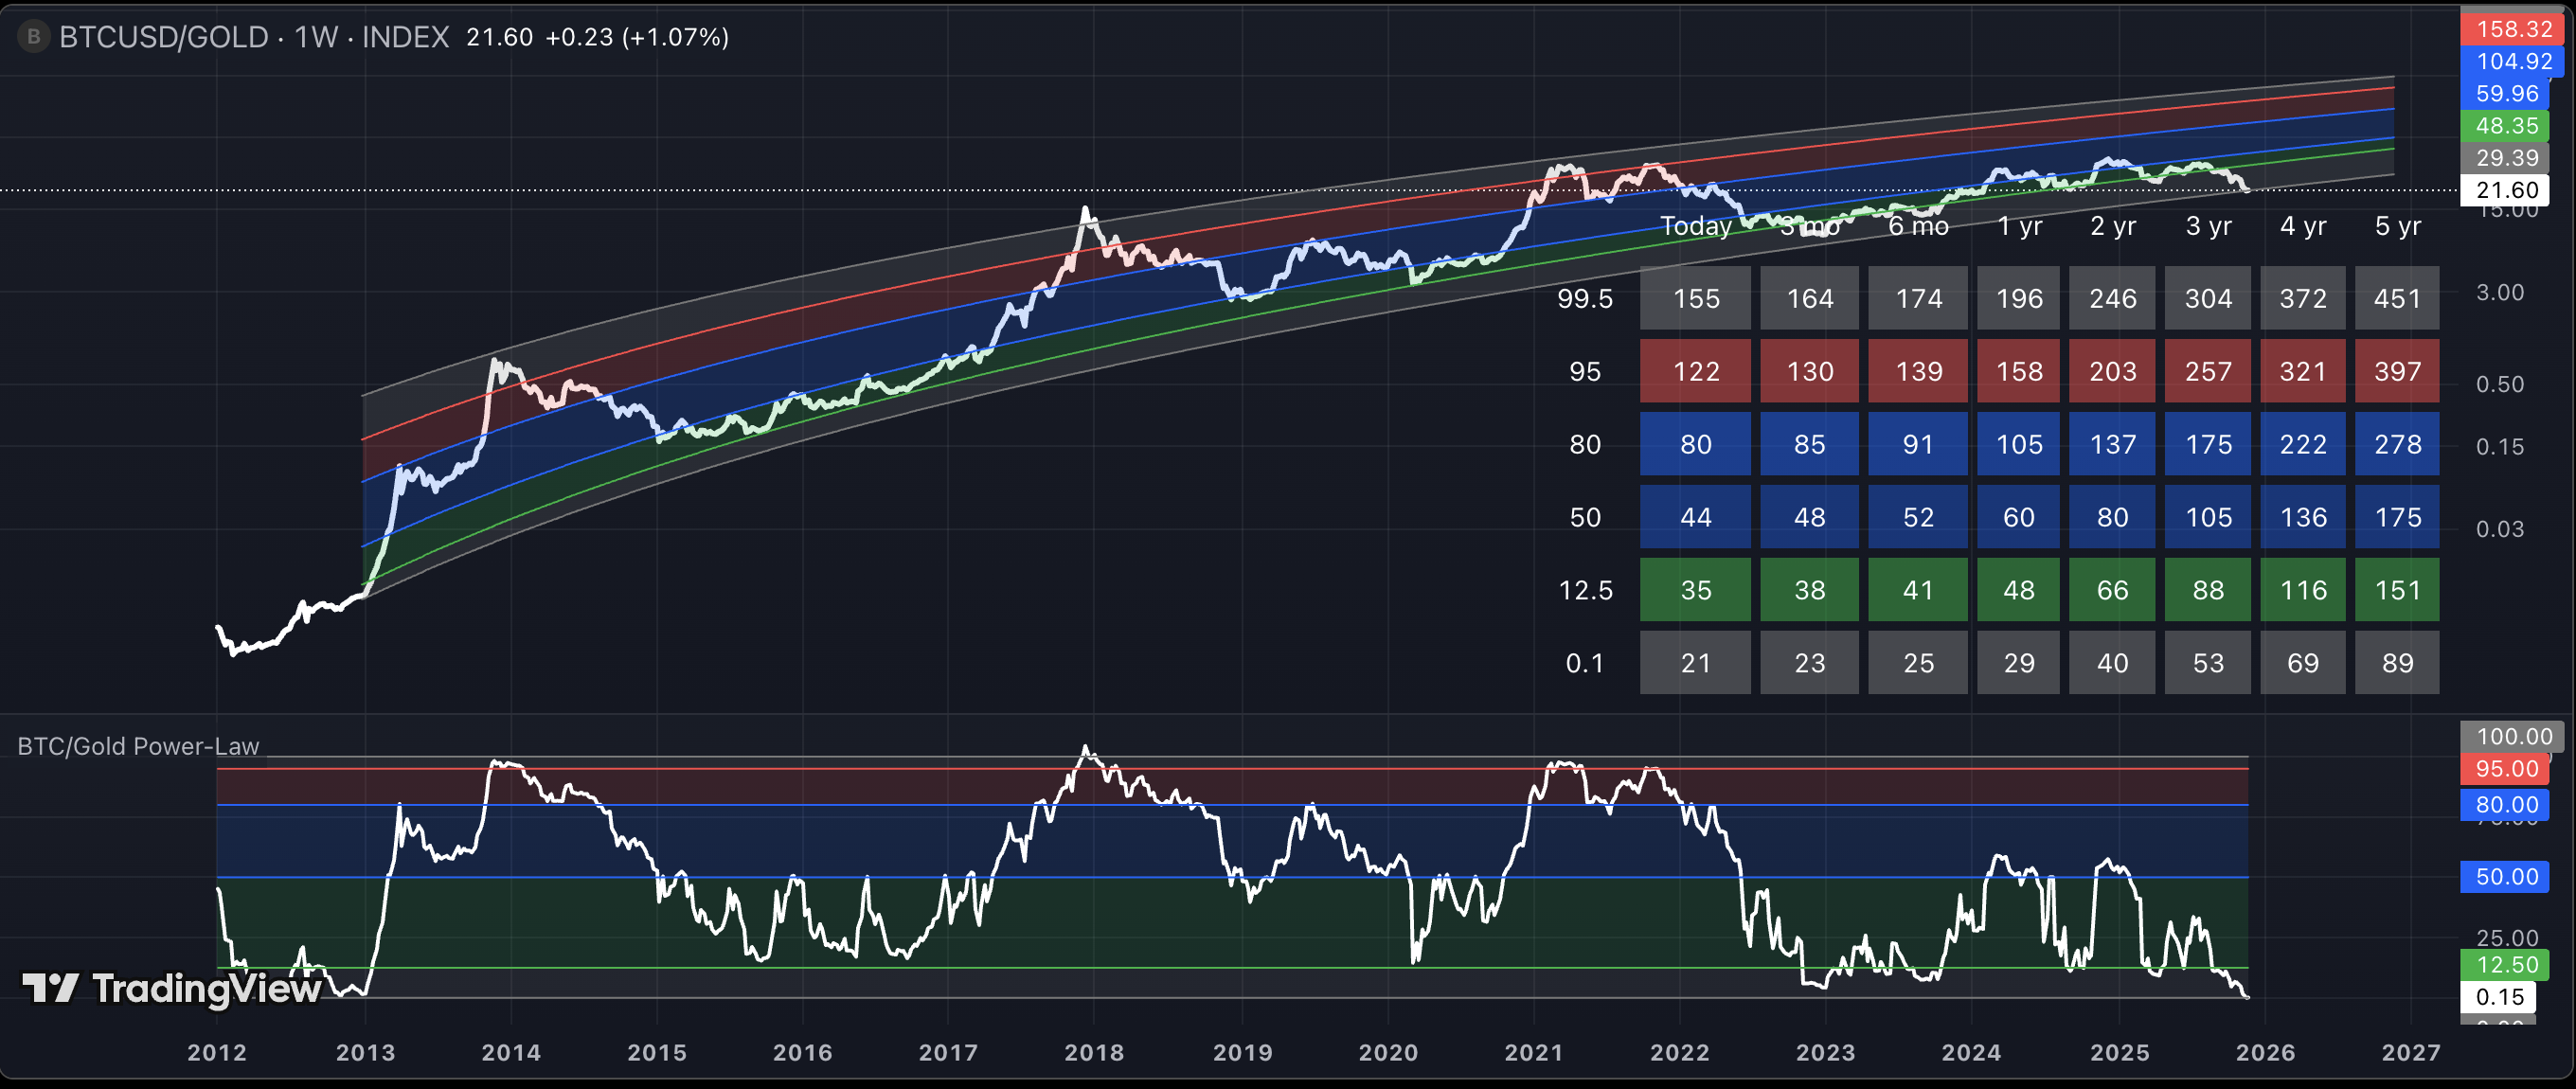
“Everything points to Bitcoin massively outperforming Gold over the coming months,” said Julius, the analyst who conceptualized the BTC/Gold Power-Law bands and the Z-score oscillator
What does gold’s record rally mean for BTC price?
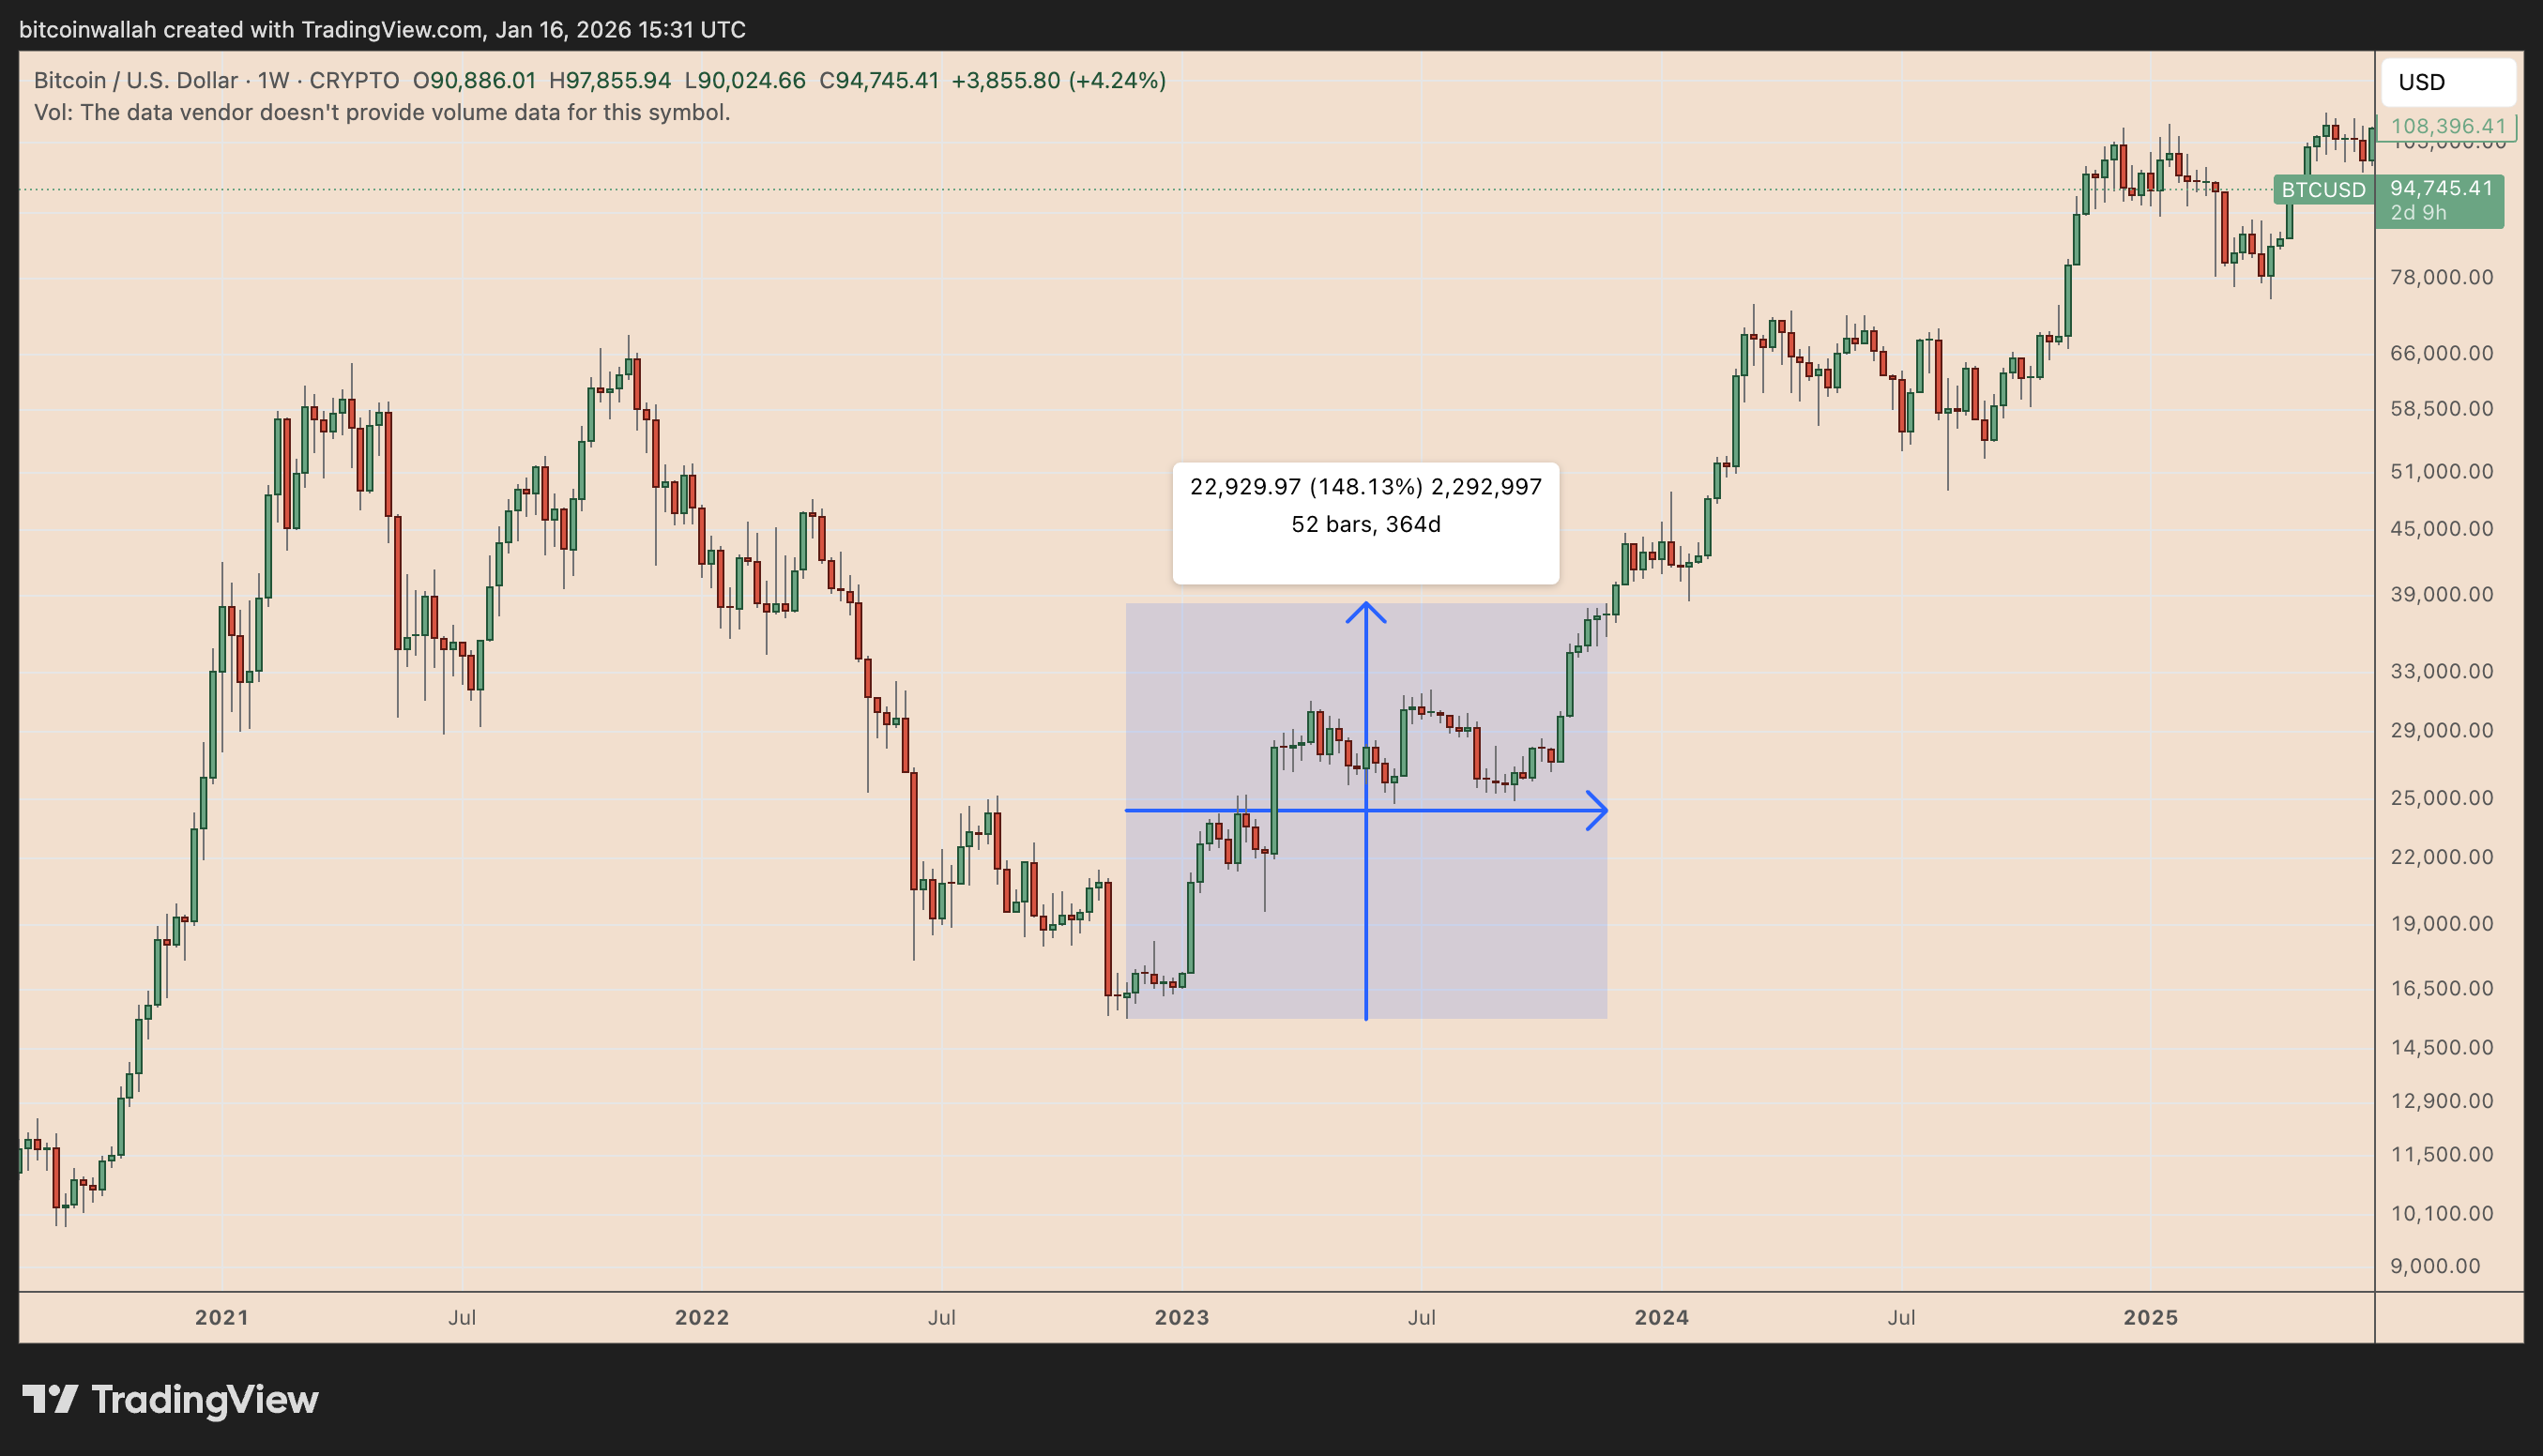
In the past, the Z-score’s dips toward the −2 standard deviation zone marked major Bitcoin bottoms.
For instance, a BTC/XAU undervaluation signal in November 2022 preceded a roughly 150% BTC price rally over the following year.
Similarly, Bitcoin rose by over 1,170% a year after the signal’s appearance in March 2020.
The Z-score correctly called Bitcoin’s macro tops, as well, according to Julius.
“At the end of 2017, Bitcoin was extremely overbought, while Gold was oversold,” he wrote in a X post on Jan. 3, adding:
“Shortly after, Bitcoin entered a bear market, and Gold began a multi-year rally toward new ATHs.”
In addition, historical data suggests that Bitcoin’s strongest price expansions tend to follow gold bull markets.
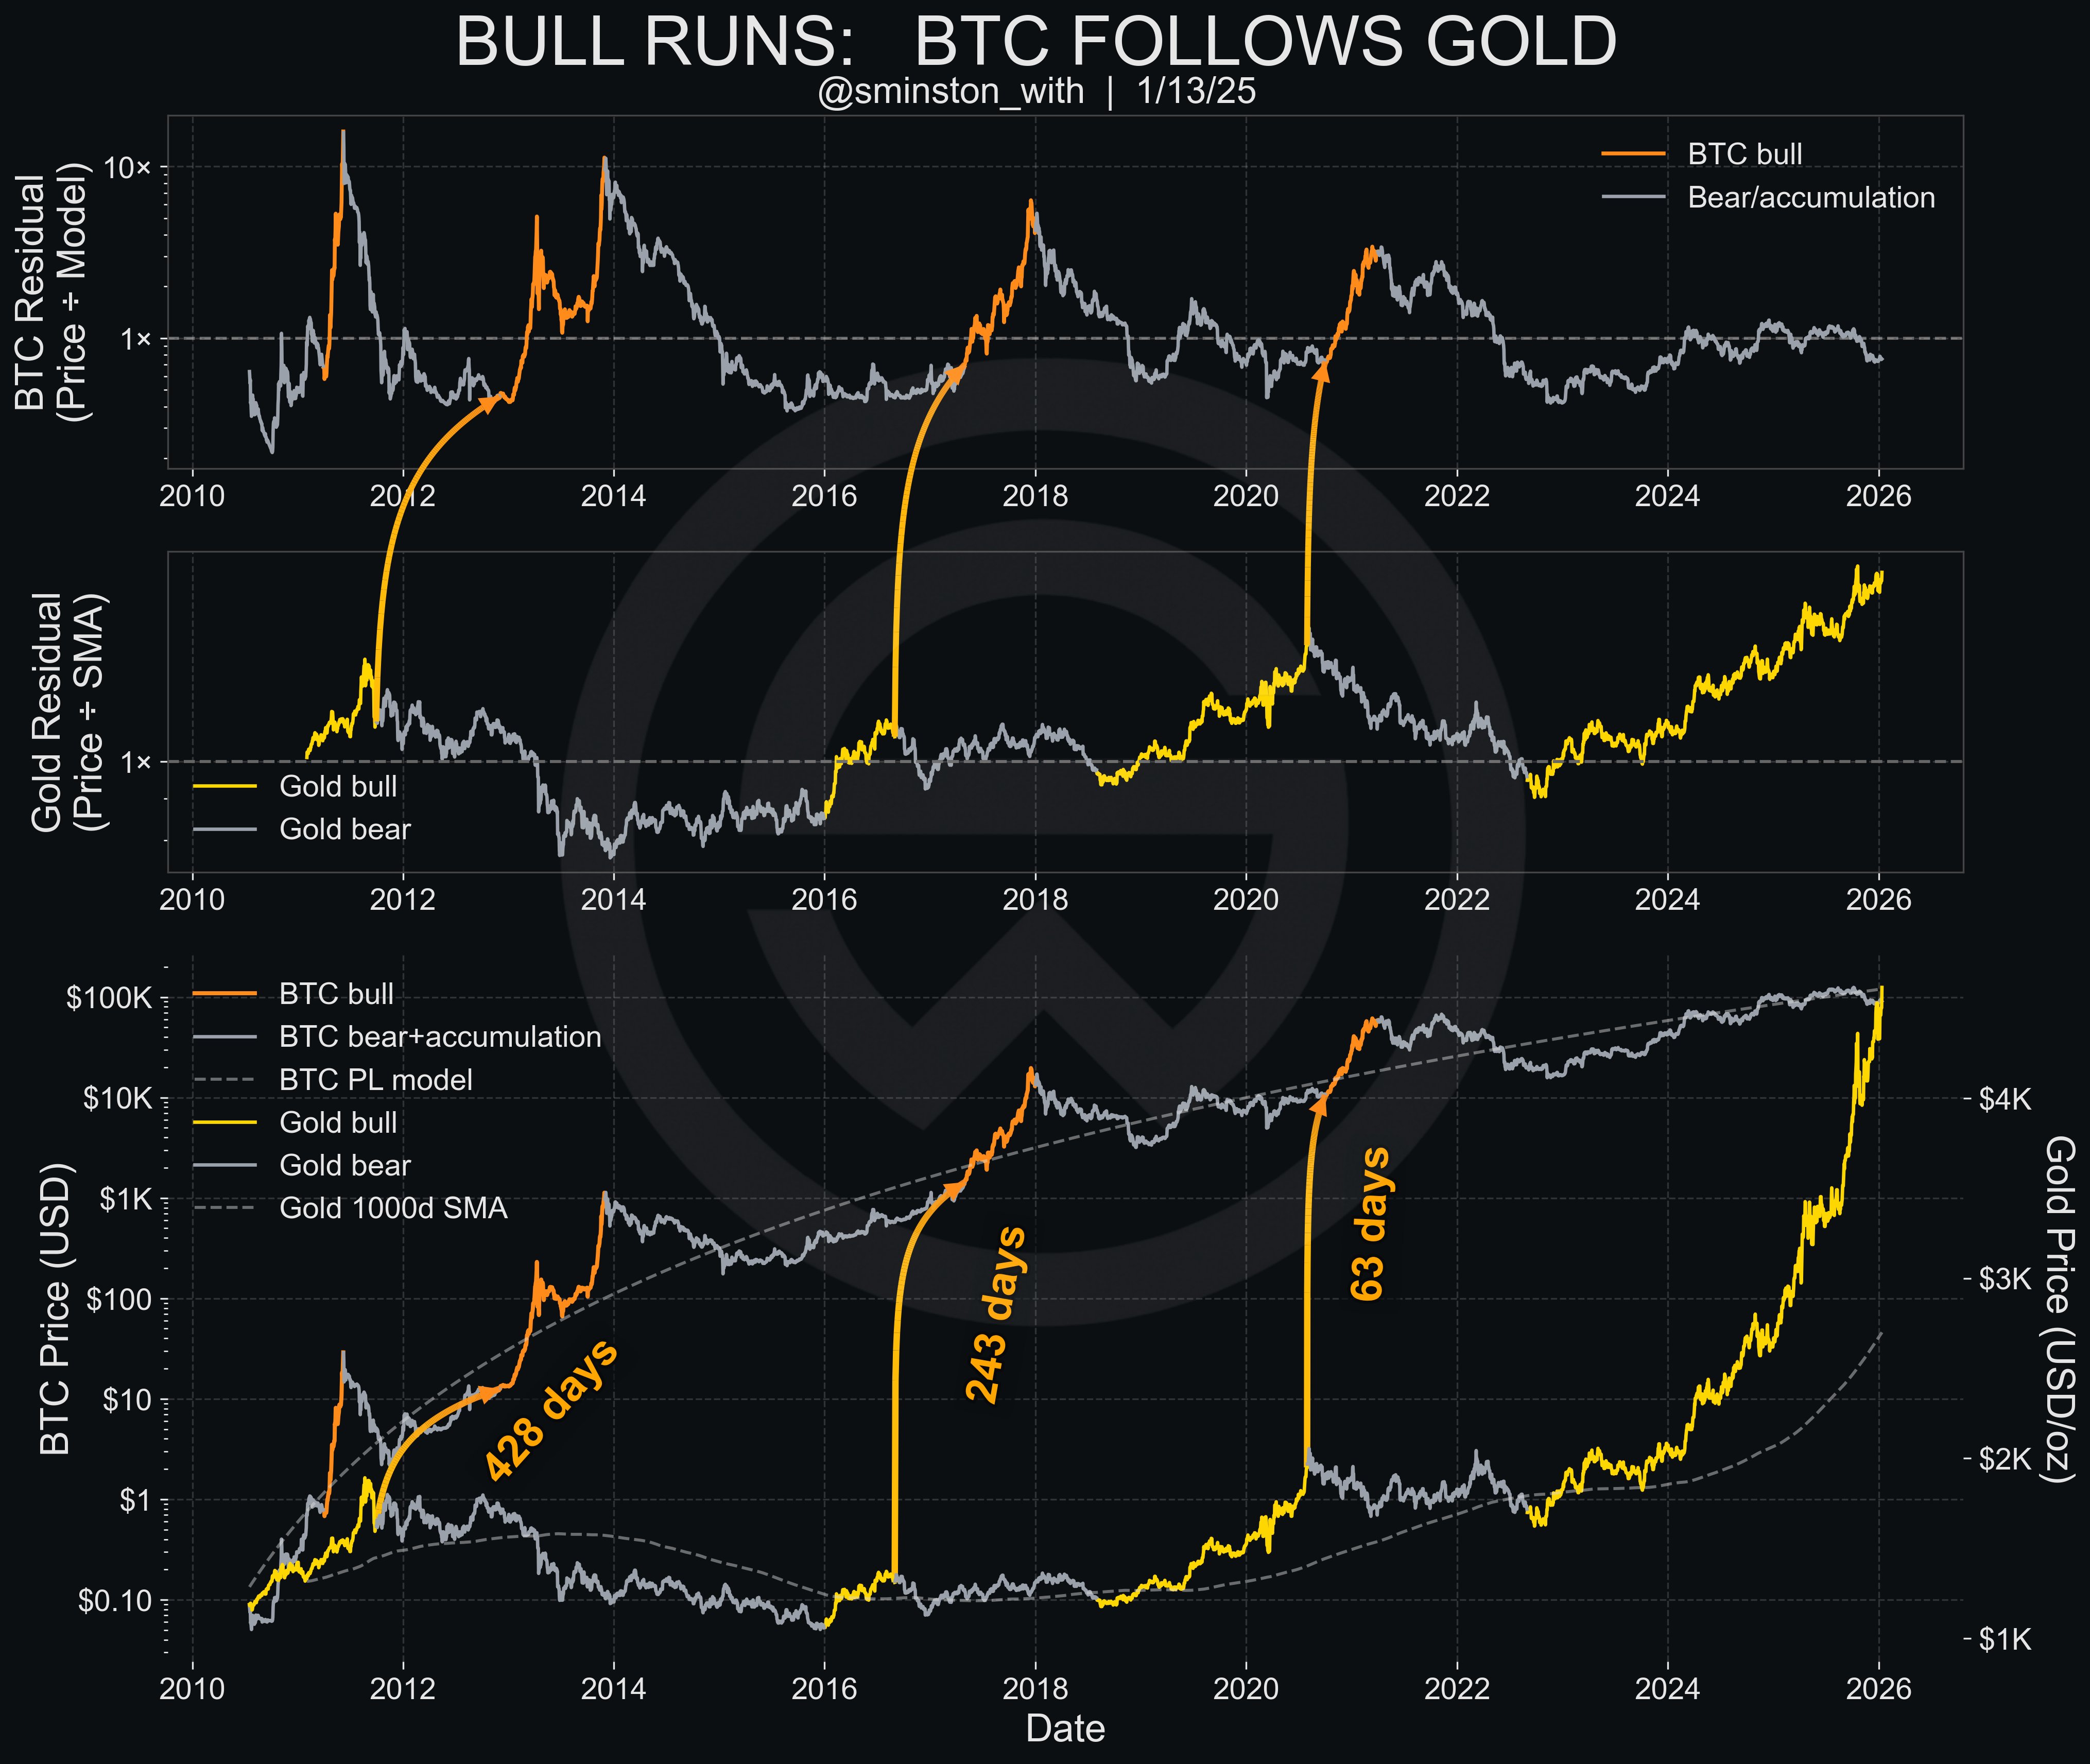
BTC began its parabolic phases only after gold had already moved decisively above its long-term trend. In previous cycles, this lag ranged from roughly two months to over a year, after which BTC delivered its largest percentage gains.
Related: Bitcoin-gold correlation signals at least 50% BTC price gains by March
Bitcoin’s discount versus gold, therefore, suggested a bullish price outlook for BTC in 2026, provided the historical pattern holds.
Multiple analysts projected BTC would reach $200,000–$300,000 by the year’s end.
This article does not contain investment advice or recommendations. Every investment and trading move involves risk, and readers should conduct their own research when making a decision. While we strive to provide accurate and timely information, Cointelegraph does not guarantee the accuracy, completeness, or reliability of any information in this article. This article may contain forward-looking statements that are subject to risks and uncertainties. Cointelegraph will not be liable for any loss or damage arising from your reliance on this information.
