


Bitcoin (BTC) could reclaim $100,000 as support and rally toward $107,000 in the coming days, driven by a combination of supportive technical and fundamental metrics.
Key takeaways:
-
Bitcoin’s breakout is gaining traction, backed by bullish technicals and fading selling pressure.
-
Macro signals lean bullish, with liquidity expansion and divergence between BTC and gold.
Ascending triangle, bull cross raise BTC rally odds
Bitcoin confirmed its breakout from a multi-week ascending triangle earlier this week and shifted into a textbook post-breakout retest phase.
After pushing above the pattern’s upper boundary near $95,000, BTC pulled back to retest the former resistance as support before bouncing higher, a move typically associated with valid breakouts rather than false moves.
Holding this reclaimed level keeps the “real breakout” structure intact and preserves the pattern’s measured upside objective near $107,000, derived by adding the triangle’s maximum height to the breakout point, by February.
At the same time, Bitcoin’s daily chart approached a potential bullish crossover between the 20-day (green) and 50-day (red) exponential moving averages (EMAs).
The last time BTC printed a similar bull cross, the BTC price advanced by roughly 17% over the following month, strengthening the case for trend continuation if the signal is confirmed.
Bitcoin long-term holders reduce selling
Bitcoin’s breakout gained credibility as selling pressure from long-term holders continued to fade.
Data tracking UTXOs spent by OG Bitcoin holders, coins dormant for more than five years, showed that distribution into recent local tops had slowed materially.
As of January, the 90-day average of spent outputs peaked near 2,300 BTC earlier in the cycle but later declined toward the 1,000 BTC level, suggesting fewer coins hitting the market.
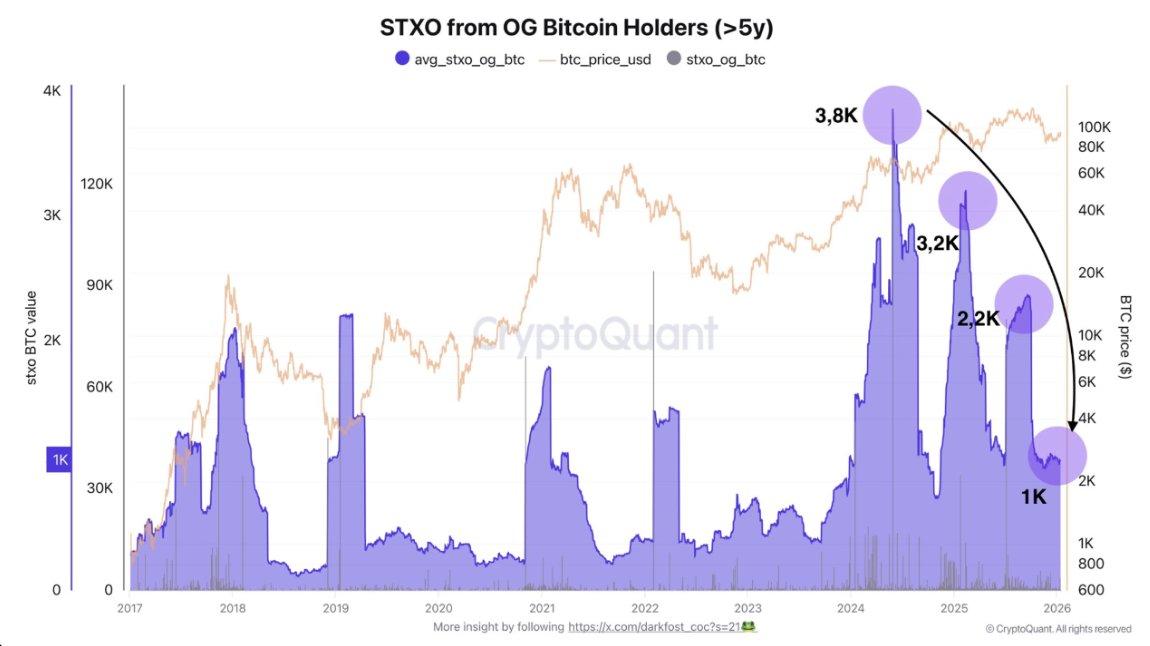
Earlier in the rally, OG selling had surged to levels well above the previous bull market, reflecting an unusually attractive exit window created by spot ETF demand, deeper liquidity, and institutional participation.
“This suggests that OGs have also slowed down their selling,” said analyst DarkFrost, adding:
“Their selling pressure, which can sometimes be massive, has clearly decreased, and the prevailing trend now seems to lean more toward holding rather than distribution.”
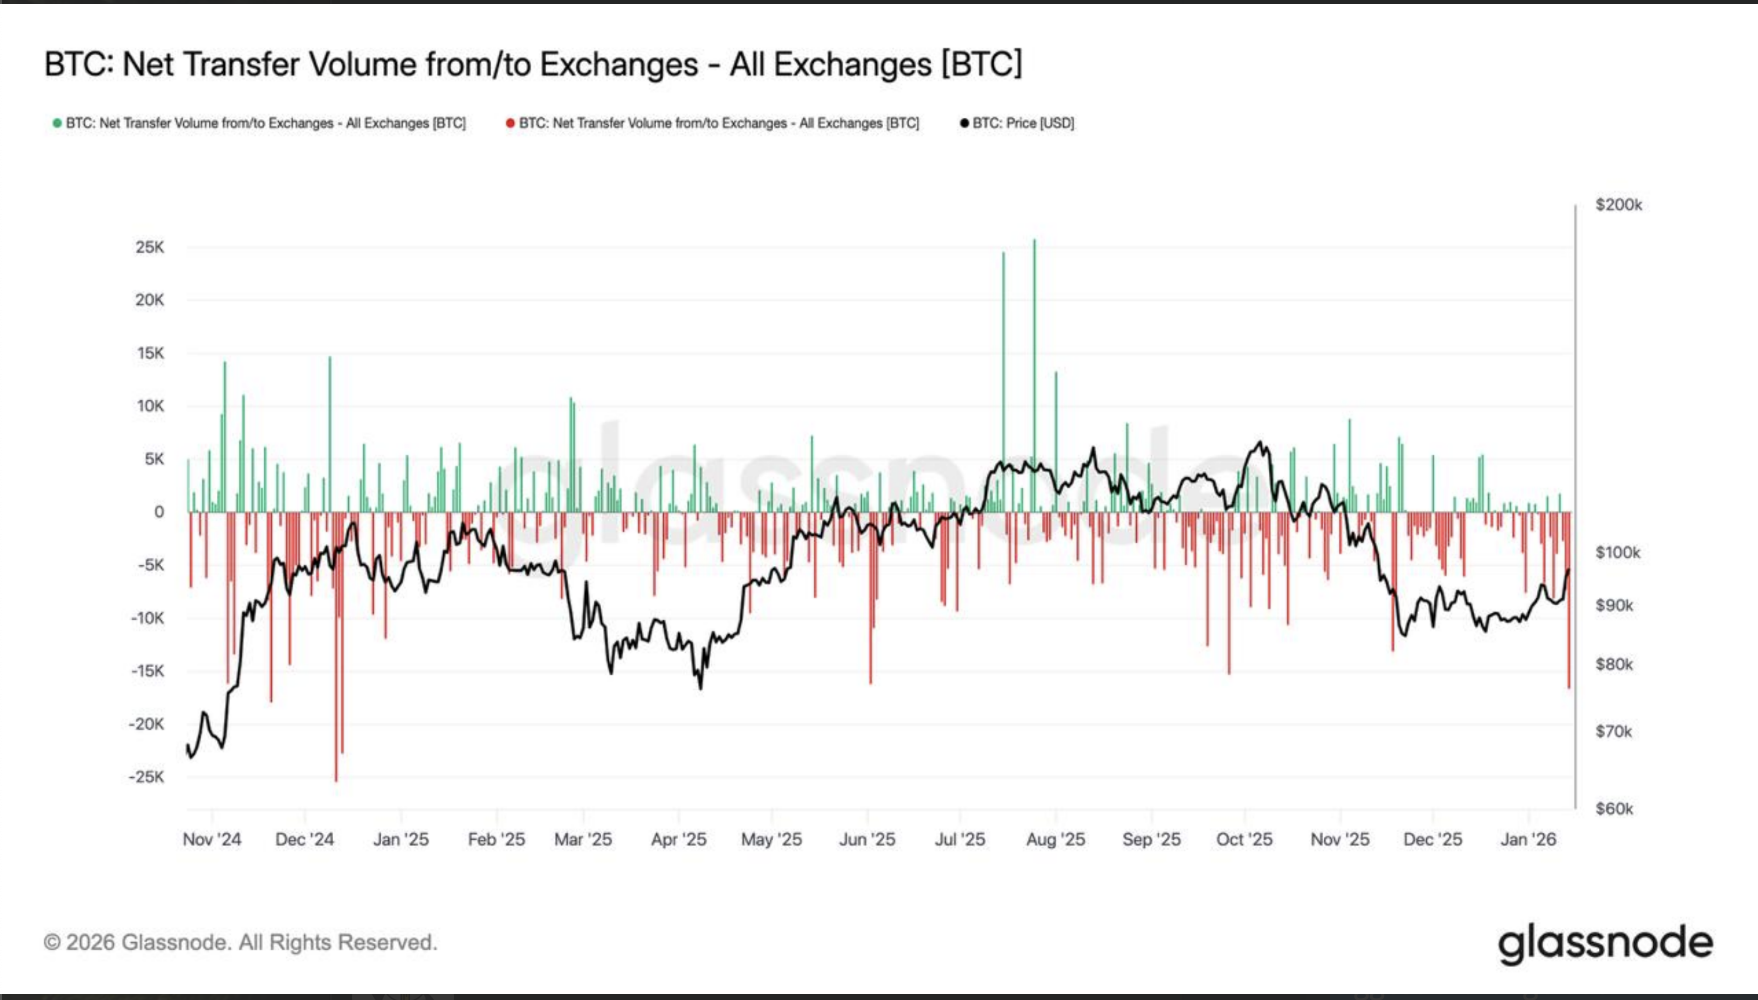
The slowdown in OG selling also aligned with the largest net Bitcoin outflows from exchanges since December 2024.
Negative Bitcoin-gold correlation: Bullish for BTC?
Another macro signal aligned with the breakout thesis came from Bitcoin’s historical relationship with gold.
In past instances where BTC’s correlation with gold turned negative, Bitcoin rallied by an average of 56% within roughly two months. The lone exception in May 2021 was driven by exogenous shocks, including China’s mining crackdown and forced deleveraging.

As of 2026, the setup appeared more favorable, supported by rising global liquidity and the end of the Federal Reserve’s quantitative tightening.
Related: Bitcoin ‘groove’ to return despite gold, Nasdaq spotlight: Arthur Hayes
This article does not contain investment advice or recommendations. Every investment and trading move involves risk, and readers should conduct their own research when making a decision. While we strive to provide accurate and timely information, Cointelegraph does not guarantee the accuracy, completeness, or reliability of any information in this article. This article may contain forward-looking statements that are subject to risks and uncertainties. Cointelegraph will not be liable for any loss or damage arising from your reliance on this information.
