


Solana (SOL) price has possibly formed a bottom around $100 on multiple time frames, a setup that could help SOL price recover toward $260 in the long term.
Key takeaways:
SOL must break several resistances before $260
SOL’s price action has led to the appearance of a possible V-shaped recovery pattern on the four-hour chart.
This follows a sharp drop that saw SOL price fall 25% from a high of $127, which was stopped by buyers around the $100 support level.
Related: ParaFi Capital makes $35M investment in Solana-based Jupiter
The relative strength index (RSI) had increased to 36 from oversold conditions at 18 in the four-hour timeframe, indicating some upward momentum.
The daily RSI was oversold at 29, a level that has previously marked market bottoms and triggered SOL price rebounds.
Related: ‘Very wide gap’ between XRP and Solana investor interest: Exec
As the bulls hope to complete the V-shaped pattern, the price faces key barriers in its recovery path, including the $113-$115 supply band, where some key trendlines converge.
The second area of interest is the $125-$130 supply zone, defined by the 50-day EMA and 50-day SMA, respectively.
Above that, the SOL/USD pair could rise further toward the pattern’s neckline around the $150 supply zone, representing a 44% climb from the current price.
Zooming out, the weekly chart reveals strong support for SOL at $95-$100, as shown below.
The last rebound from this level triggered a 166% SOL price rally to $250 from $95 between April 2025 and September 2025.
If the same scenario plays out, SOL could extend today’s recovery over the coming weeks or months to $260, representing a 150% increase from the current levels.
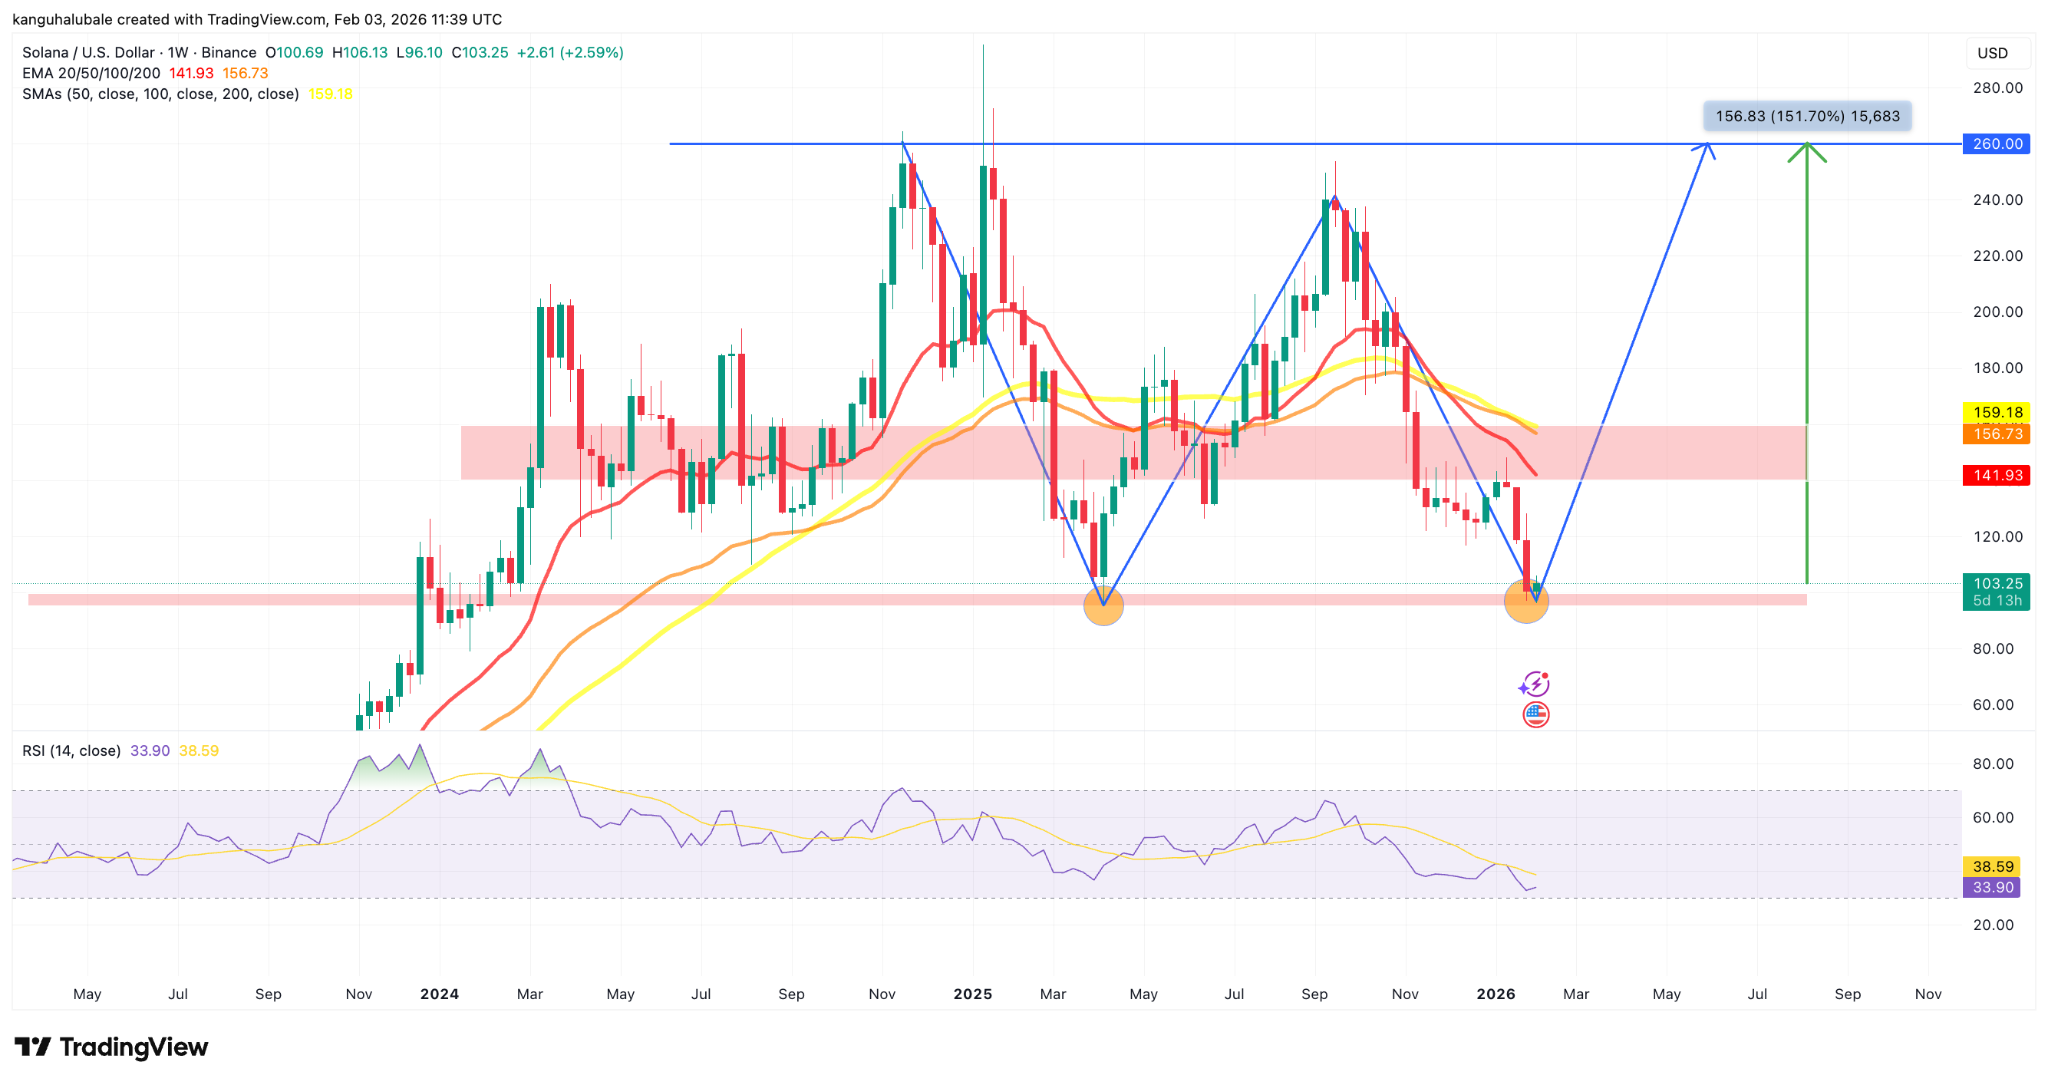
The 50-week MAs sit between $140-$160, a zone that has historically delayed price rallies as resistance.
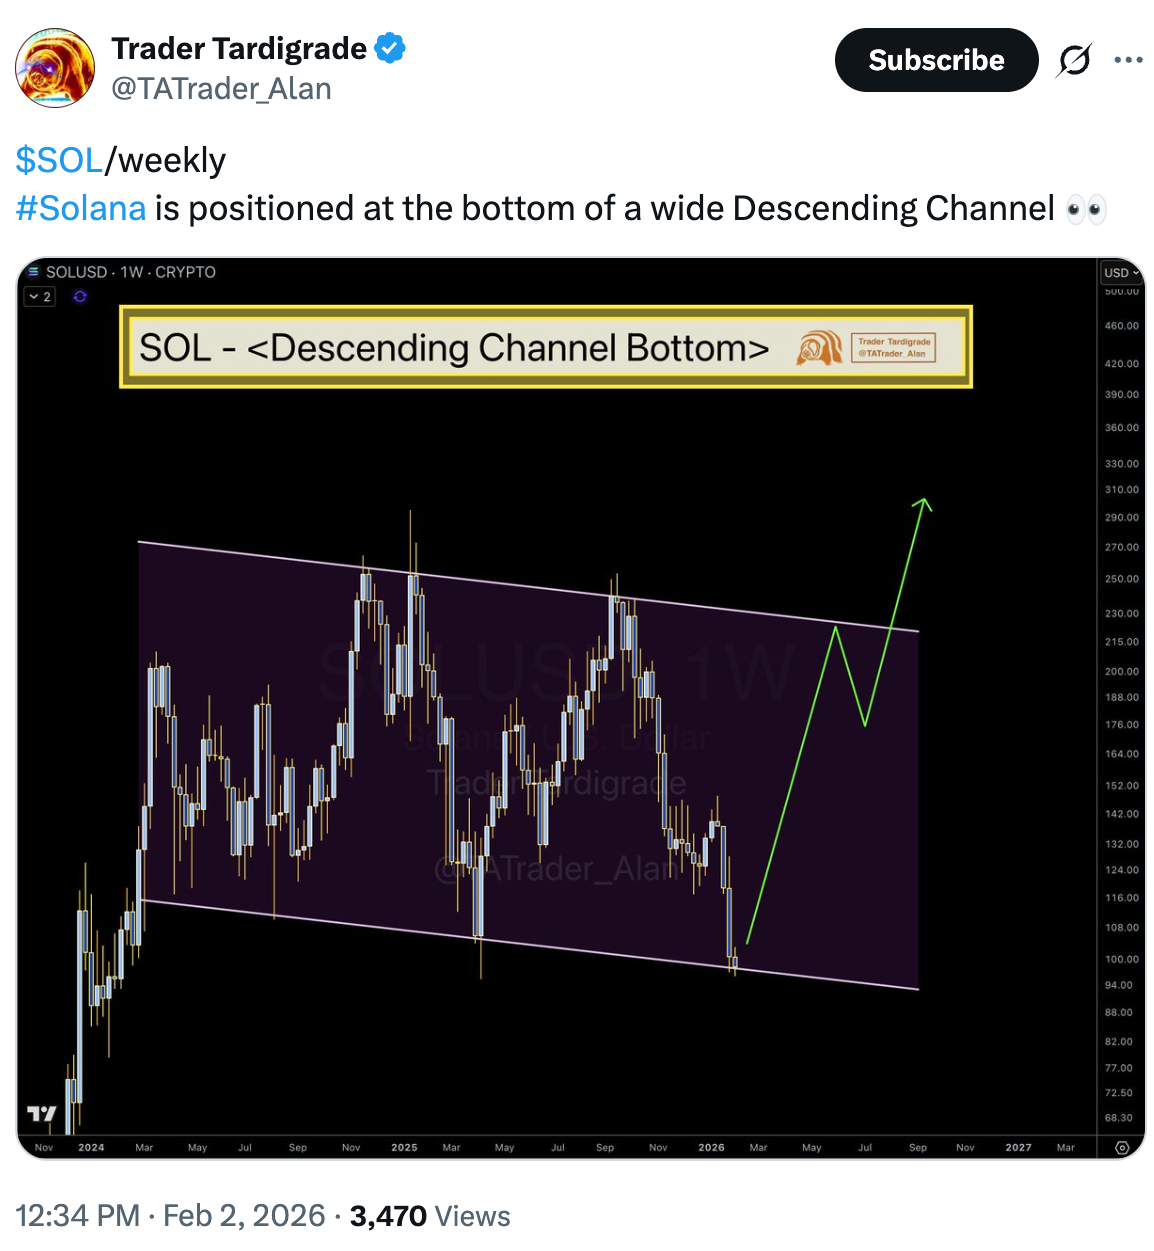
Trader Tardigrade said that SOL’s rebound from the lower boundary of the descending channel could see it rise toward the upper boundary around $215.
As Cointelegraph reported, SOL price may rise toward the $120-$150 range if the 20-day EMA at $106 is reclaimed as support.
Solana’s TVL and network activity rise
Solana’s primary decentralized application (DApp) metric started to display strength in mid-January.
The network’s total value locked (TVL), which measures the amount deposited in its smart contracts, rose to its highest level ever at 73.4 million SOL on Monday, worth about $7.5 billion at current rates. This represents an 18% increase over the last week.
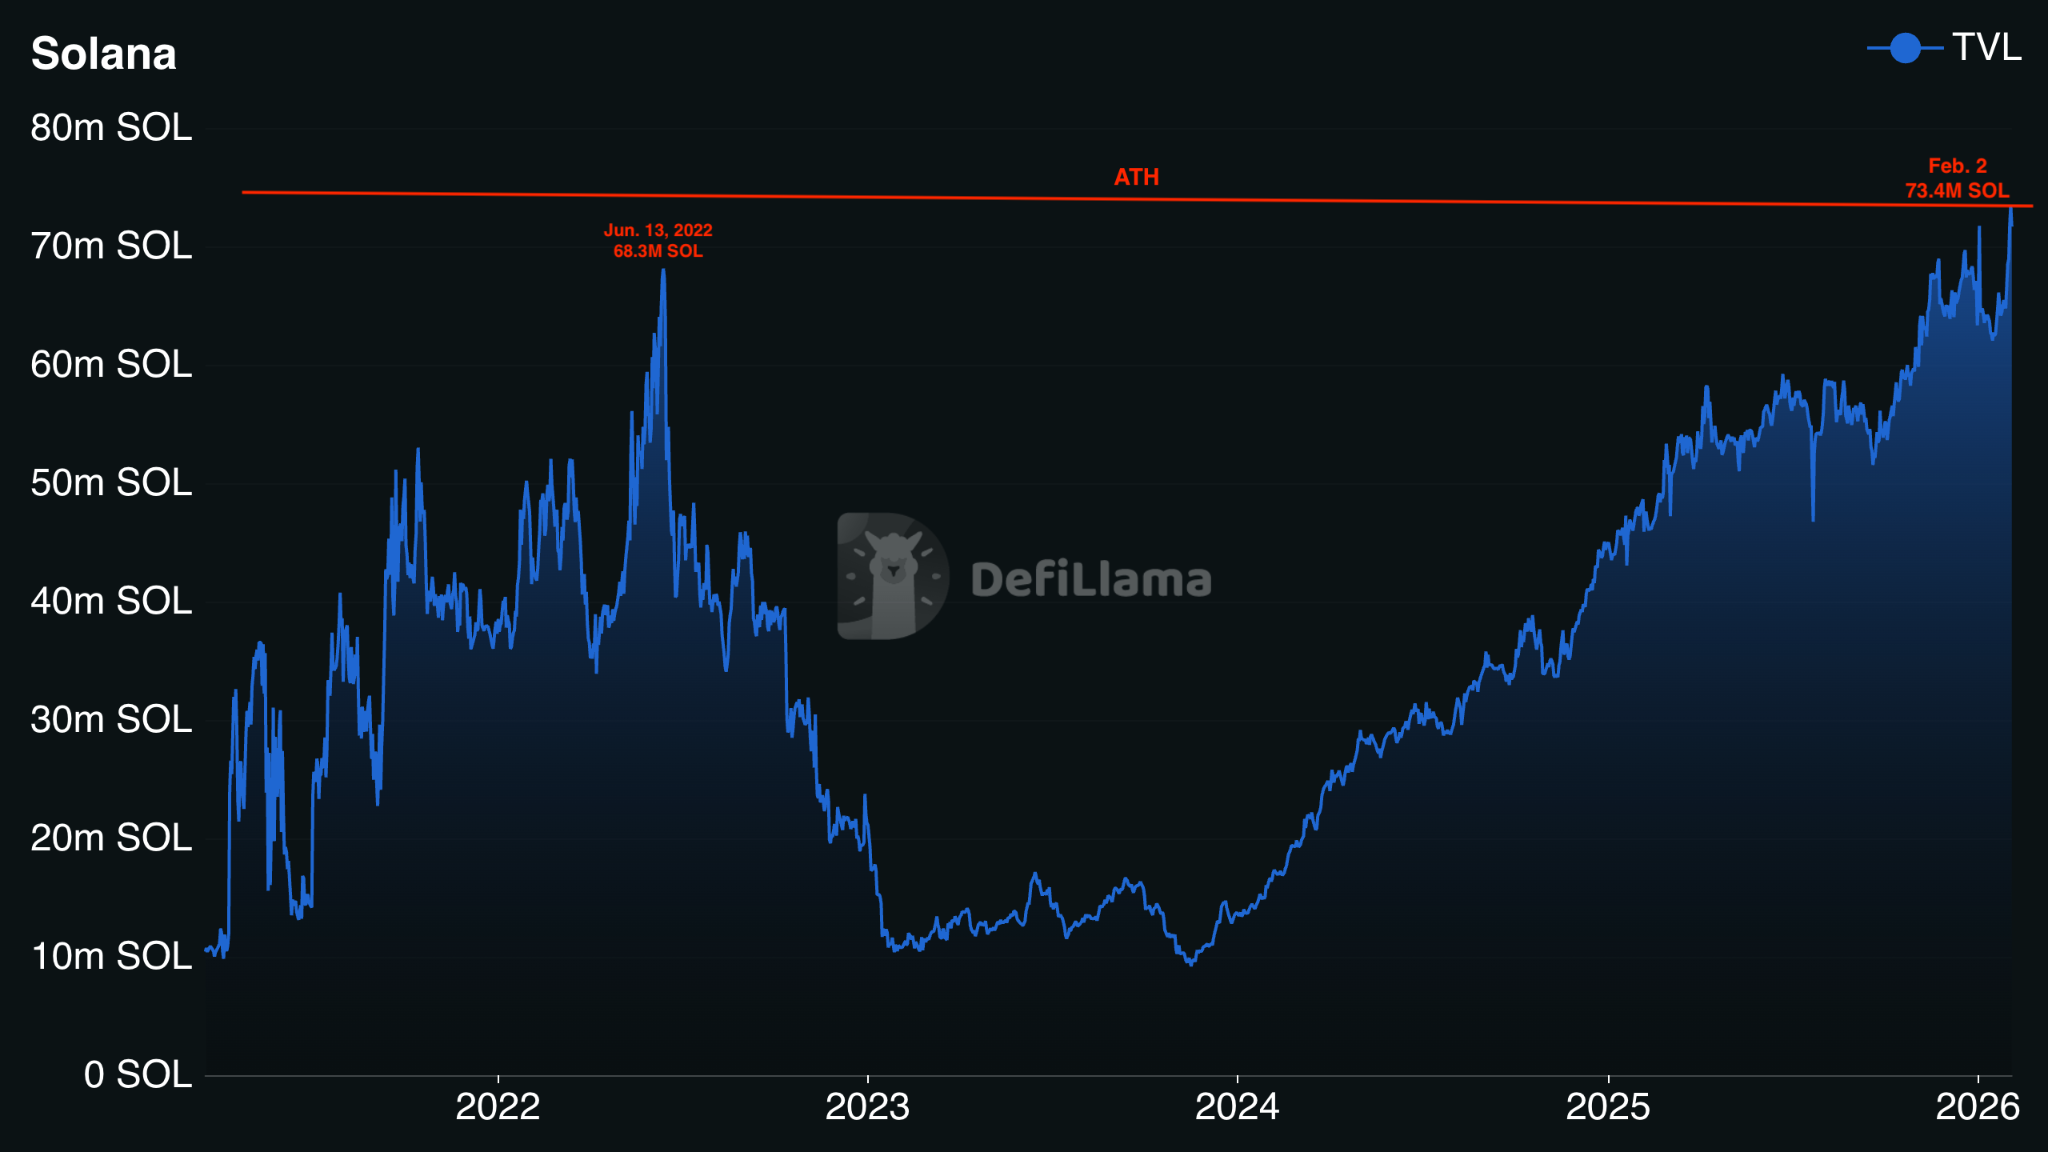
The last time this metric hit daily peak levels was in June 2022, when the TVL topped $68.3 million SOL. This surge was largely fueled by high network activity and the NFT boom on Solana in 2021. This was accompanied by 80% gains in SOL’s price between June and August 2022.
Additionally, the daily transaction count on Solana hit a two-year high of 109.5 million on Monday.
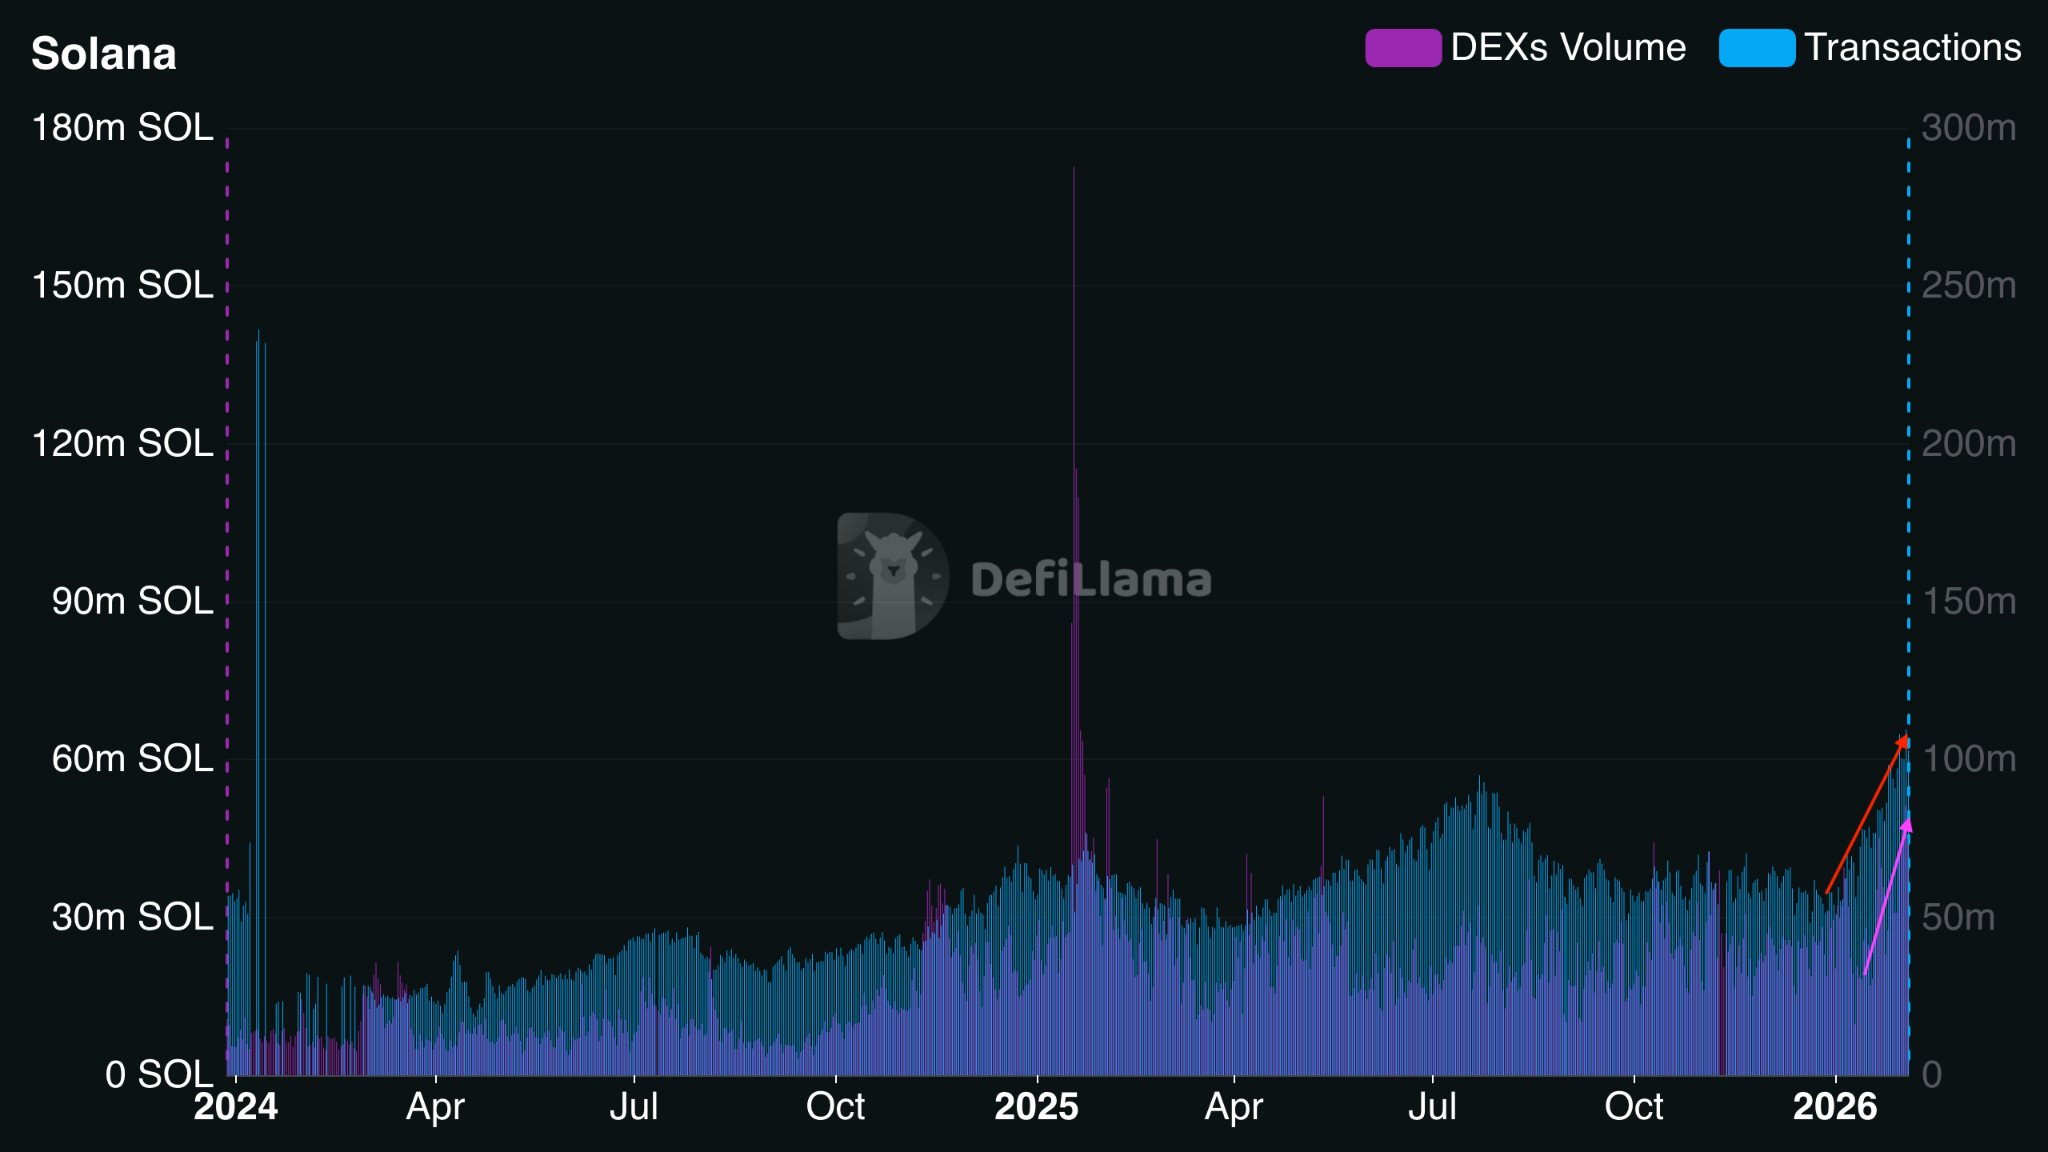
The daily DEX volume also reached an eight-month high of $51.3 million SOL on Monday, while the weekly DEX trading volume hit a 12-month high of 264.8 million SOL during the week ending Sunday.
As Cointelegraph reported, daily active addresses on Solana saw a 115% increase during the second half of January, which has historically been bullish for SOL price going forward.
This article does not contain investment advice or recommendations. Every investment and trading move involves risk, and readers should conduct their own research when making a decision. While we strive to provide accurate and timely information, Cointelegraph does not guarantee the accuracy, completeness, or reliability of any information in this article. This article may contain forward-looking statements that are subject to risks and uncertainties. Cointelegraph will not be liable for any loss or damage arising from your reliance on this information.
