


Key takeaways:
-
A 2021-style bearish divergence on the weekly chart points to a potential 50%+ correction toward $64,000.
-
Peter Brandt warns Bitcoin must reclaim its parabolic trendline soon or risk ending its bull cycle before reaching the $150,000 target.
Bitcoin’s (BTC) surge to a record $112,000 sparked renewed hopes for a $150,000 target by year-end, but its swift correction below $105,000 is testing that bullish narrative.
Is Bitcoin painting a bearish reversal setup?
Bitcoin is painting what appears to be an inverse cup-and-handle pattern, with its neckline near $100,800 acting as current support. As of June 7, the price has entered the handle-formation stage, eyeing a breakdown below the neckline.
Based on the inverse cup-and-handle pattern setup, a breakdown below $100,800 will increase Bitcoin’s likelihood of dropping toward $91,000.
The $91,000 downside target aligns with BTC’s 200-day exponential moving average (200-day EMA; the blue wave).
Bitcoin’s relative strength index (RSI) has declined in tandem with its price, signaling strong trader conviction behind the ongoing sell-off.
As of June 7, the RSI reading was 52, reflecting a weakening upside momentum; a break below 50 could intensify downside pressure.
To regain control, bulls must reclaim Bitcoin’s 20-day EMA (the purple wave) resistance at around the $105,000 level. A drop toward $91,000 could effectively lower BTC’s potential of hitting $150,000 by 2025’s end.
2021 fractal suggests BTC won’t hit $150,000 in 2025
At a broader timescale, Bitcoin’s weekly chart is flashing a familiar warning.
A bearish divergence has formed between price and RSI, mirroring the 2021 cycle top, when RSI trended lower despite higher price highs. That divergence preceded a 61% correction toward its 200-week EMA (the blue wave) and below.
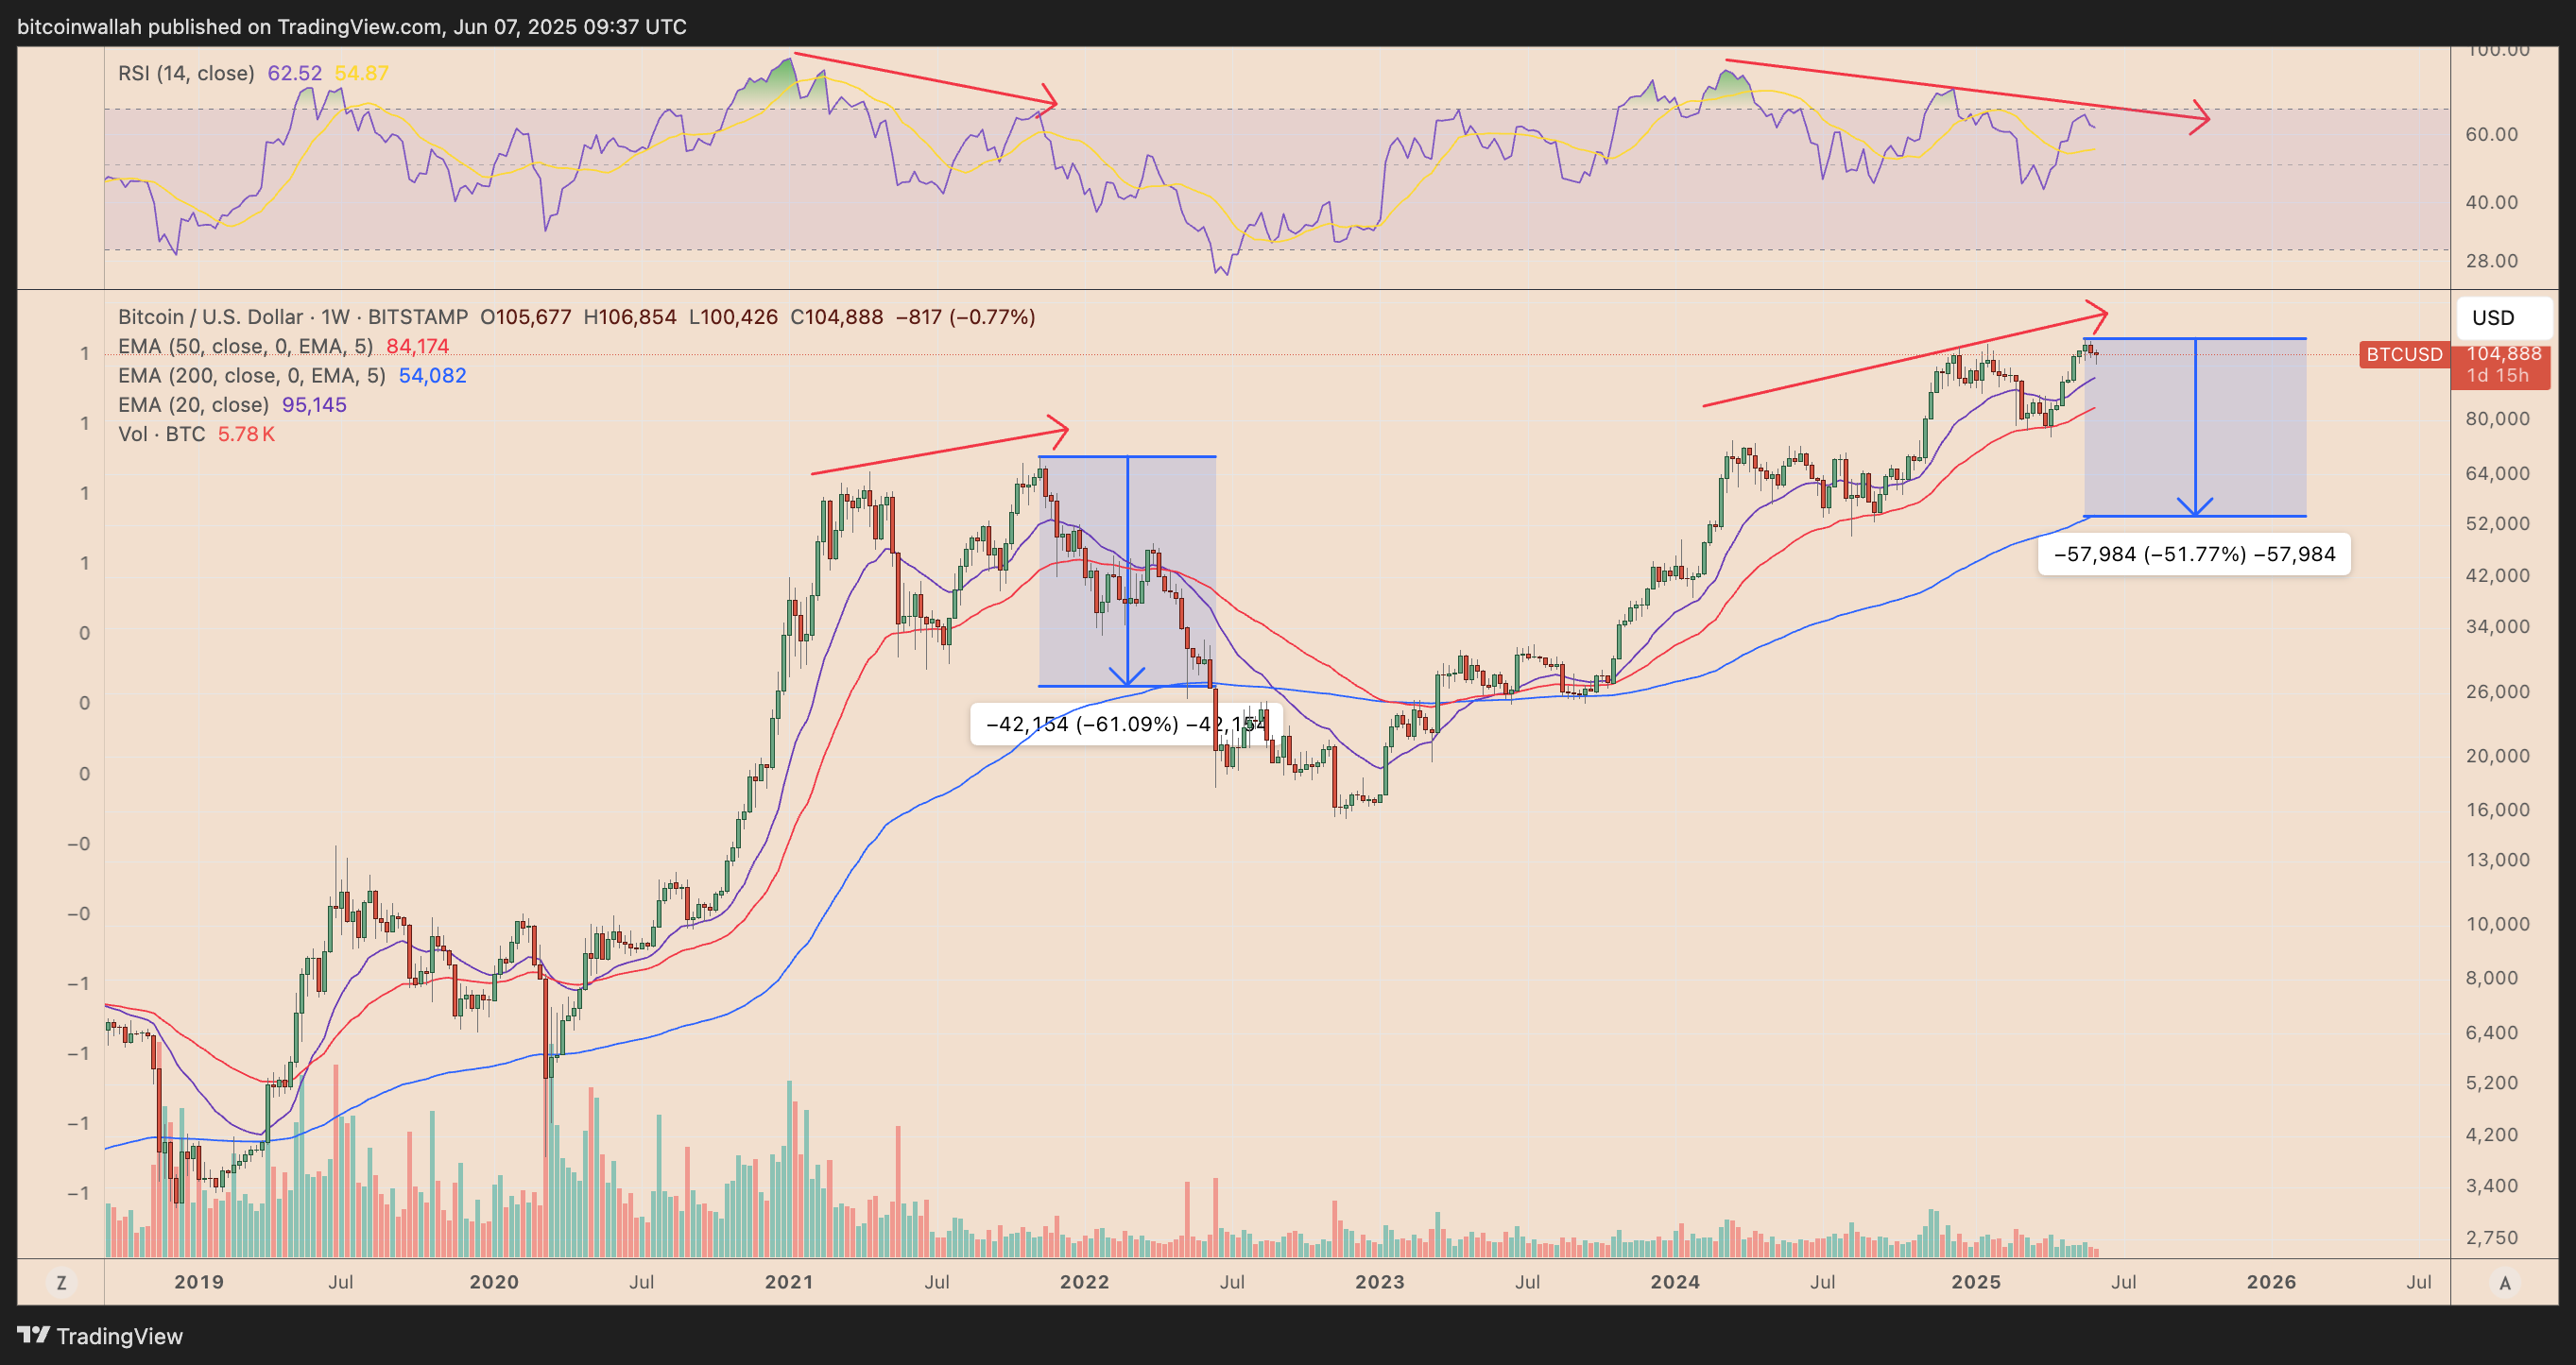
A similar structure is now visible, with a divergence forming just below the $112,000 high and a projected pullback target near the 200-week EMA at around $64,000, marking a potential 52% decline.
This historical setup casts doubt on Bitcoin reaching the widely discussed $150,000 target by the end of 2025, especially if the divergence confirms a broader market top similar to past cycles.
Veteran trader Peter Brandt adds further weight to this outlook.
In his May 2025 analysis, Brandt identified a rising wedge pattern and warned that Bitcoin must reclaim its parabolic trendline to stay on track for a $125,000–$150,000 cycle top by August or September 2025.
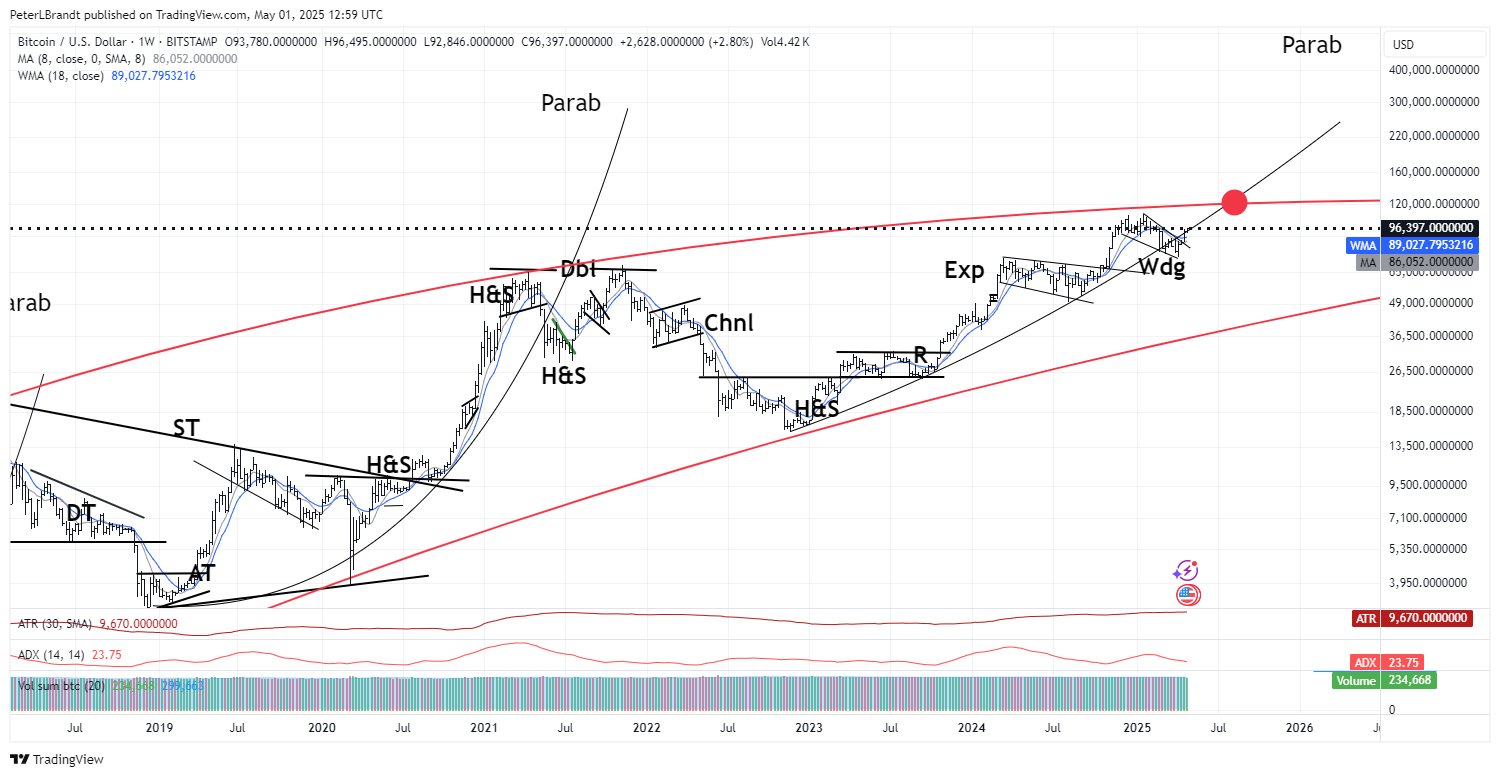
He notes that Failure to do so could mark the end of the current bullish cycle—potentially triggering a typical 50–60% drawdown following prior tops.
Gold’s trajectory, Bitcoin “bull flag” hint at a $150K
Despite growing technical warnings, some analysts remain confident in Bitcoin’s path toward $150,000.
Traders see similarities between Bitcoin’s current market structure and gold’s explosive breakout in the 2000s. They argue that BTC could mimic gold’s historic trajectory, reinforcing the $150,000 scenario.
Analyst Tony Severino cites a potential bull flag structure to predict a BTC price boom toward $150,000.
From an onchain perspective, Bitcoin researcher Axel Adler Jr. believes BTC is approaching a critical “start” rally zone based on historical cycle patterns.
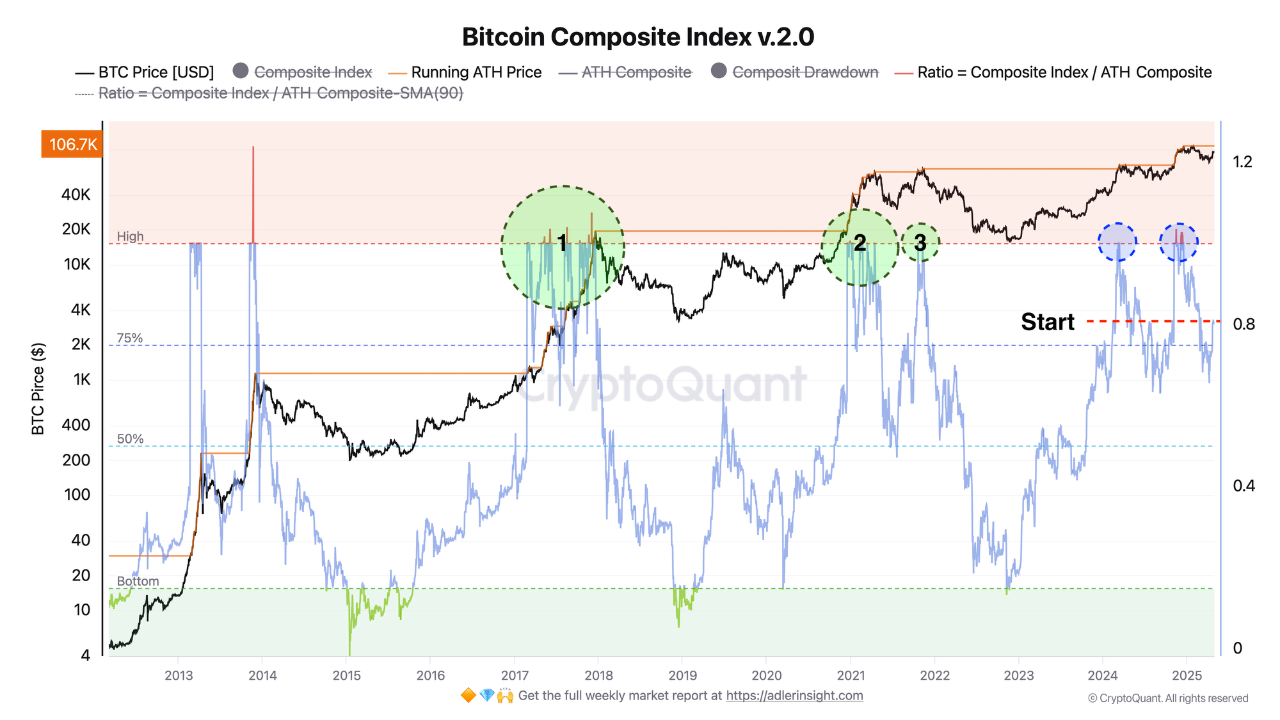
If the NUPL/MVRV ratio breaks and holds above 1.0, it would indicate the start of a new bullish impulse, the analyst notes, saying it could push Bitcoin’s price toward the $150,000–$175,000 range, similar to the rallies seen in 2017 and 2021.
This article does not contain investment advice or recommendations. Every investment and trading move involves risk, and readers should conduct their own research when making a decision.
