


Key takeaways:
-
XRP fractal indicates a 12% to 18% rally in November.
-
On-chain data reveals the highest XRP withdrawal on record, boosting its bullish odds.
XRP (XRP) is on track to end October in the red, slipping more than 7.5% so far this month despite a dramatic 109% rebound from its mid-October lows.
The recovery came amid bullish developments, including Evernorth’s $1 billion XRP treasury purchase and Ripple’s favorable mention of the token in its Hidden Road acquisition announcement.
These fundamentals boost XRP’s potential to continue its rebound in November. But how high can the price go? Let’s examine.
XRP eyes double-digit rally in November
XRP’s latest price recovery appears to mirror a familiar fractal played out in the first half of 2025.
In April and June, the cryptocurrency bounced from its long-term ascending trendline support, a zone that acted as an accumulation area for traders.
The April rebound propelled XRP price toward the 0.5 to 0.618 Fibonacci retracement range drawn from the prevailing cycle’s swing high to swing low. This zone aligned with the $3.20 to $3.40 area.
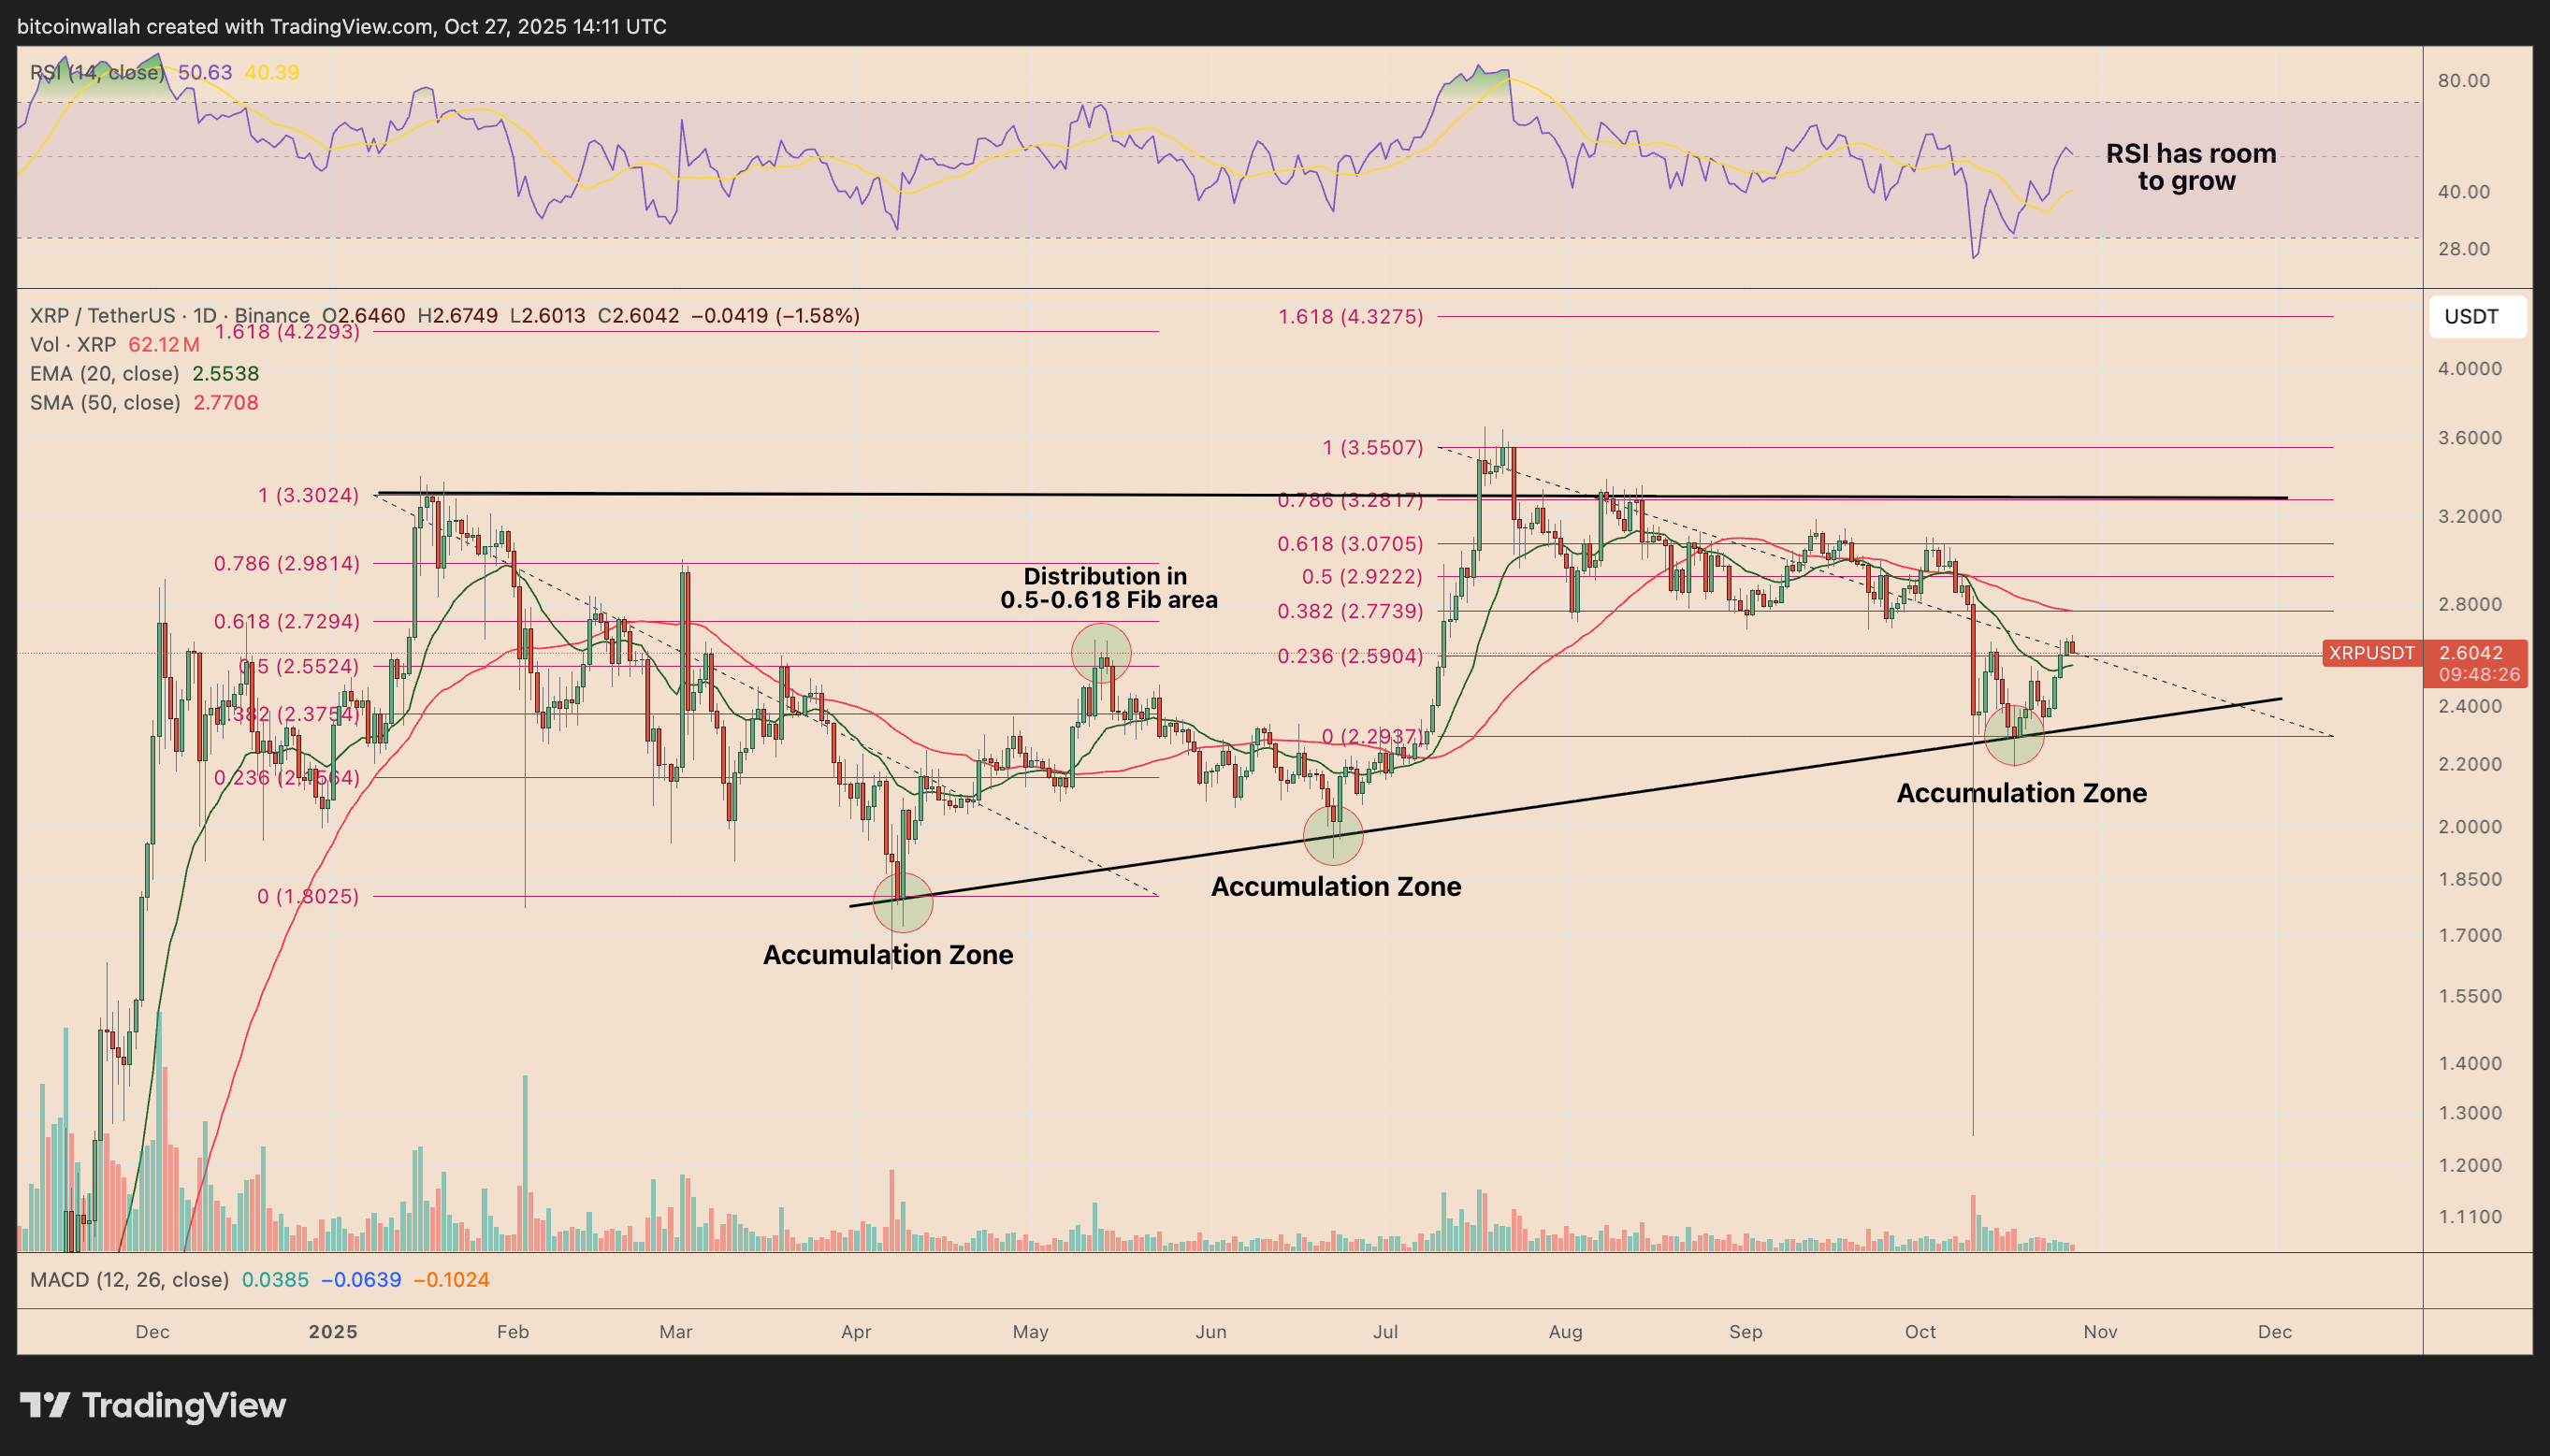
Meanwhile, the June rebound saw the price rally toward the Fibonacci cycle’s swing high near $3.30 afterward, and even surpassing it to establish a multiyear high at around $3.66.
This fractal may repeat in November, with a neutral relative strength index (RSI) hinting at an initial move toward $2.77, a level aligning with the 0.382 Fibonacci retracement and the 20-day exponential moving average (red wave).
A close above $2.77 could fuel an April-like bullish momentum, targeting the 0.5–0.618 Fib zone at $2.75 to $3.00 in November, amounting to a potential 12% to 18% rally.
Related: XRP price targets $3 as whale wallet count hits new all-time highs
XRP witnesses record exchange outflows
On Oct. 19 and 20, XRP’s exchange net position change fell by 2.78 million, its deepest negative levels on record, according to Glassnode data.
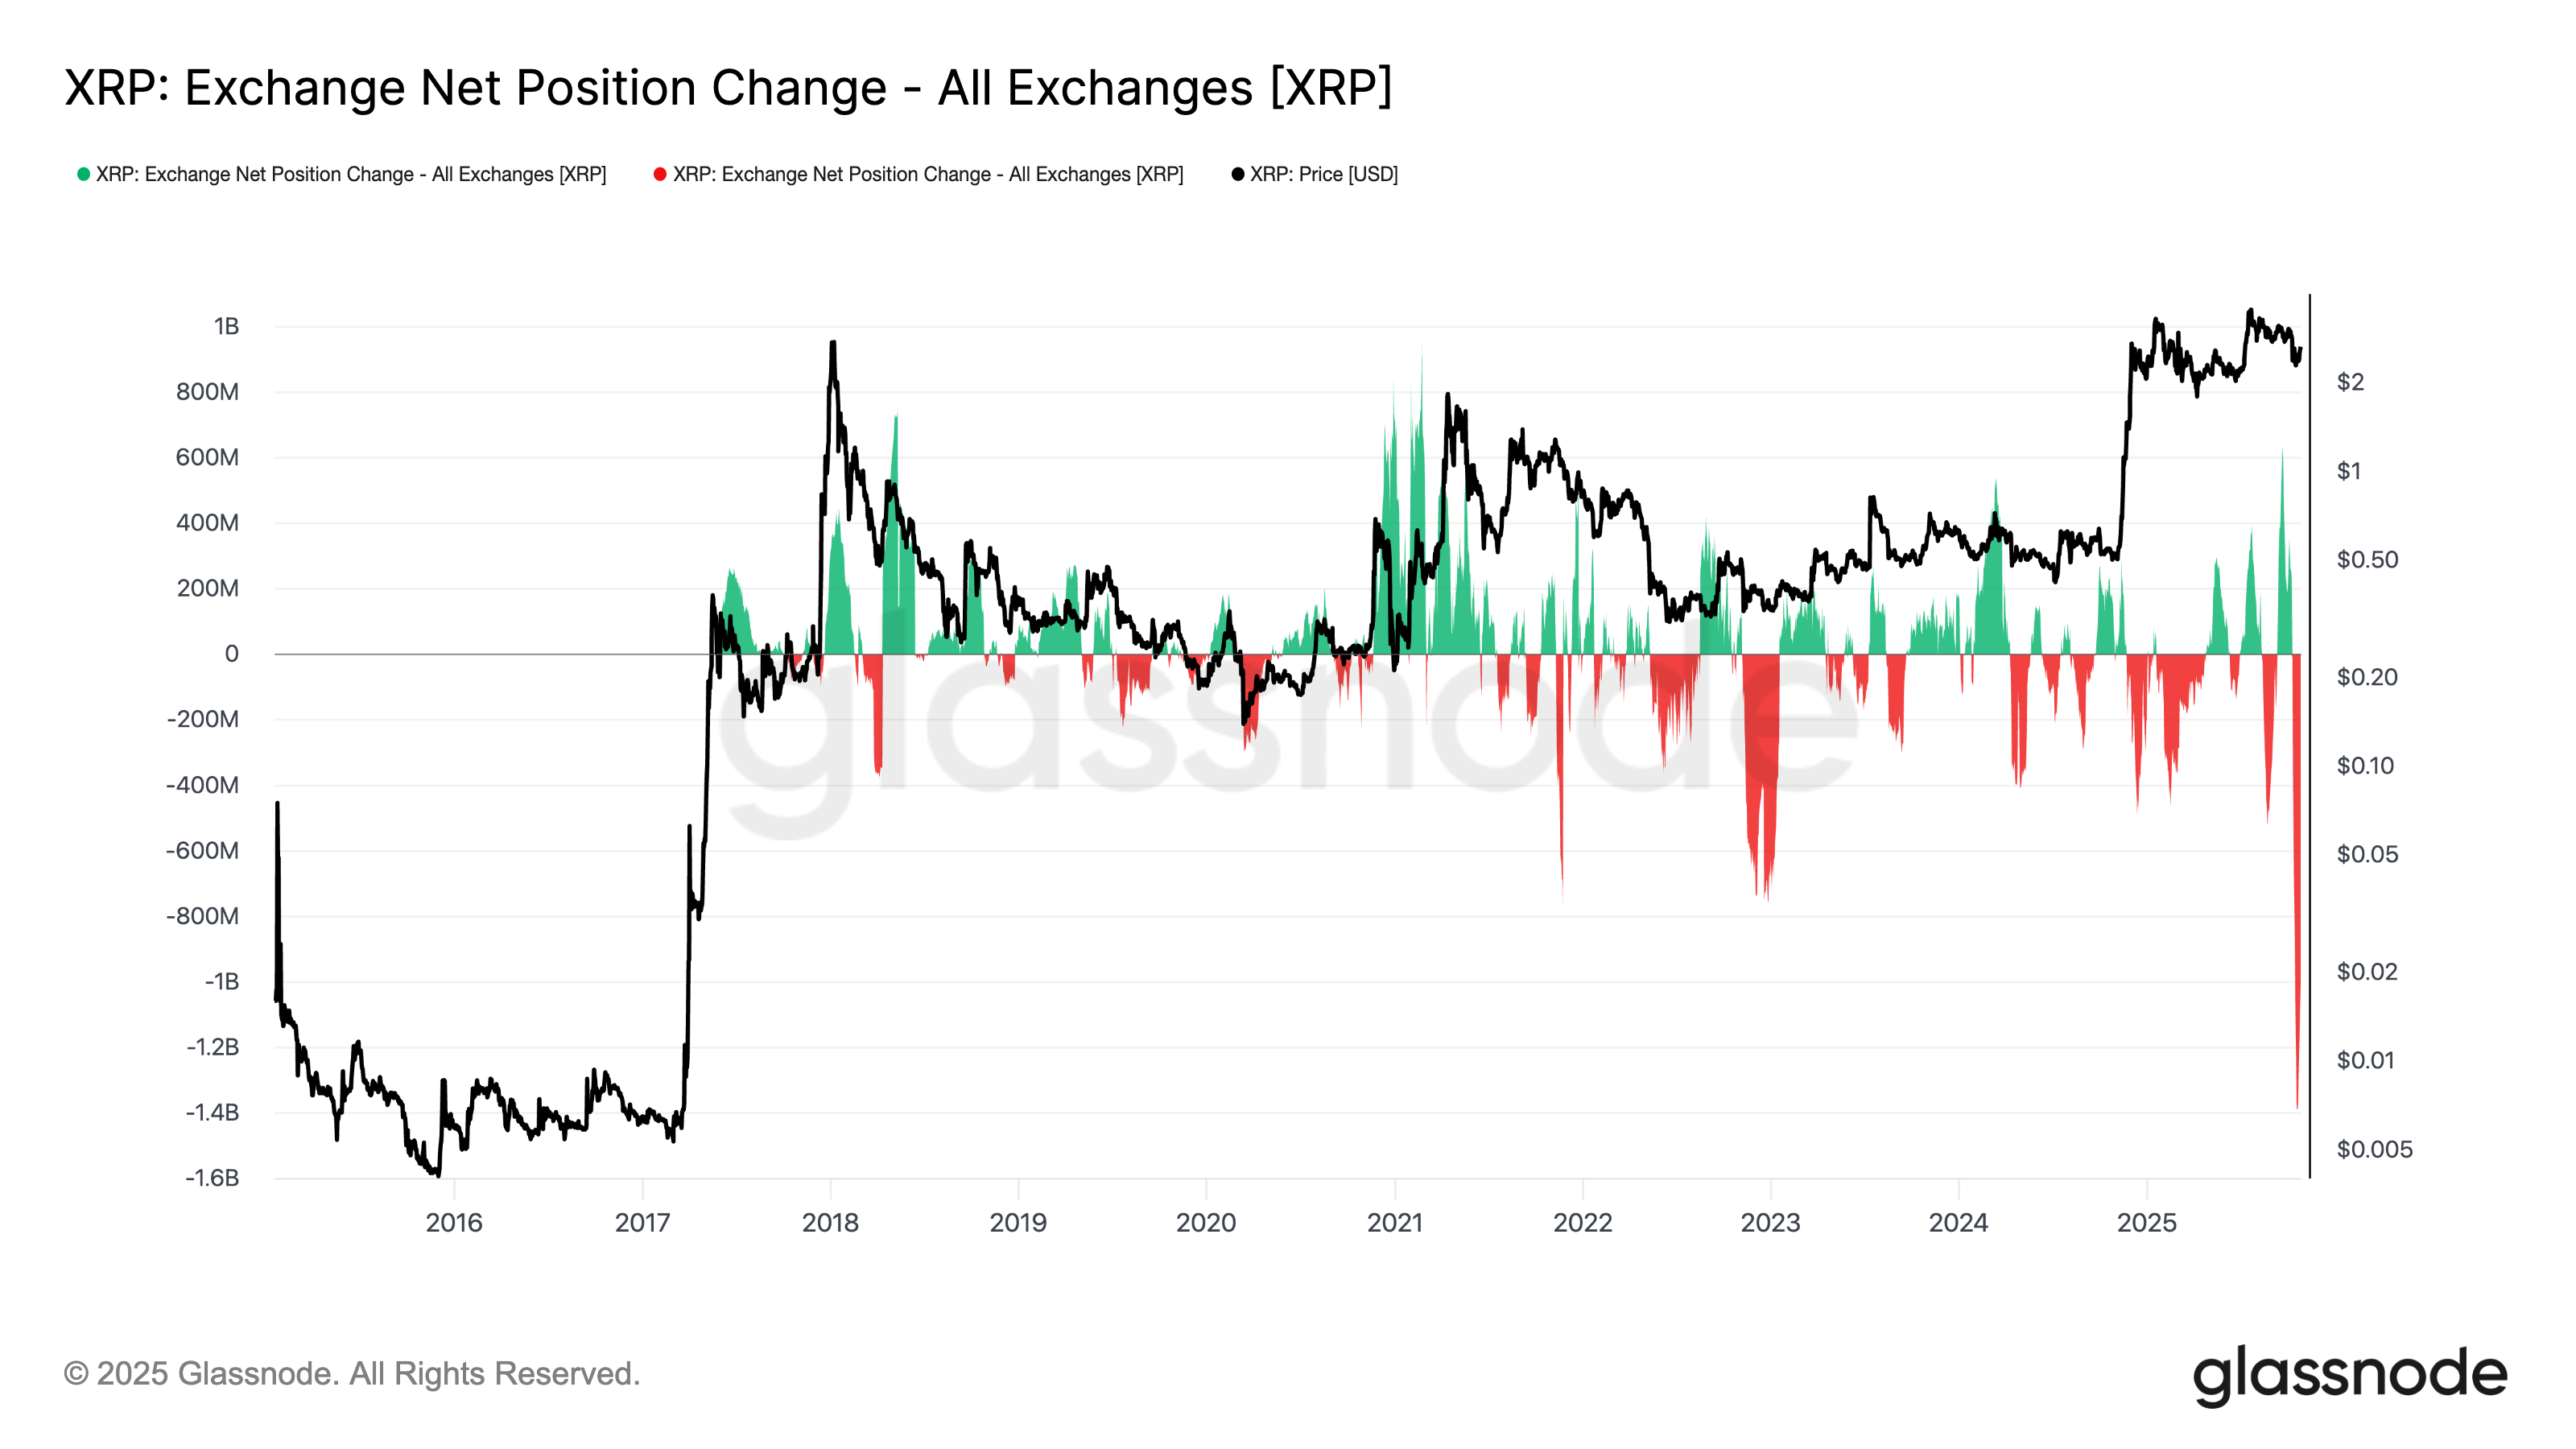
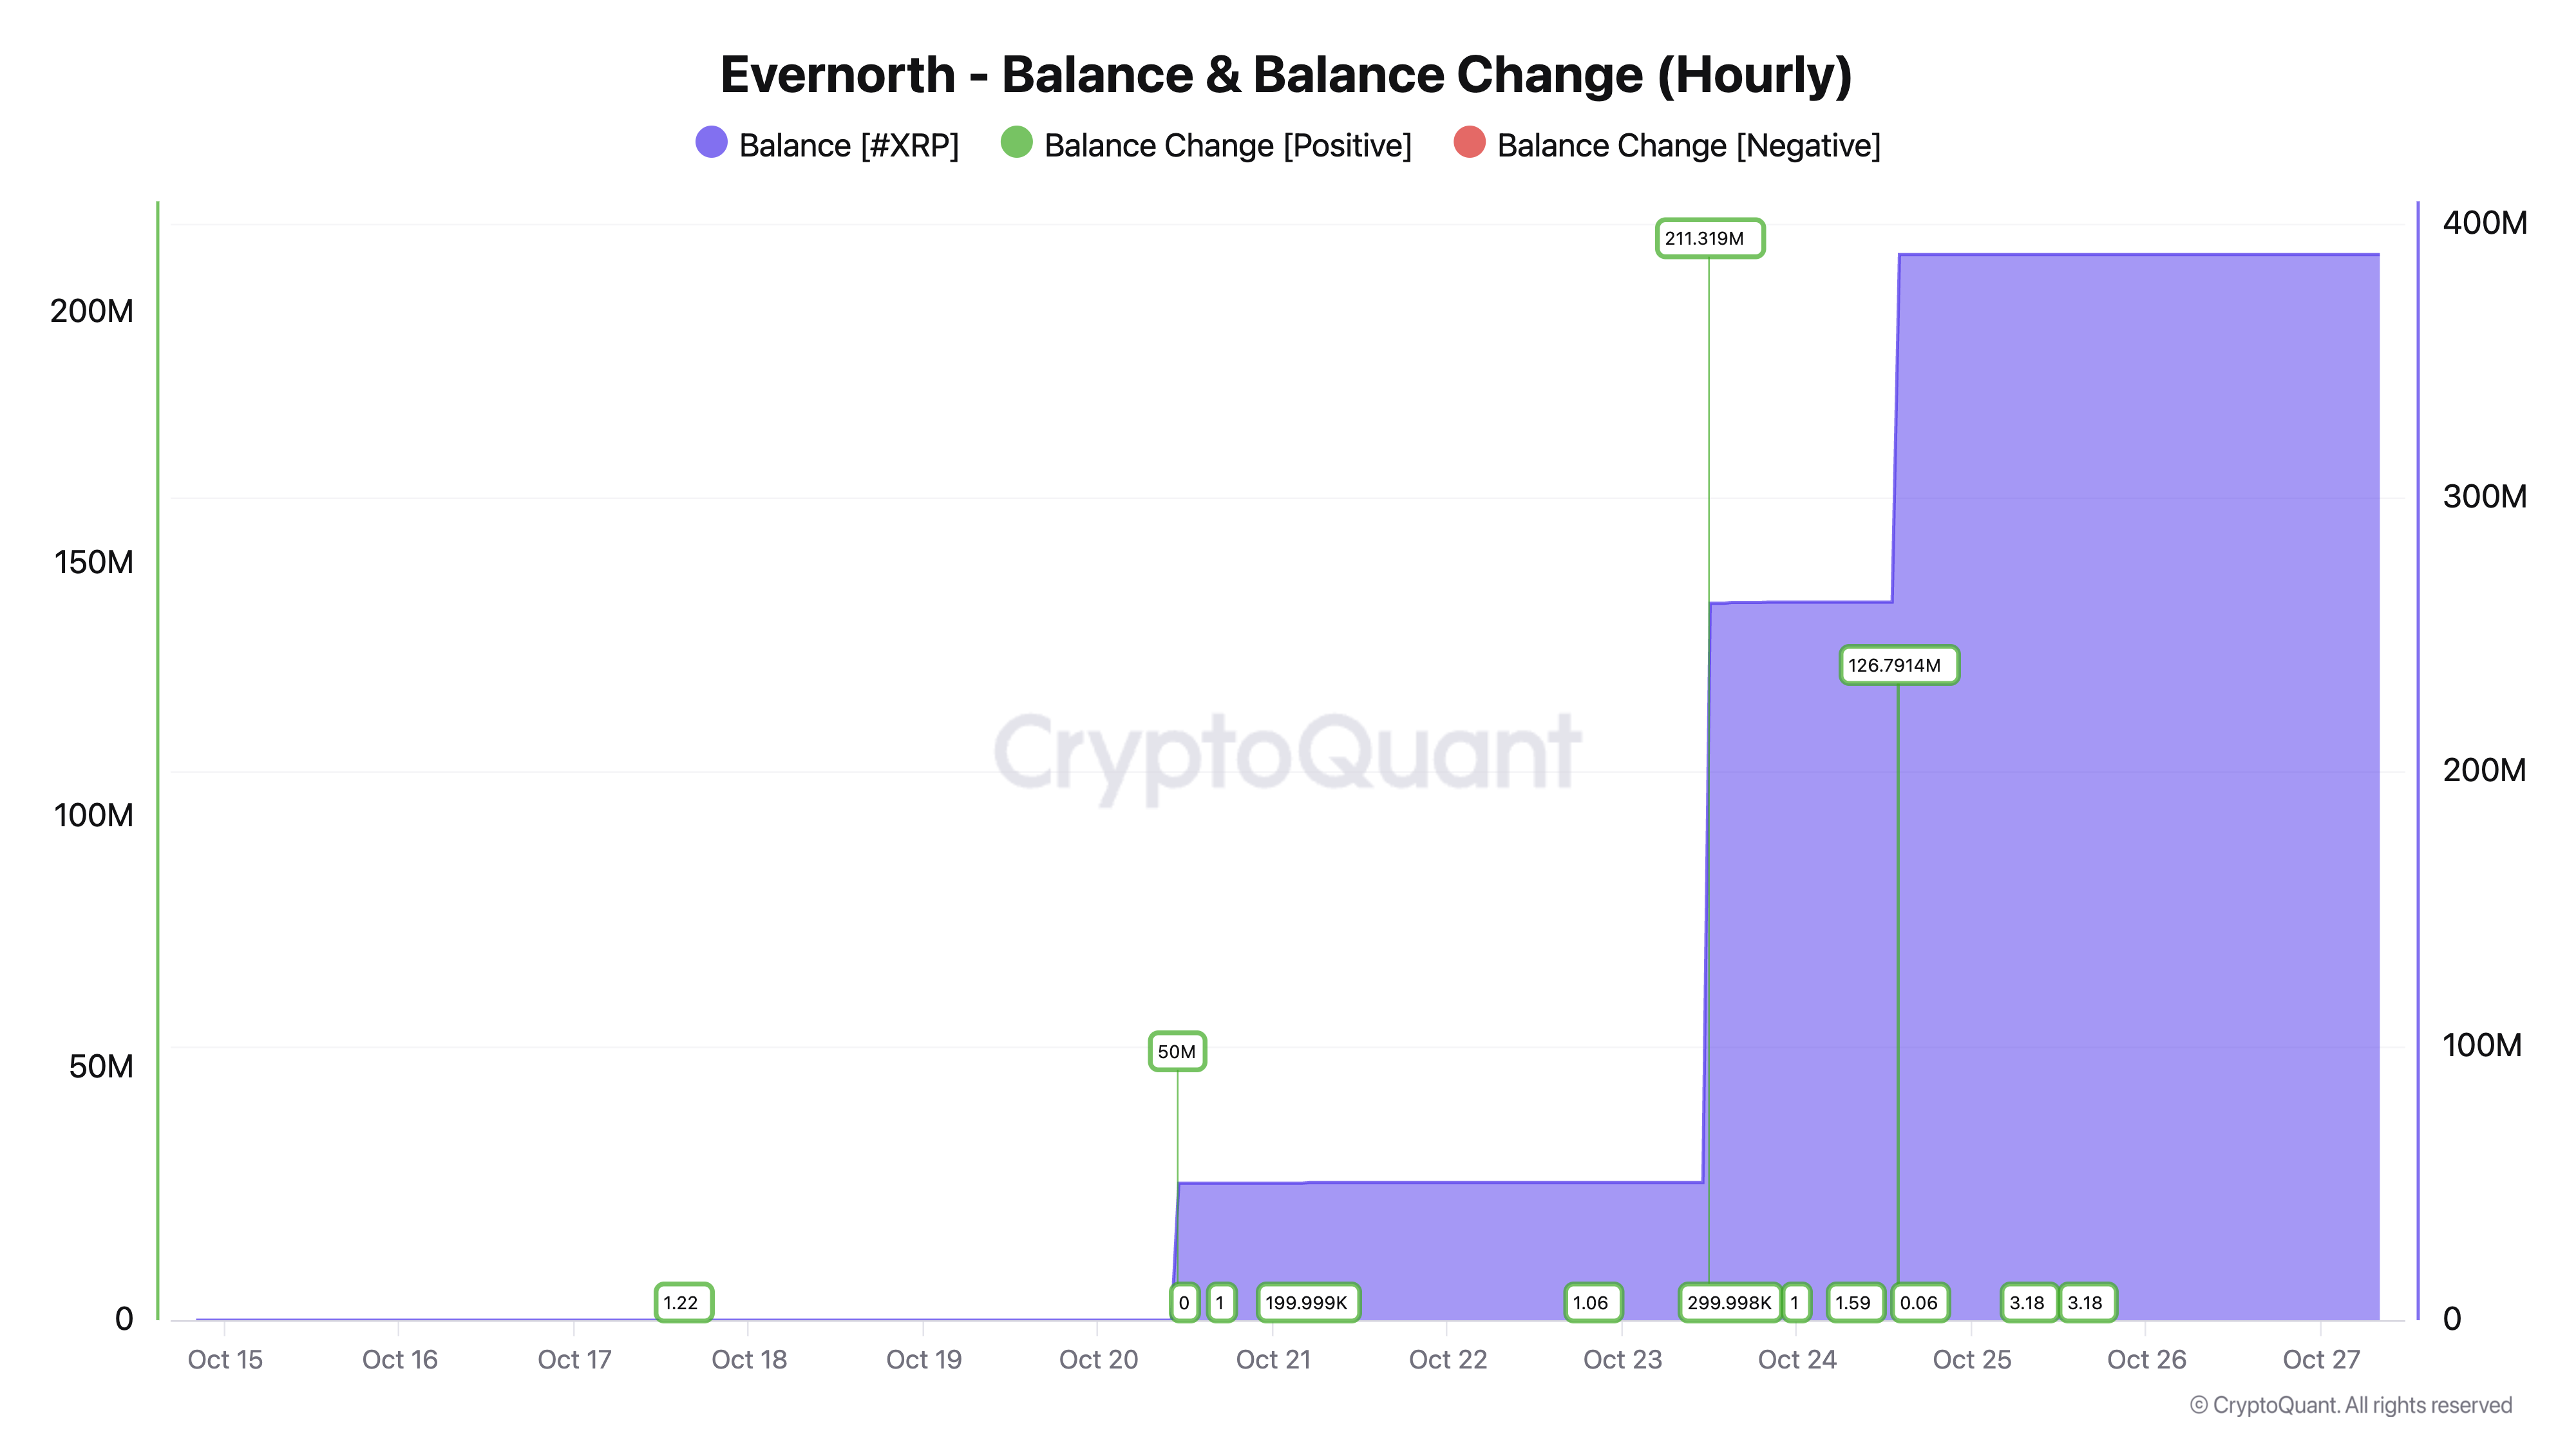
The sharp decline coincided precisely with Evernorth’s announcement of its $1 billion XRP treasury purchase.
As of Monday, the Ripple-associated company had accumulated over 388.71 million XRP worth about $1.02 billion, according to CryptoQuant data.
Such outflows typically indicate strong accumulation by large holders moving tokens to cold storage, reducing immediate sell-side pressure.
Related: XRP price targets $3 as whale wallet count hits new all-time highs
It reinforces the possibility that XRP’s rebound could extend toward the 0.5–0.618 Fibonacci range near $2.70 to $3.00.
XRP short liquidations can lead to a breakout above $2.68
XRP’s largest near-term liquidity cluster sits around $2.68, where roughly $15.91 million in leveraged positions are at risk, according to CoinGlass data.
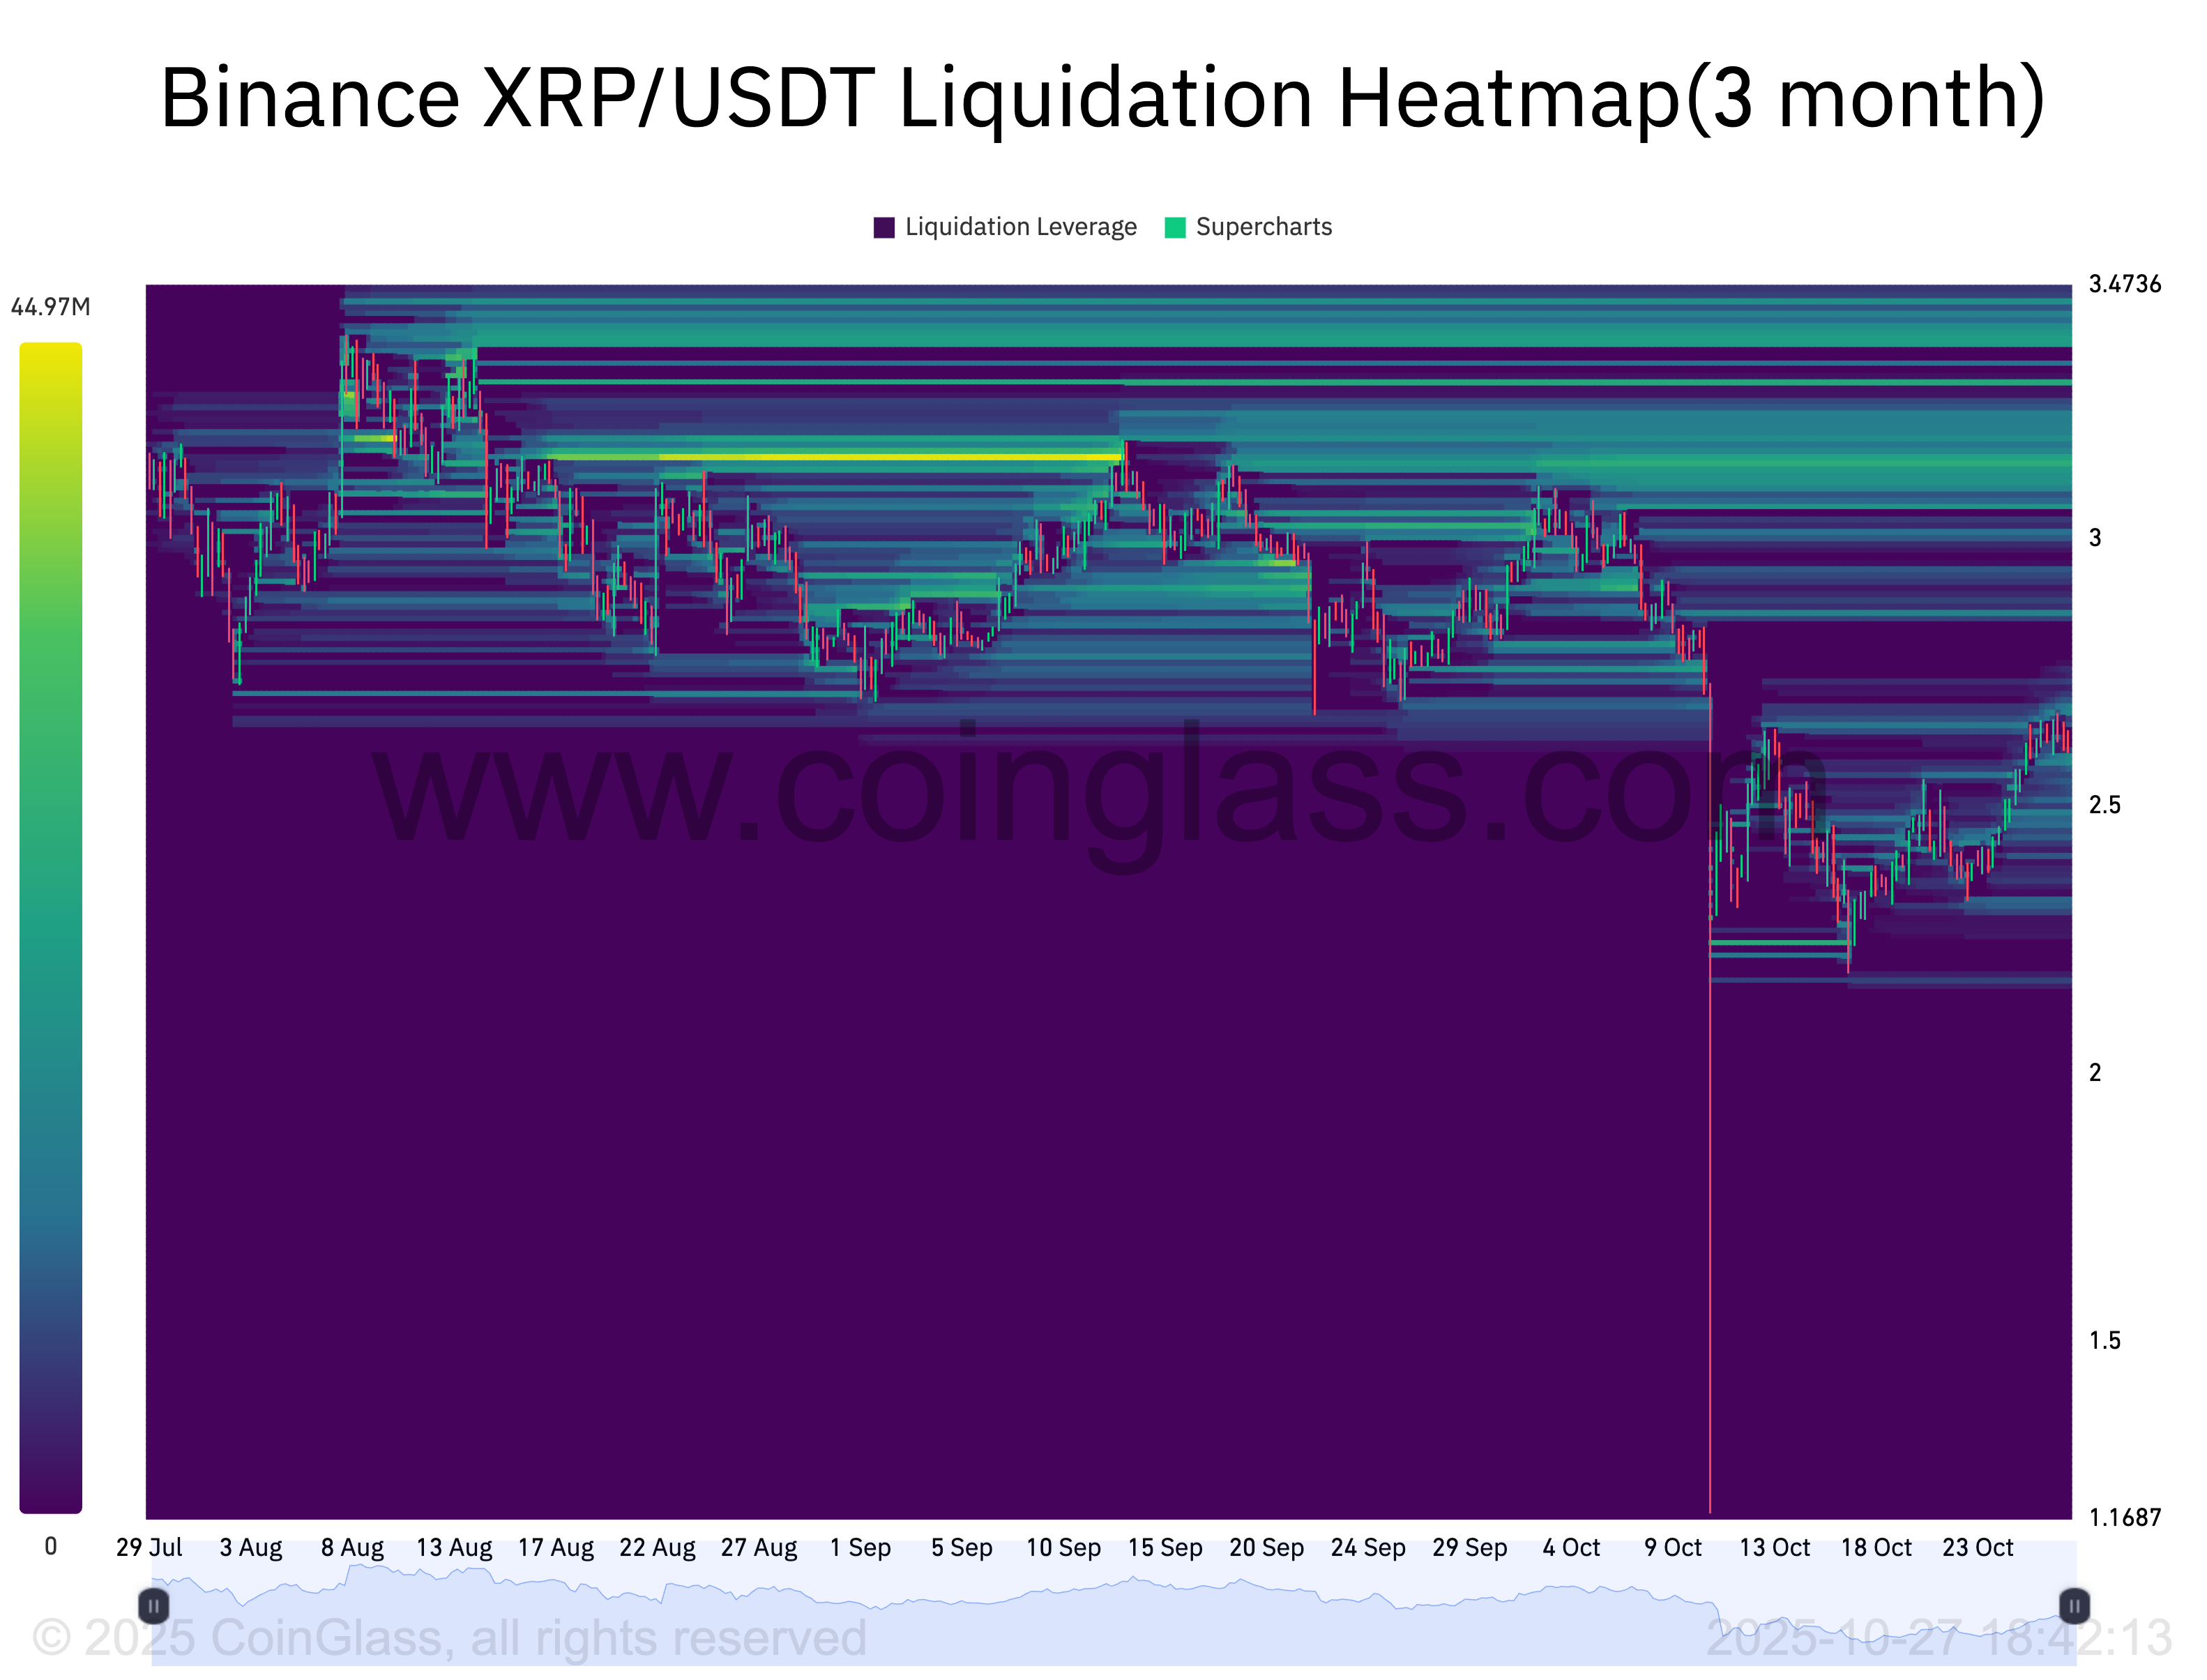
This zone represents about $39.1 million in potential short liquidations, marking it as a key magnet level for price movement. It could further lead to short squeezes, pushing the token higher toward the technical targets between $2.75 and $3.00.
This article does not contain investment advice or recommendations. Every investment and trading move involves risk, and readers should conduct their own research when making a decision.
