


Key takeaways:
-
BNB faces short-term correction risks but maintains a strong bullish structure above the trendline.
-
Breakout patterns and onchain optimism point to upside targets of $1,250–$1,565 by year-end.
BNB (BNB) has jumped over 10% this weekend, outpacing a largely stagnant crypto market that remained flat.
With momentum diverging from its peers and in price discovery, the question is, can the Binance-linked token push even higher?
BNB faces “overbought” risks in September
BNB’s latest rally has pushed the relative strength index (RSI) on the four-hour chart into overbought territory, raising the risk of a short-term pullback. The token has slipped 2.89% from its record $1,083.50 established earlier today.
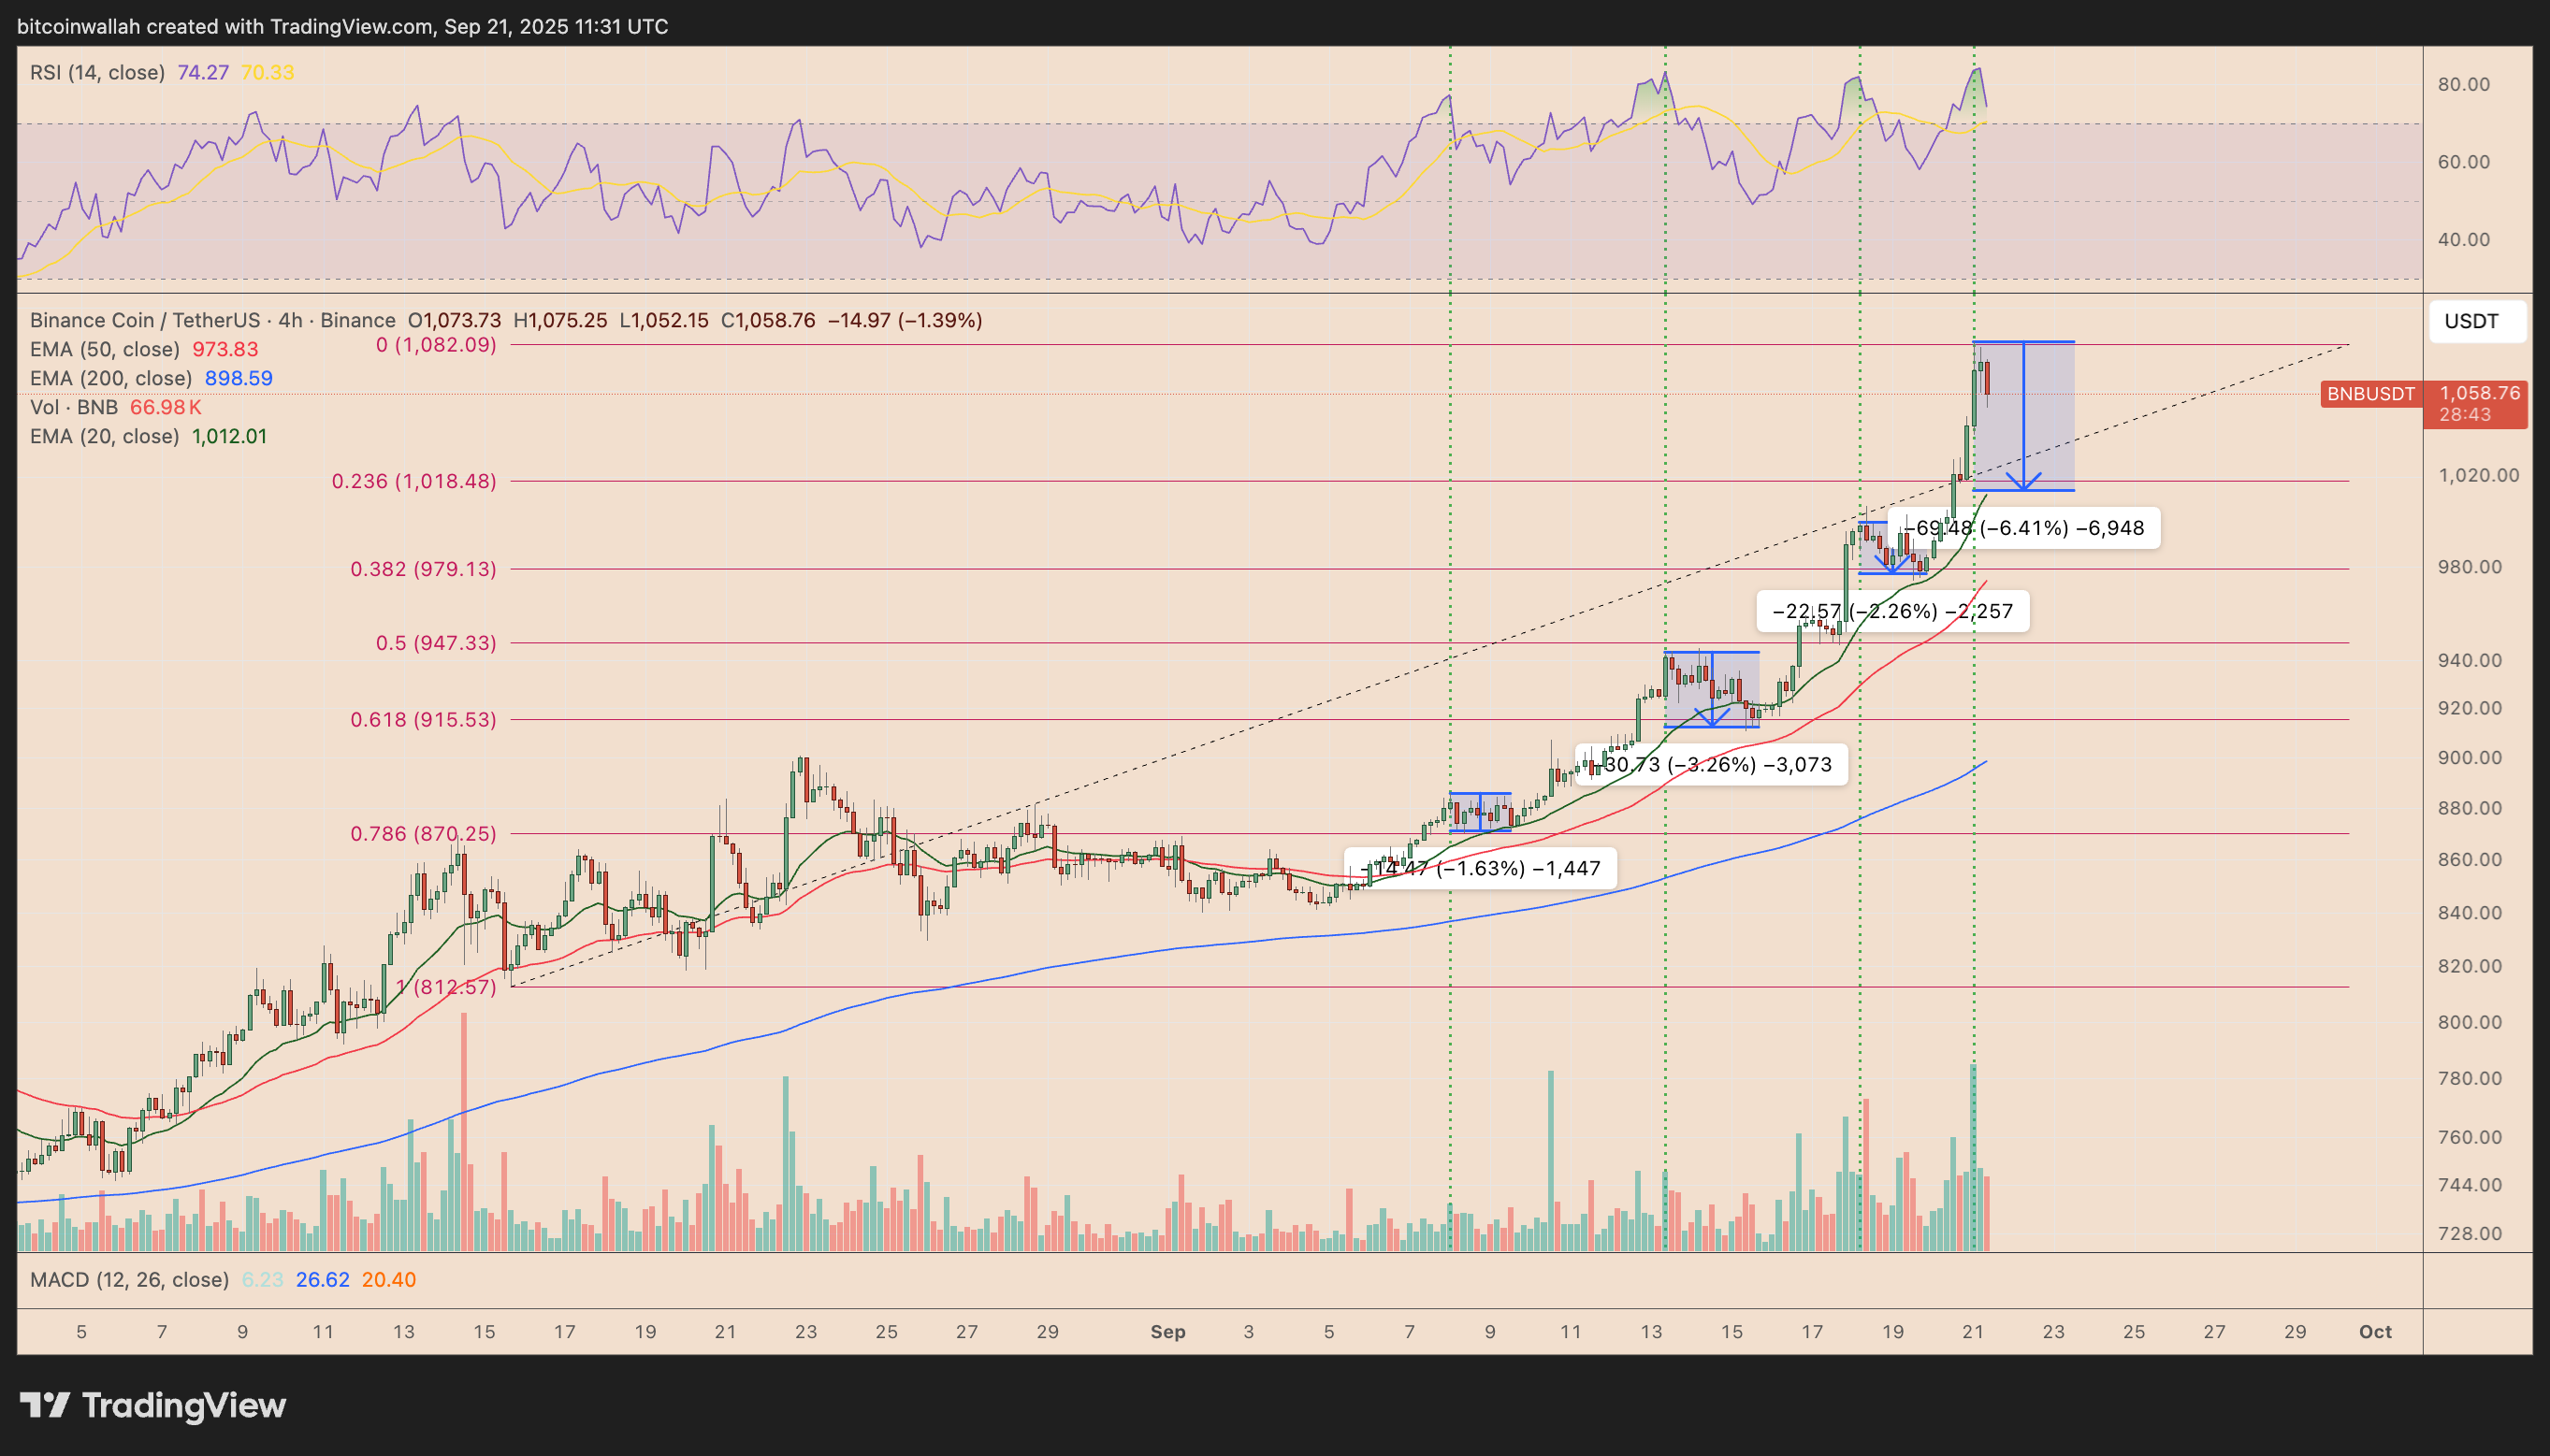
A correction toward the 20-4H exponential moving average (20-4H EMA; the green wave) near $1,012 looks increasingly likely in the coming days, if the recent overbought declines are any indication. This short-term target further aligns with the 0.236 Fib retracement.
BNB’s decline could extend toward the 50-4H EMA around $974, a level that has provided reliable trend support, if selling pressure deepens into next week.
BNB price may reach $1,150 in October
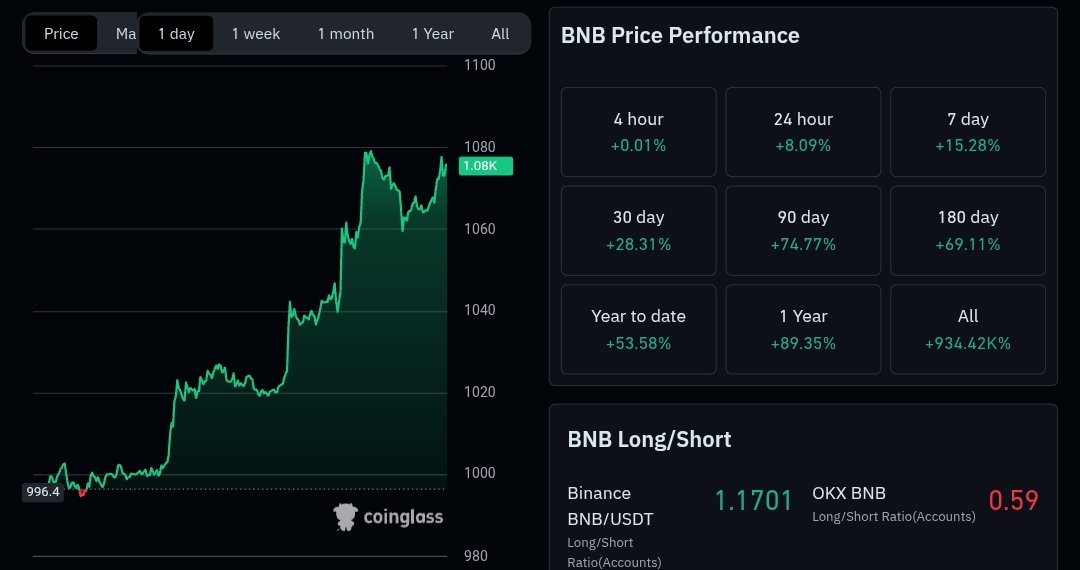
For analyst Gael Gallot, BNB holding above $970 support is a sign of healthy consolidation, citing persistently rising trading volume and long overweight positions in the derivatives market.
He said in his Sunday post:
“BNB broke the 1000 mark and set a new high at 1074 before settling near support at 987 to 990. Trading volume hit 3.28 billion during the move, and momentum remains strong with a long short ratio of 17.71, showing bullish positioning.”
The $970 price floor also serves as the lower trendline of BNB’s broader ascending channel pattern, as shown below.
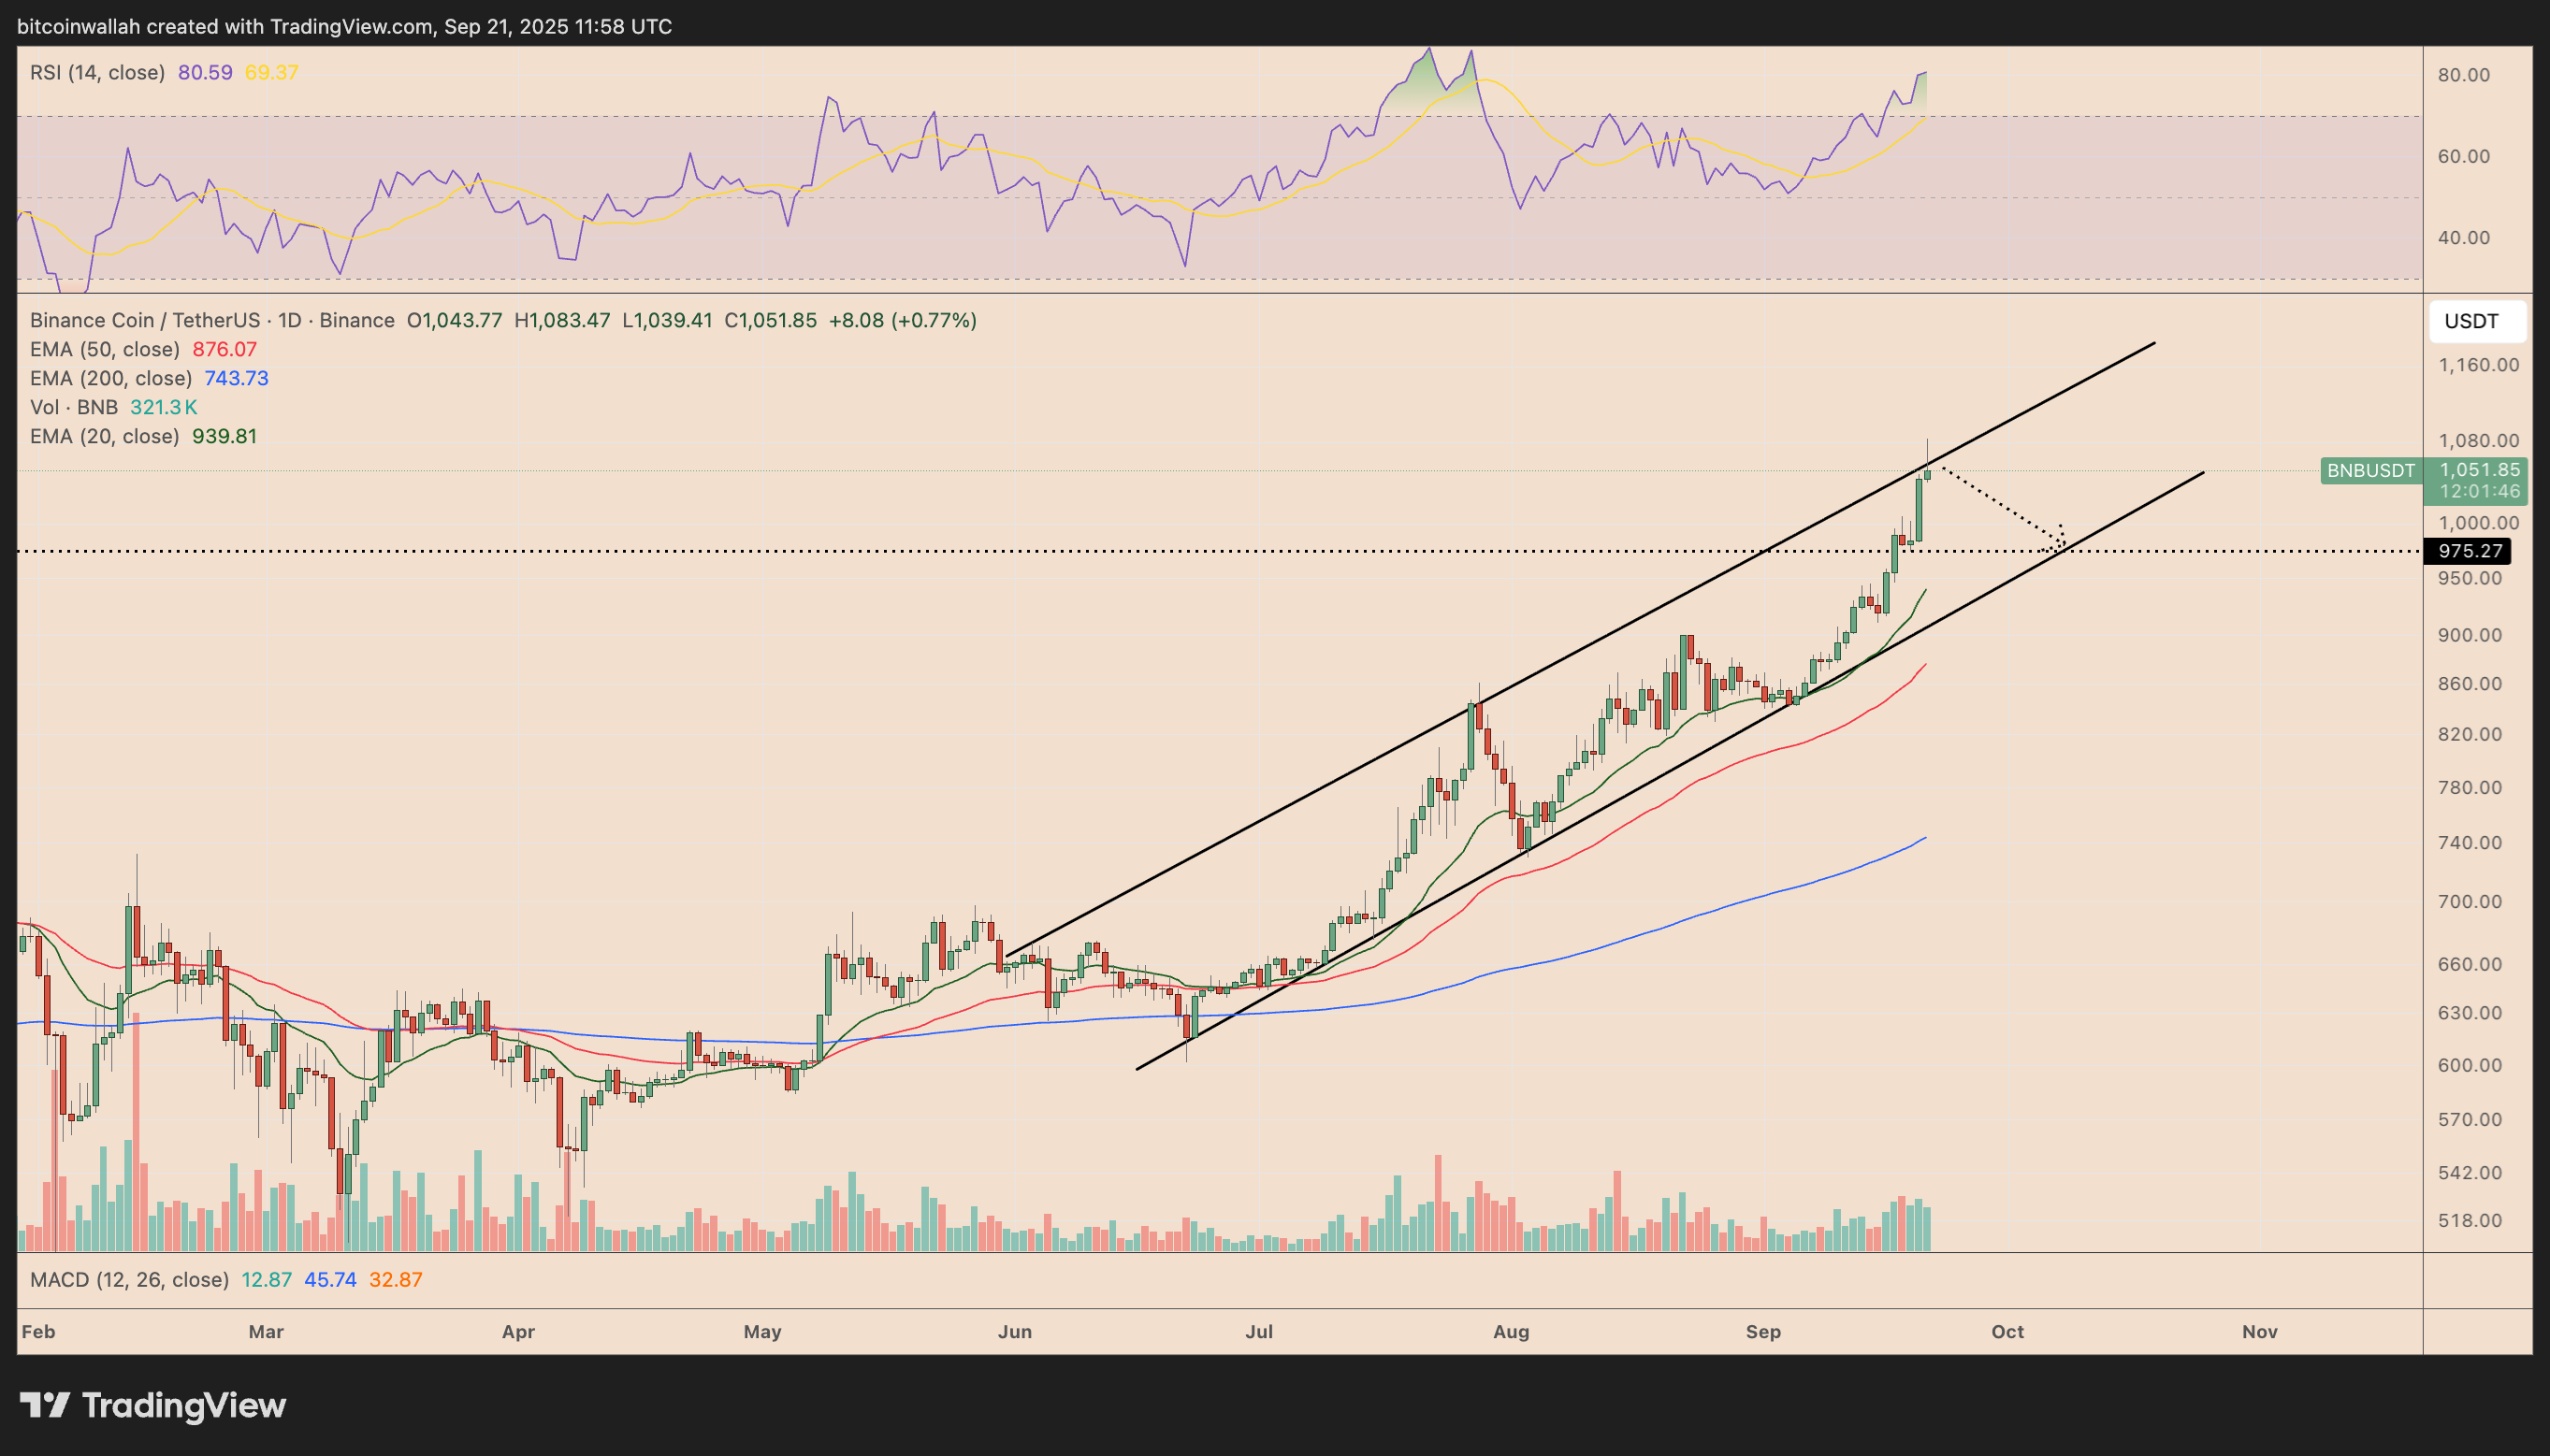
Since June, each retest of the lower trendline has historically triggered 20–35% rebounds toward the channel’s top.
A repeat of this fractal pattern will see BNB break above $1,150 in October, up 10% from current levels, even if prices first retrace toward $970 in the coming days.
BNB’s year-end target is $1,250 or higher
Looking further, BNB is setting up for a potential year-end rally, fueled by its breakout from a long-term cup-and-handle formation.
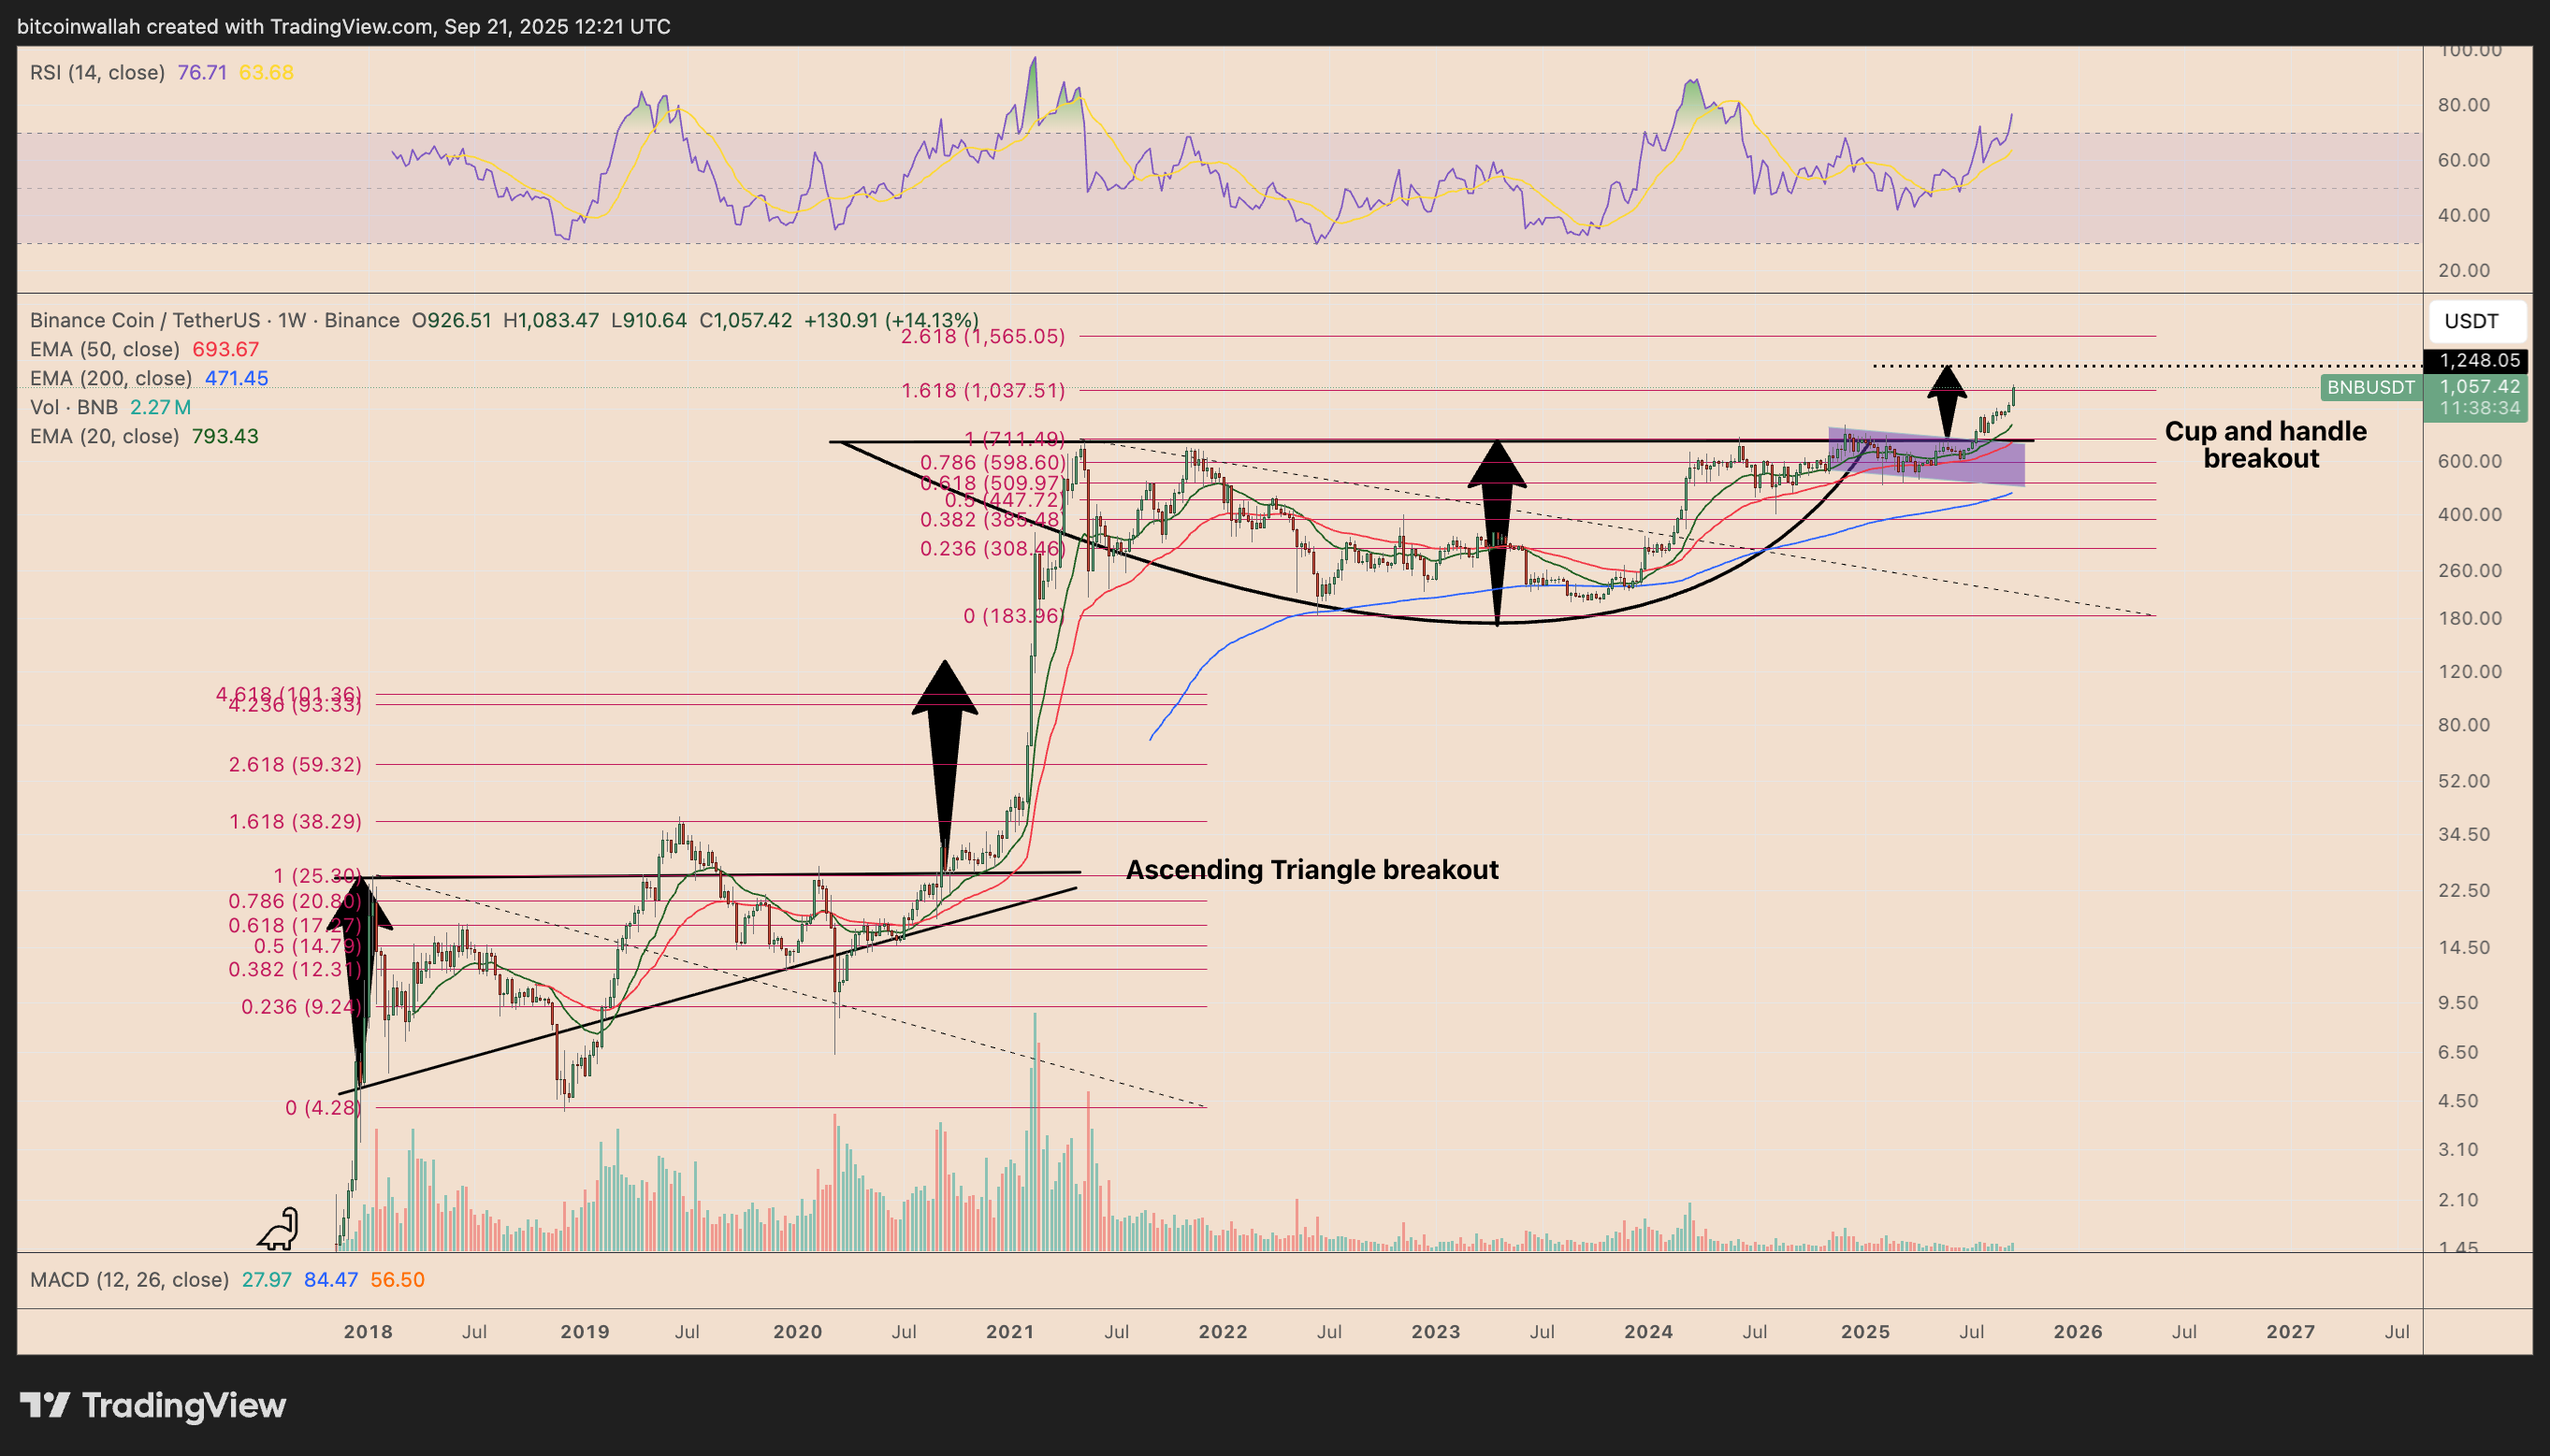
The price has cleared the 1.618 Fibonacci extension near $1,037, flipping it into support. Its upside targets emerge at $1,250, measured from the cup-and-handle breakout, and the 2.618 Fib line around $1,565, if momentum holds.
This setup mirrors BNB’s 2,650% rally following its ascending triangle breakout in 2020–2021.
Related: ‘Diamond hand’ investor turns $1K into $1M as BNB tops $1,000
BNB onchain data leans bullish
BNB’s Net Unrealized Profit/Loss (NUPL) metric has returned to the optimism–anxiety zone, a level last seen during the 2020–2021 bull rally that preceded a run from under $50 to over $600.
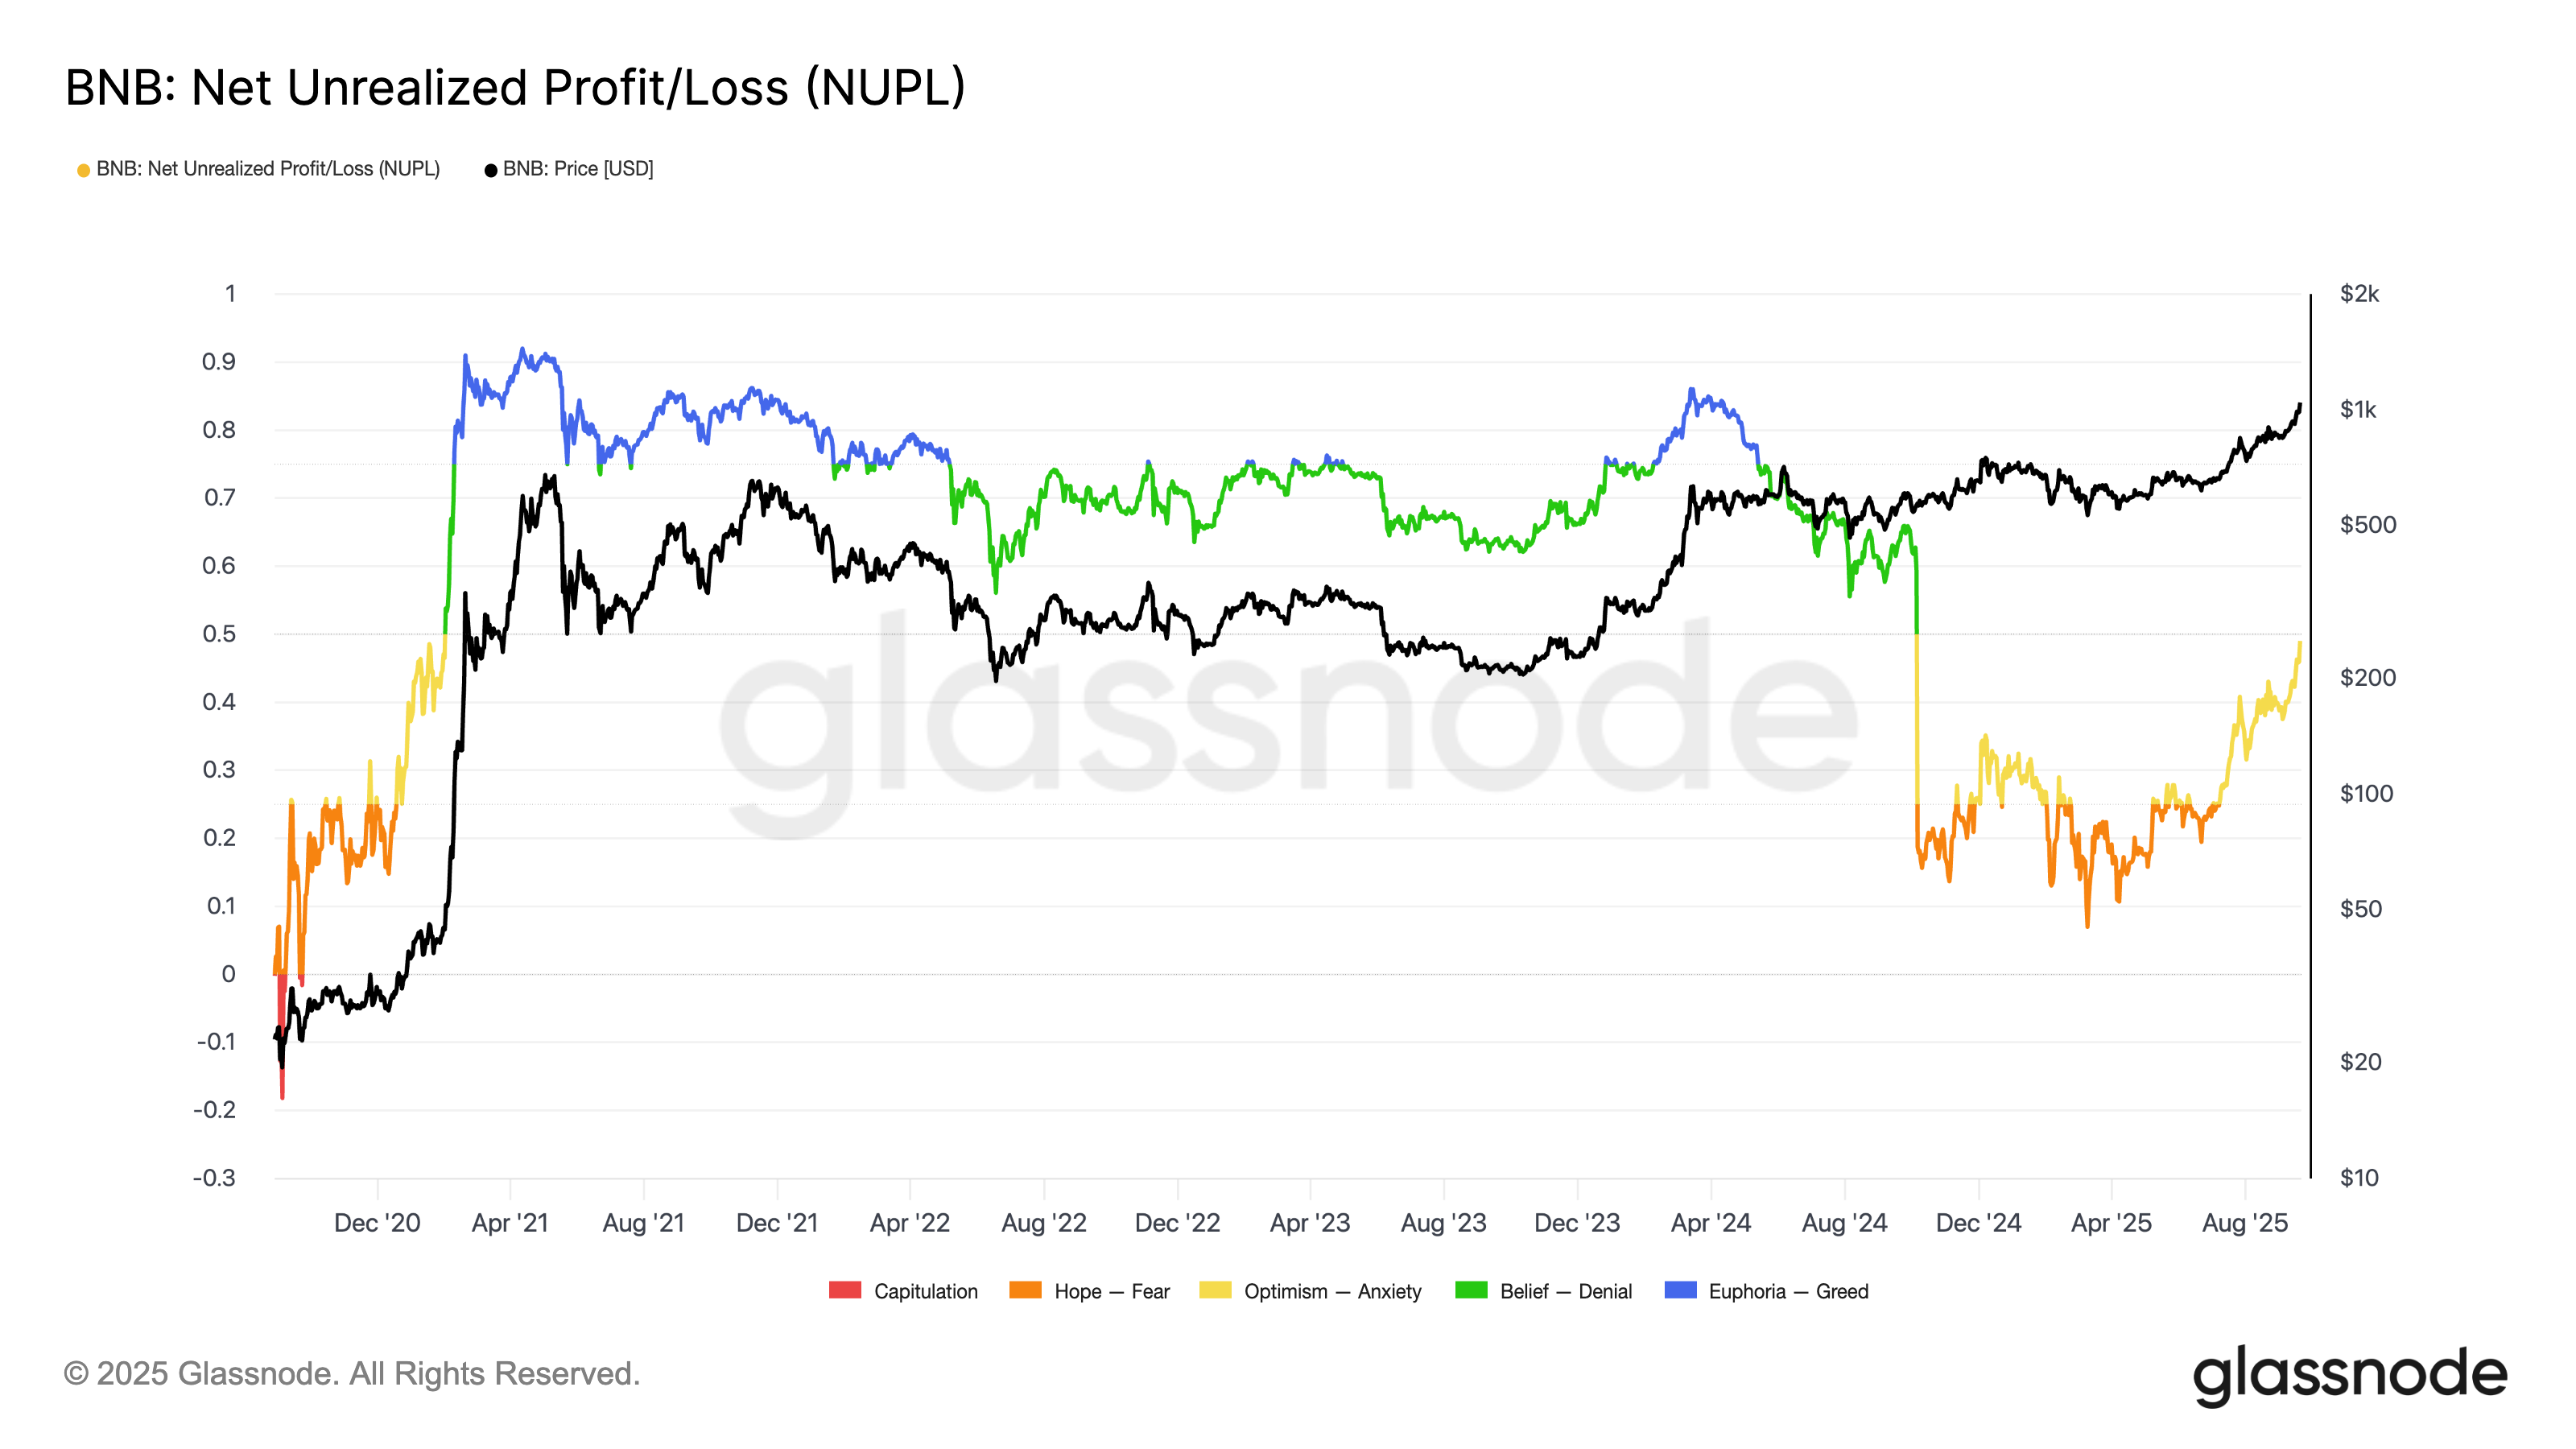
The current sentiment suggests holders are leaning optimistic, often a sign of mid-cycle strength. With both BNB technicals and fundamentals looking strong, BNB may enter its most bullish phase of the cycle, even if short-term corrections occur.
This article does not contain investment advice or recommendations. Every investment and trading move involves risk, and readers should conduct their own research when making a decision.
