


Ether (ETH) has made modest gains over the last 24 hours, briefly reclaiming the $3,000 psychological level. However, decreased ETH demand, evidenced by heavy outflows from spot Ethereum exchange-traded funds (ETFs), and a weakening technical structure could see Ether drop to levels below $2,000 over the coming weeks.
Key takeaways:
-
Decreasing Ethereum demand and negative spot Ether ETF flows signal aggressive distribution.
-
Ether’s bear flag pattern targets $1,850 ETH price if key support is lost.
Ether’s apparent demand drops to 10-month lows
One Ethereum demand metric has dropped sharply since mid-December to levels last seen in March 2025.
Capriole Investment’s Ethereum Apparent Demand for Ether dropped significantly to -3,562 ETH on Jan. 16 from over 92,000 ETH on Dec. 13. This metric had improved slightly to 665 ETH at the time of writing on Thursday.
Related: ETH funding rate turns negative, but will Ether bulls take the bait?
Decreasing ETH demand amid price drawdown signals aggressive distribution as the price tests key support levels, particularly the $3,000 psychological level this week.
Note that the last time demand was this low was in March 2025, when the price was hovering around $2,200. This was followed by a 25% ETH price drop to $1,750 a few days later.
ETH price must hold $2,800
As Cointelegraph reported, Ether’s key support remains the $2,800-$3,000 demand zone. This is where investors acquired about 9 million ETH over the last six months, creating a potential support zone, according to Ether’s cost basis distribution data.
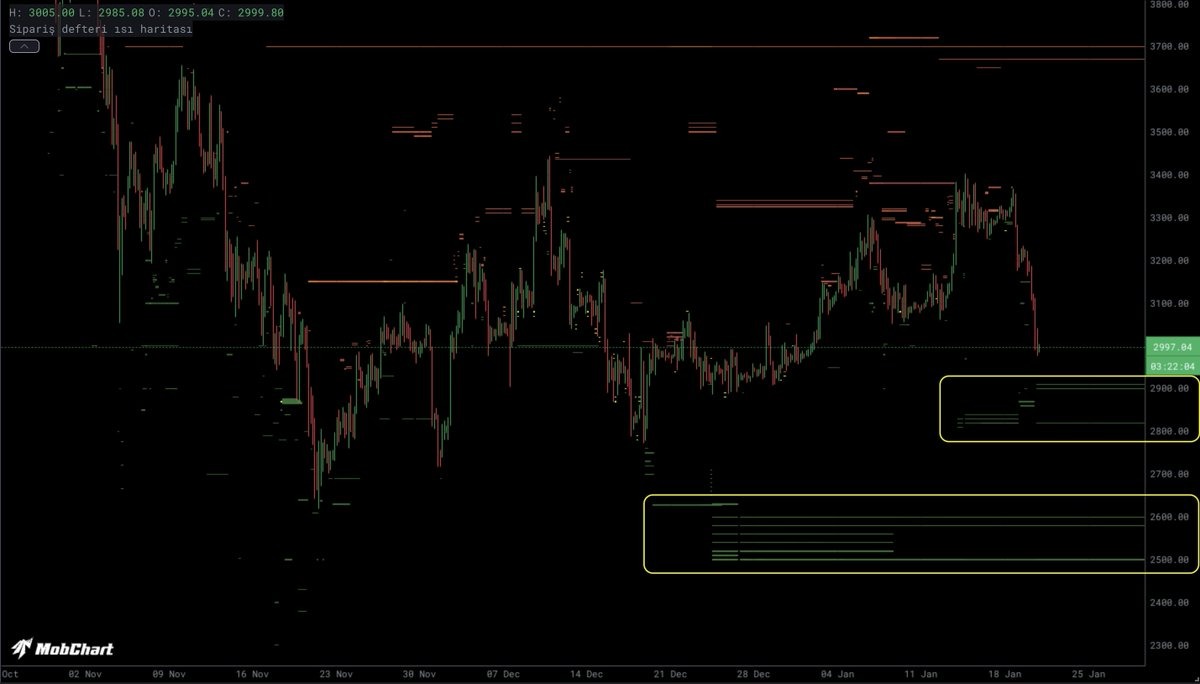
Looking at the order book heatmap, pseudonymous analyst Kriptoholder found heavy buying by whales around the same level.
The “support block in the $2,800 – $2,850 range and the dense buy walls within the $2,500 – $2,600 band clarify where demand is clustered,” Kriptoholder said in a Wednesday post on X, adding:
“This structure indicates exactly where institutional buyers are positioned to absorb pullbacks and target accumulation.”
This level coincides with the 50-week moving average and the lower boundary of a bear flag, as shown in the chart below.
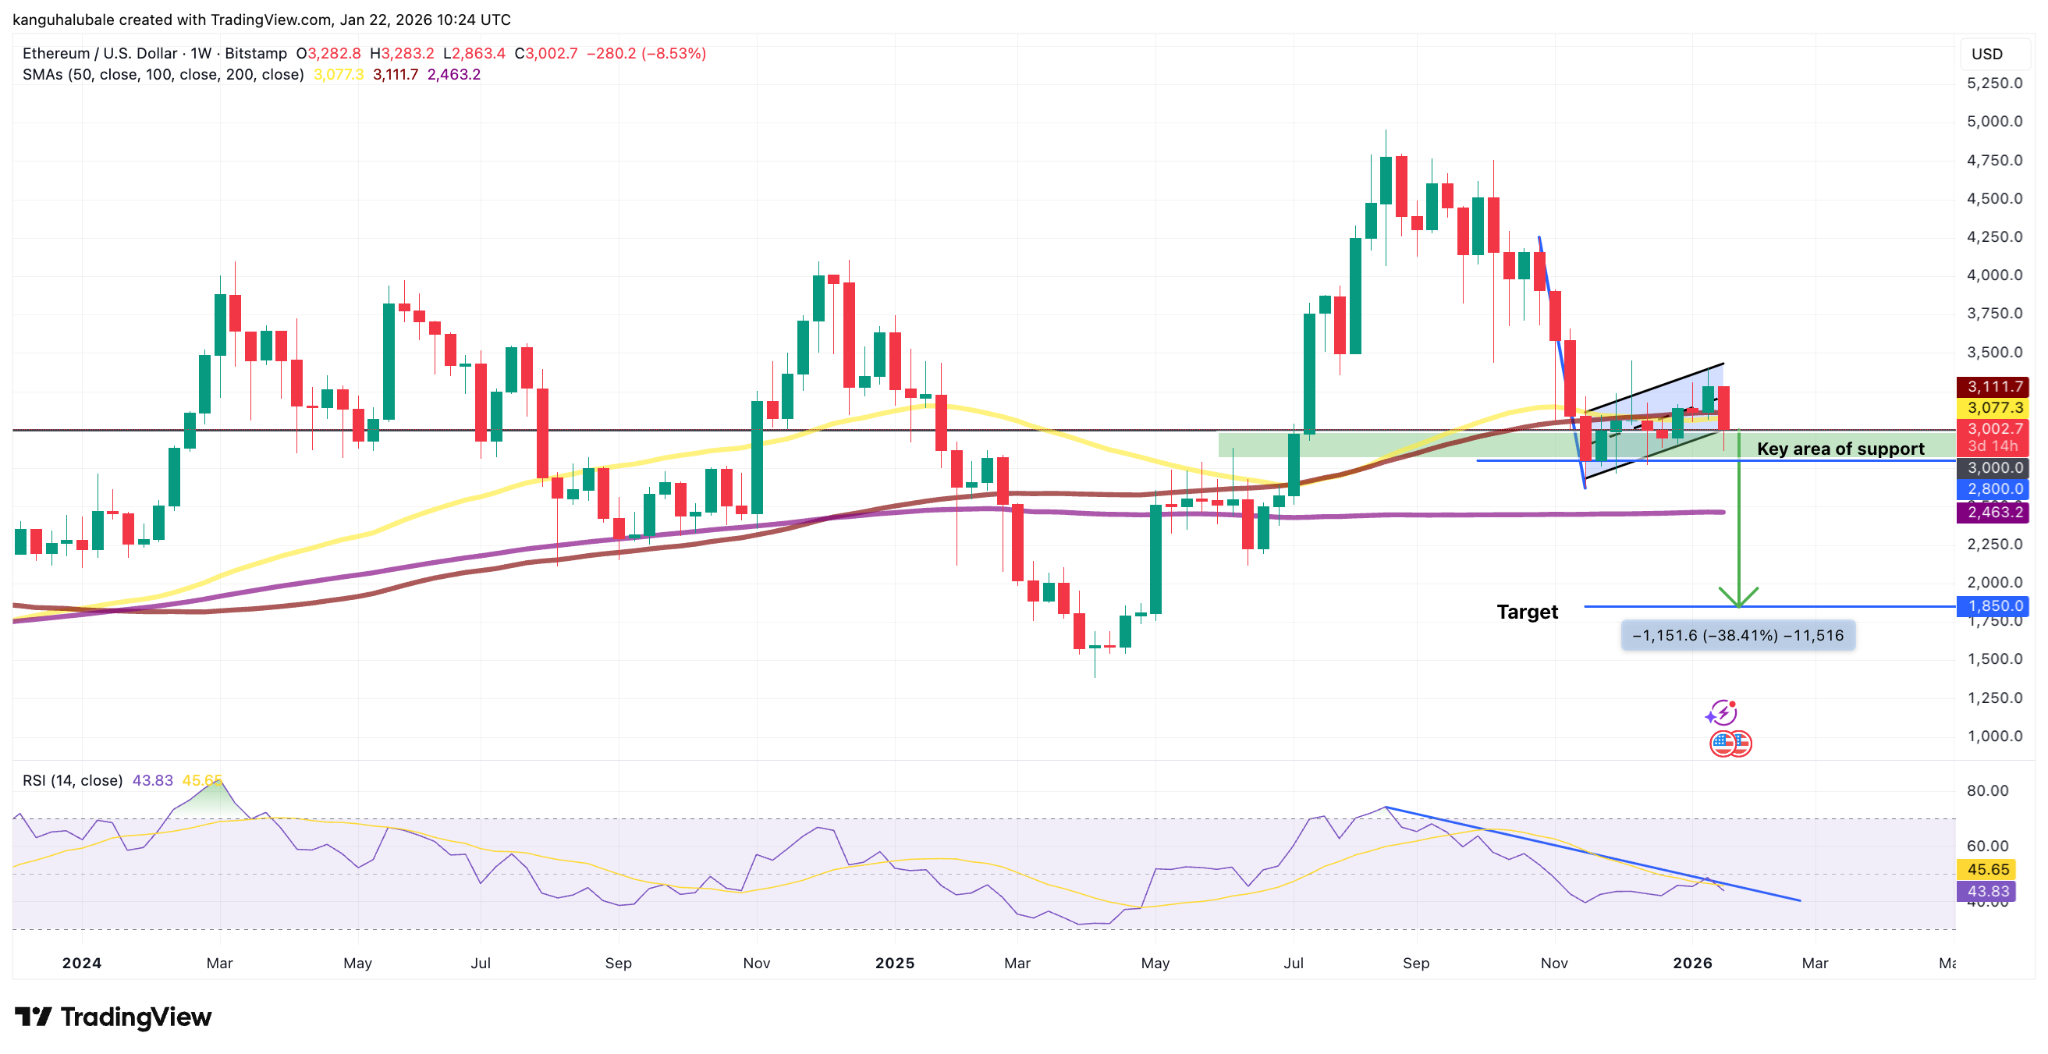
ETH price is “currently nearing its last line of defense, the support level that has held price for the past 3 months,” said crypto investor Batman in his latest post on X, referring to the $2,800-$3,000 demand zone.
“If there’s an area for Ethereum to rebound, this is it. If not, it’s going to look bad.”
Below that, the 200-day MA at $2,460 and the $2,000 psychological level are the key areas to watch on the downside.
The measured target of the bear flag is $1,850, where ETH could bottom in the case of an extended downtrend.
As Cointelegraph reported, Ether could avoid the breakdown as long as it holds above $3,000, supported by bullish network metrics and record staking demand.
This article does not contain investment advice or recommendations. Every investment and trading move involves risk, and readers should conduct their own research when making a decision. While we strive to provide accurate and timely information, Cointelegraph does not guarantee the accuracy, completeness, or reliability of any information in this article. This article may contain forward-looking statements that are subject to risks and uncertainties. Cointelegraph will not be liable for any loss or damage arising from your reliance on this information.
