


Ether (ETH) could see another sharp drop after losing the support level at $2,800, with technical charts and onchain data suggesting the downtrend will continue.
Key takeaways:
-
Ether’s descending and symmetrical triangle setups converge at $2,100.
-
Ether is at levels that have previously preceded deeper price corrections, based on onchain data.
Ether’s chart technicals converge at $2,100
The ETH/USD pair has dropped by over 10% in the last three days, dipping below the key support at $2,800.
Ether has not traded below this level since Dec. 3, 2025, and losing it suggests lower ETH price levels could be in the cards.
Related: Crypto market weakness persists, but Ethereum metrics hint at rally to $3.3K
ETH is trading around $2,700 at the time of writing, a “do or die level for bulls,” said Metacryptox, adding:
“A failure to hold here confirms the bearish dominance, potentially opening the doors to the $2,500 mid-range.”
The $2,800 level coincides with the horizontal line of a descending triangle, which was breached on Thursday.
The next major support is $2,500, which coincides with the 200-week simple moving average (SMA), as shown in the chart below.
Below that, the price could drop toward the measured target of the triangle at $2,150, or a 20% decline from the current level.
A bearish divergence from the relative strength index, which has dropped to 34 from 68 in early January, shows weakening price momentum.
Meanwhile, Veteran trader Peter Brandt said the “burden of proof” was on the bulls after the ETH/USD pair broke below the lower trendline of a symmetrical triangle.
Brandt’s chart points to more downside risk, particularly after the price dropped below the $2,800 mark.
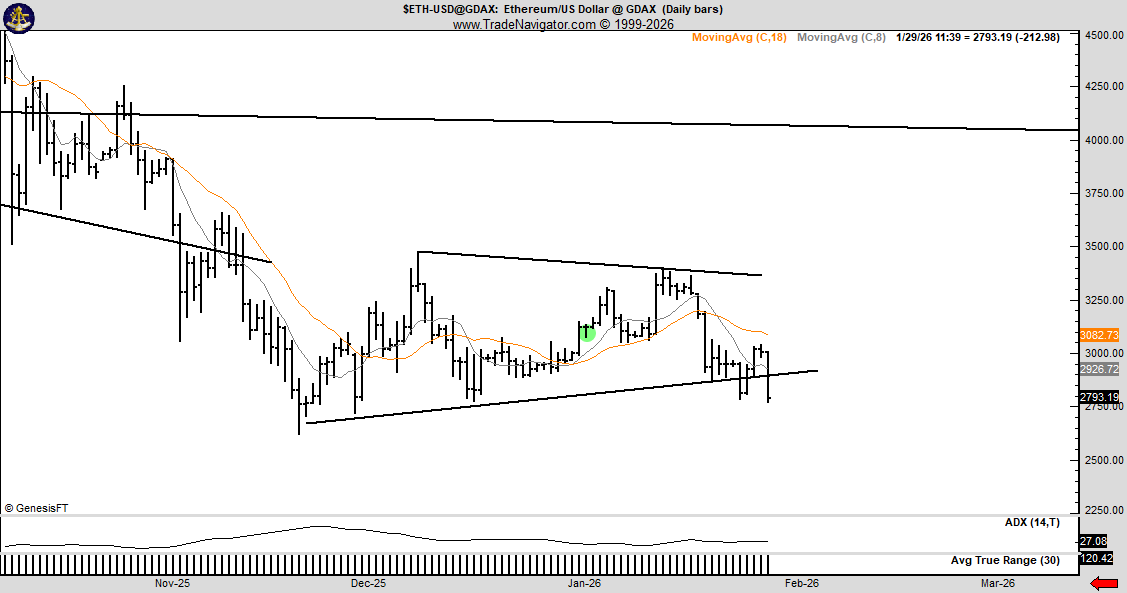
The measured target of the pattern, calculated by adding the width of the triangle to the breakout point, is $2,100, representing a 22% decline from the current price.
As Cointelegraph reported, the area between $3,000 and $2,800 was a key support zone for Ether, and losing it has put ETH at risk of further losses.
Ethereum mirrors past pre-bear market setups
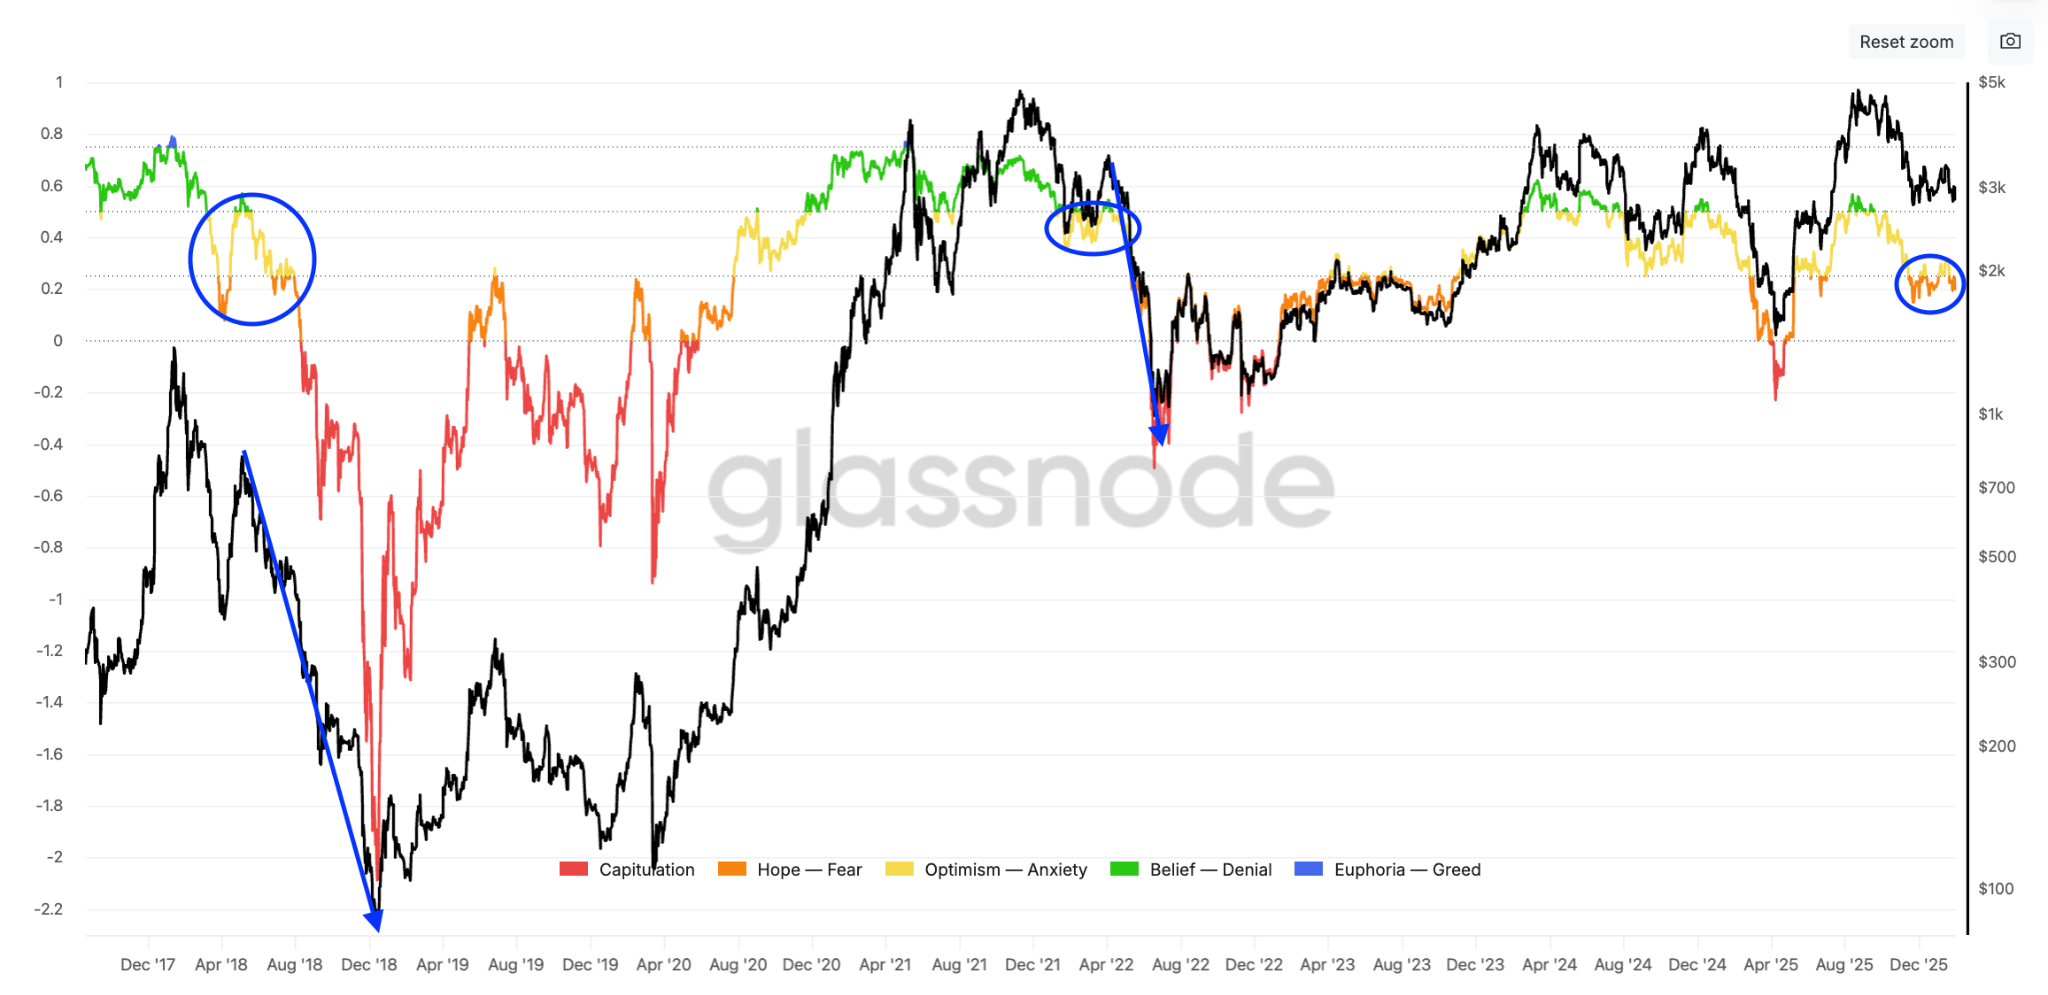
Onchain data also reveals similarities between the current ETH market setup and previous bear cycles.
Ether’s net unrealized profit/loss (NUPL) indicator has transitioned from “anxiety (yellow)” to the “fear zone (orange),” a position that is typically associated with the start of bear markets.
The NUPL measures the difference between the relative unrealized profit and the relative unrealized loss of ETH holders.
In previous market cycles, the transition to fear has accompanied extended price drawdowns, as shown in the chart below.
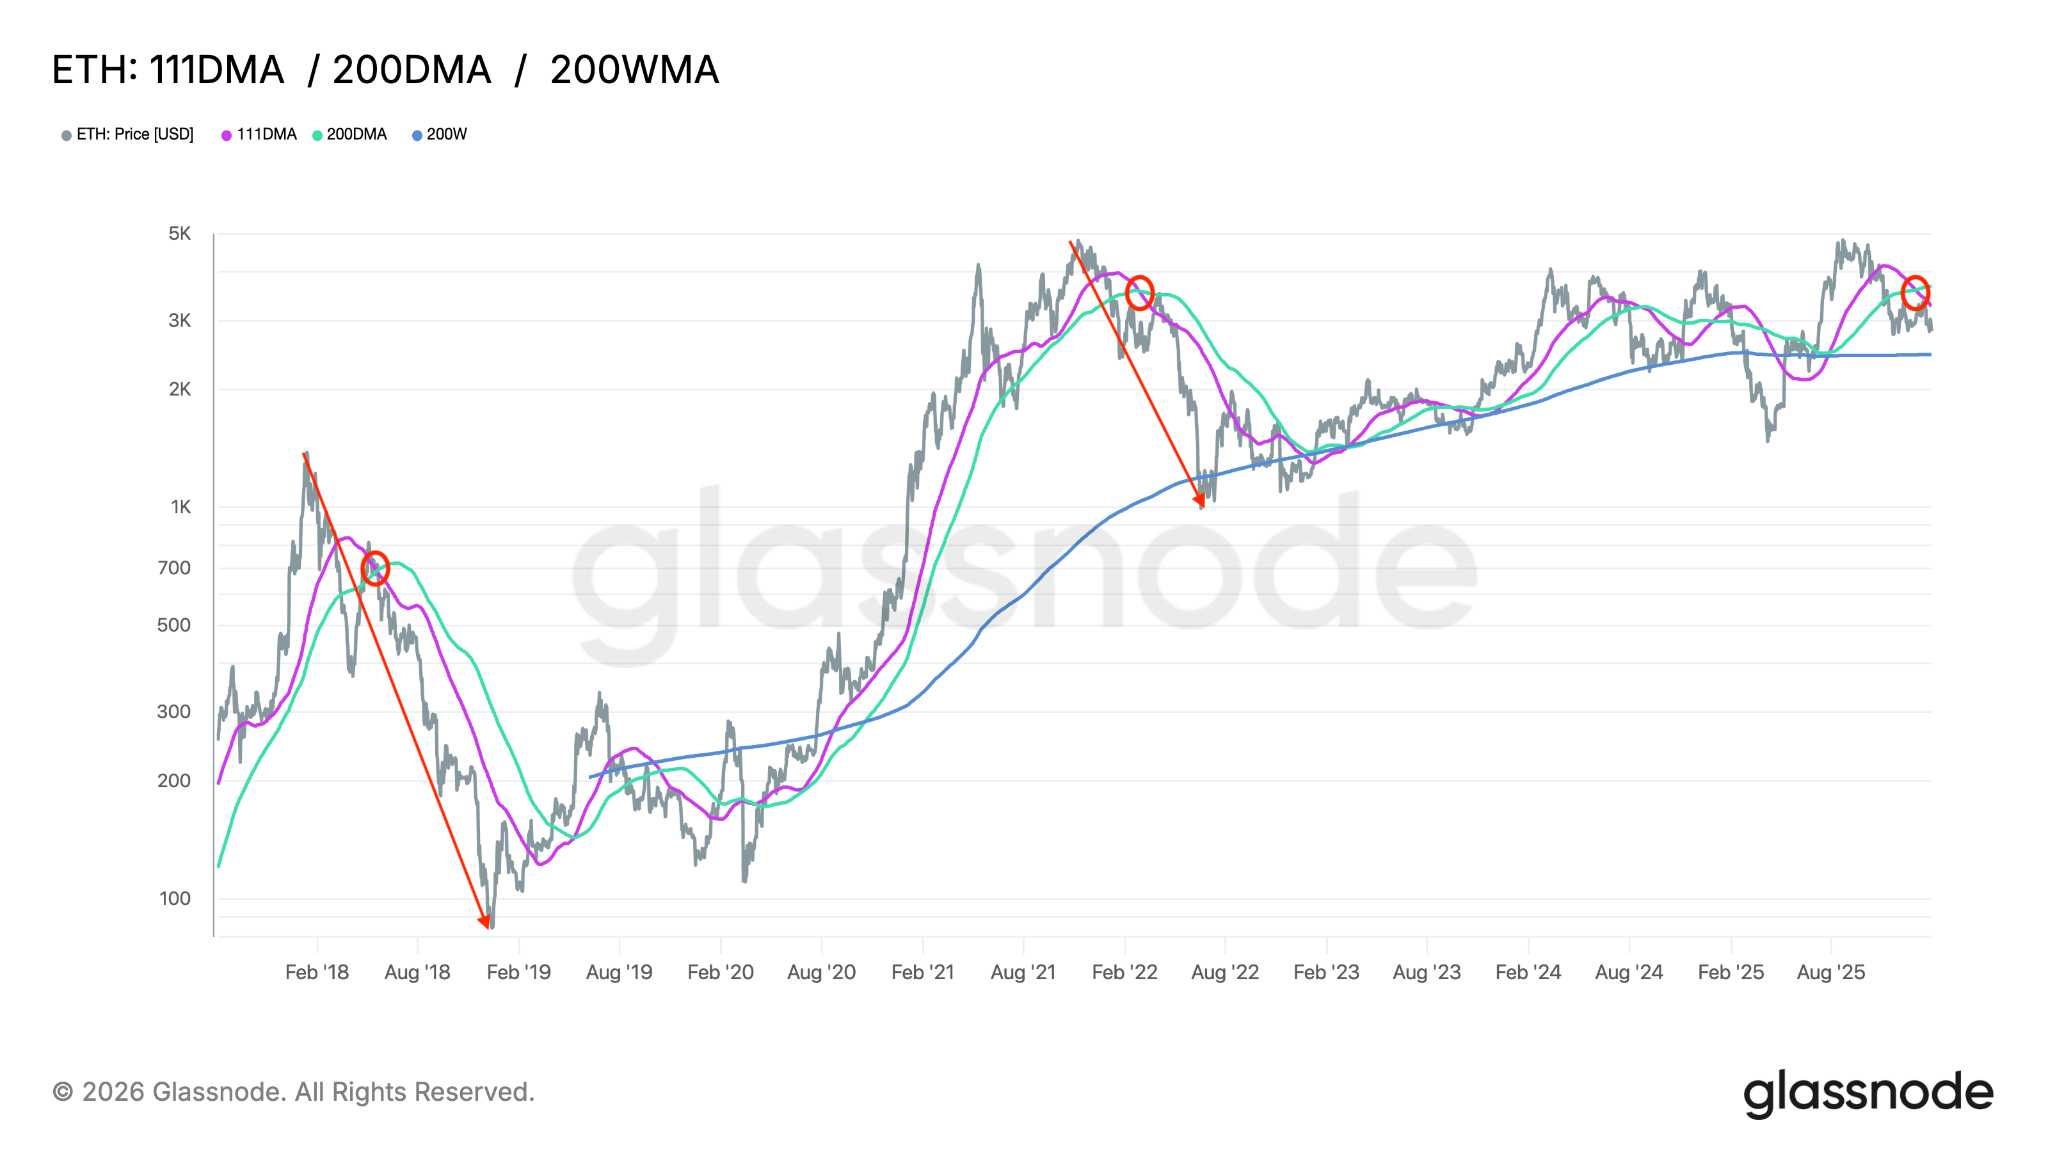
Meanwhile, chart technicals show that the 111-day moving average (MA) is currently trading below the 200-day MA. Similar crossovers triggered the start of deeper ETH price drawdowns during the 2018 and 2022 bear markets, as shown in the chart below.
This article does not contain investment advice or recommendations. Every investment and trading move involves risk, and readers should conduct their own research when making a decision. While we strive to provide accurate and timely information, Cointelegraph does not guarantee the accuracy, completeness, or reliability of any information in this article. This article may contain forward-looking statements that are subject to risks and uncertainties. Cointelegraph will not be liable for any loss or damage arising from your reliance on this information.
