


Key points:
-
Bitcoin attempted a recovery on Tuesday, but the market open on Wednesday saw bears applying pressure at the intra-day range highs.
-
Several altcoins are falling toward critical support levels, signaling that the bears remain in control.
Buyers are trying to sustain Bitcoin (BTC) above the $90,000 level, but the bears continue to build pressure. According to Farside Investors data, spot BTC exchange-traded funds recorded outflows of $372 million on Tuesday, extending the withdrawal streak to five days. That suggests the sentiment remains negative and investors are wary of buying into the decline.
Morgan Creek Capital founder Mark Yusko said in an interview with Cointelegraph that BTC has entered a bear market, but he anticipates a milder correction compared to the previous bear cycles. He expects the institutional adoption, reduced leverage, the broader macro environment and debasement of fiat currencies to act as long-term tailwinds.
A few other analysts are more optimistic in the short term, expecting the selling in BTC to subside soon. BitMine chairman Tom Lee said in an interview with CNBC that the downside is showing signs of exhaustion, and Tom Demar of Demar Analytics expects BTC to bottom “sometime this week.”
How far lower could BTC and the major altcoins fall? Let’s analyze the charts of the top 10 cryptocurrencies to find out.
Bitcoin price prediction
BTC fell below the $90,000 level on Tuesday, but the bulls purchased the dip as seen from the long tail on the candlestick.
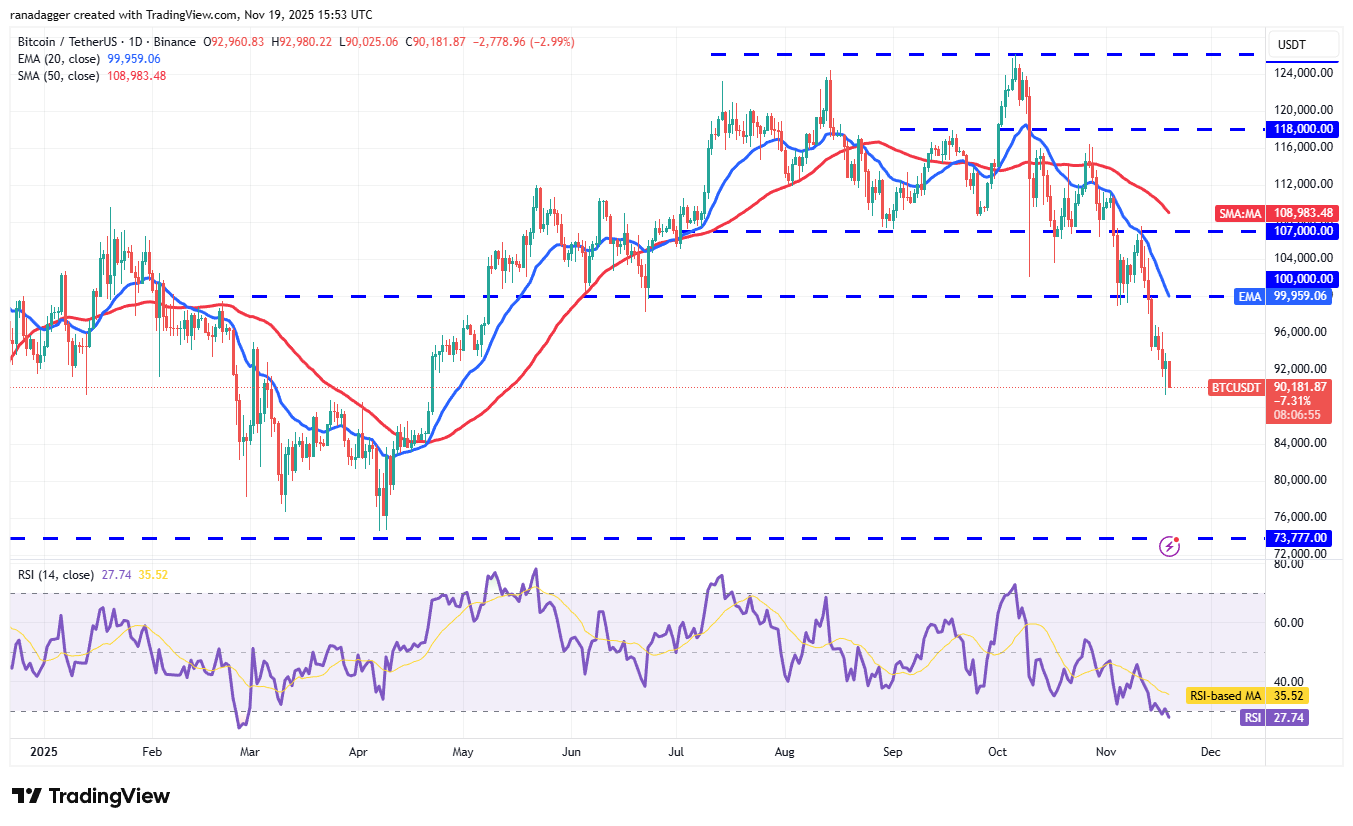
The bears are in no mood to give up as they sold the rally and are attempting to sink the Bitcoin price below $89,253. If they manage to do that, the drop could extend to $87,800 and subsequently to $83,000.
Any recovery attempt is expected to face selling at the psychological level of $100,000. If the price turns down from the $100,000 level, it suggests that the bears have flipped the level into resistance. That increases the risk of a further downside.
Buyers will have to push and maintain the BTC/USDT pair above the $100,000 resistance to signal a comeback.
Ether price prediction
Ether (ETH) has been witnessing a tough battle between the buyers and sellers near the $3,000 level.
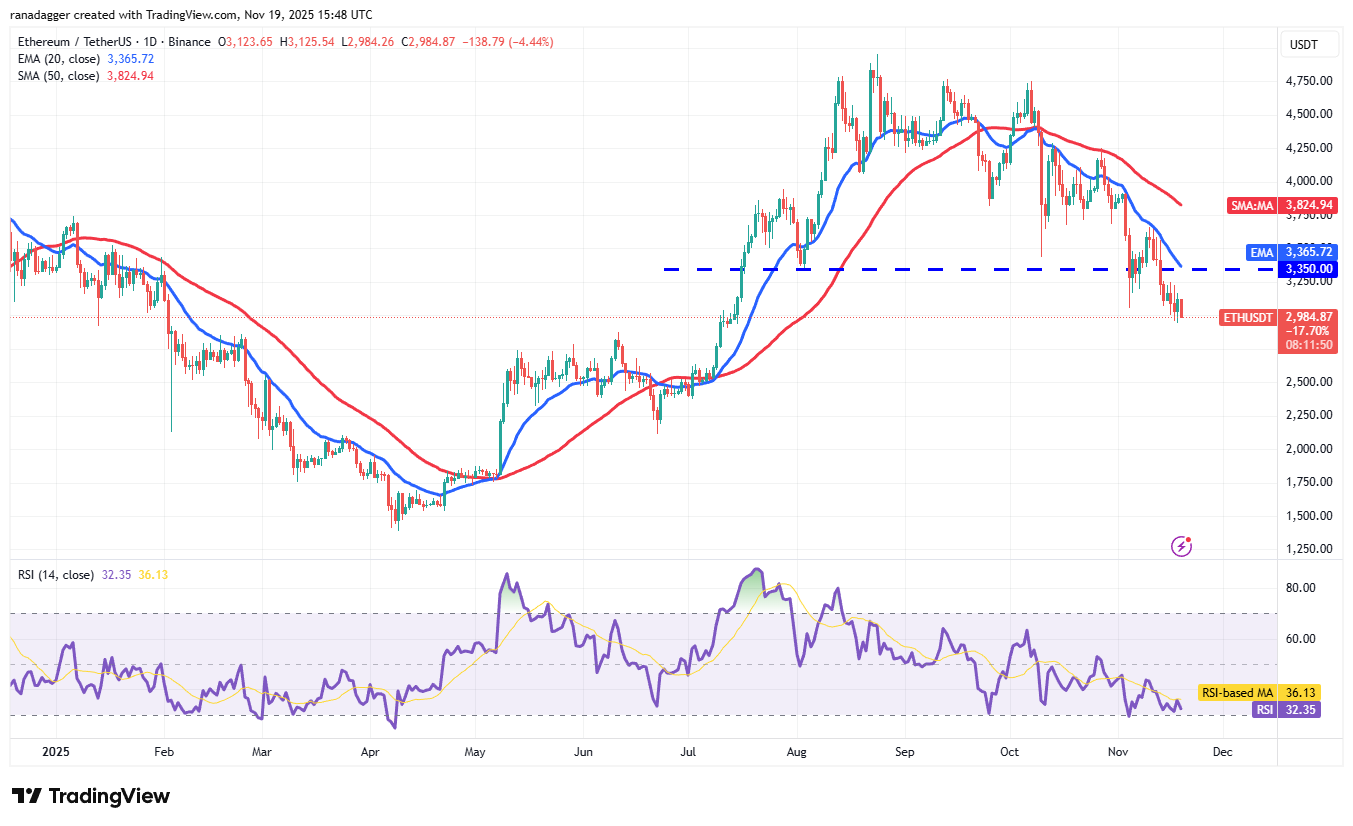
Any relief rally is expected to face significant selling at the 20-day exponential moving average ($3,365). If the price turns down sharply from the 20-day EMA, the risk of a break below $2,946 increases. The ETH/USDT pair may then plunge toward $2,500.
Alternatively, a break and close above the 20-day EMA suggests that the markets have rejected the break below $3,350. The Ether price could then climb to the 50-day simple moving average ($3,824).
XRP price prediction
Buyers attempted to start a recovery in XRP (XRP) on Tuesday, but the bears sold at higher levels.
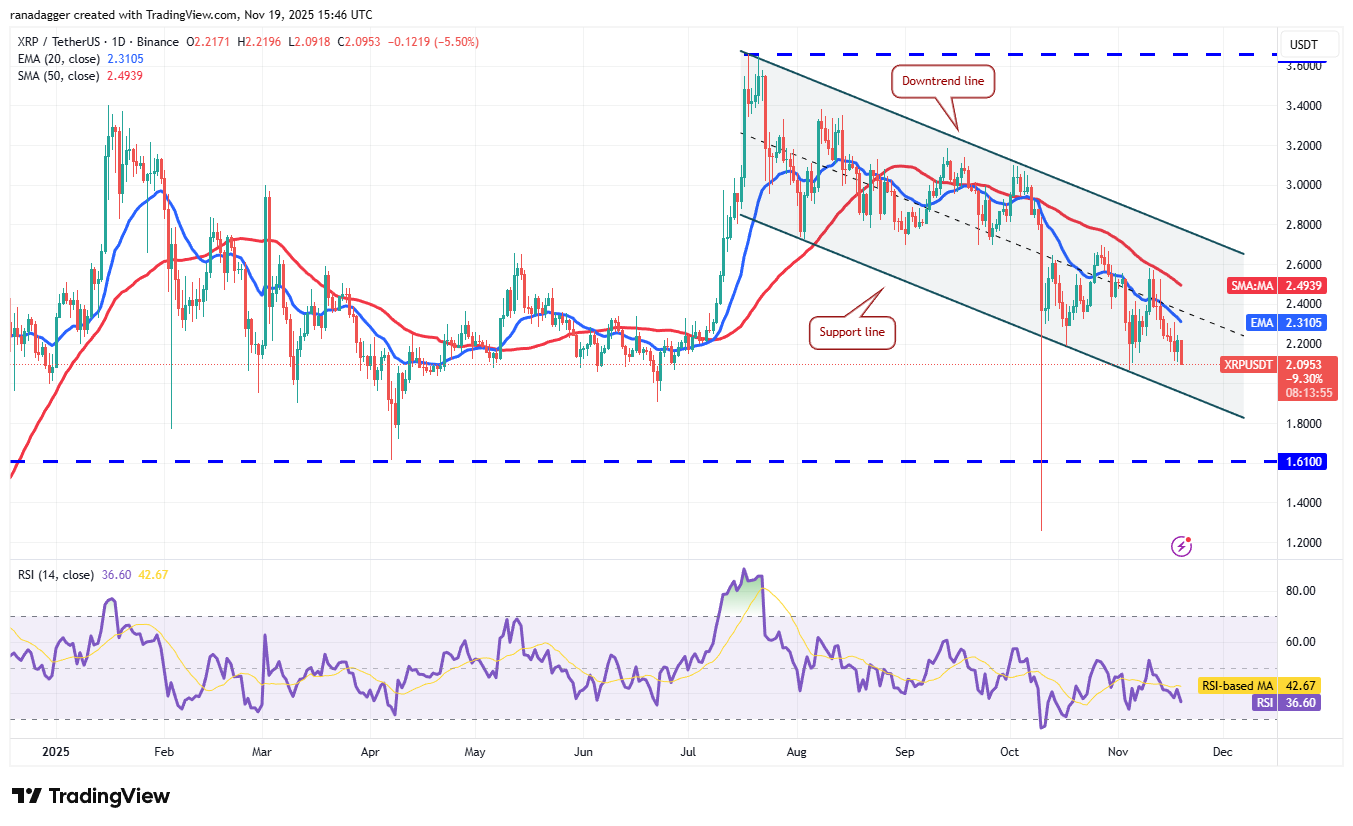
The bears will try to sink the XRP/USDT pair to the support line of the descending channel pattern, which is a crucial level to watch out for. If the XRP price rebounds off the support line and breaks above the 20-day EMA ($2.31), it suggests that the pair may remain inside the channel for some more time.
On the other hand, a break and close below the channel could open the doors for a fall to the crucial support at $1.61.
BNB price prediction
Buyers are attempting to maintain BNB (BNB) above the $860 level, but the bears have continued to exert pressure.
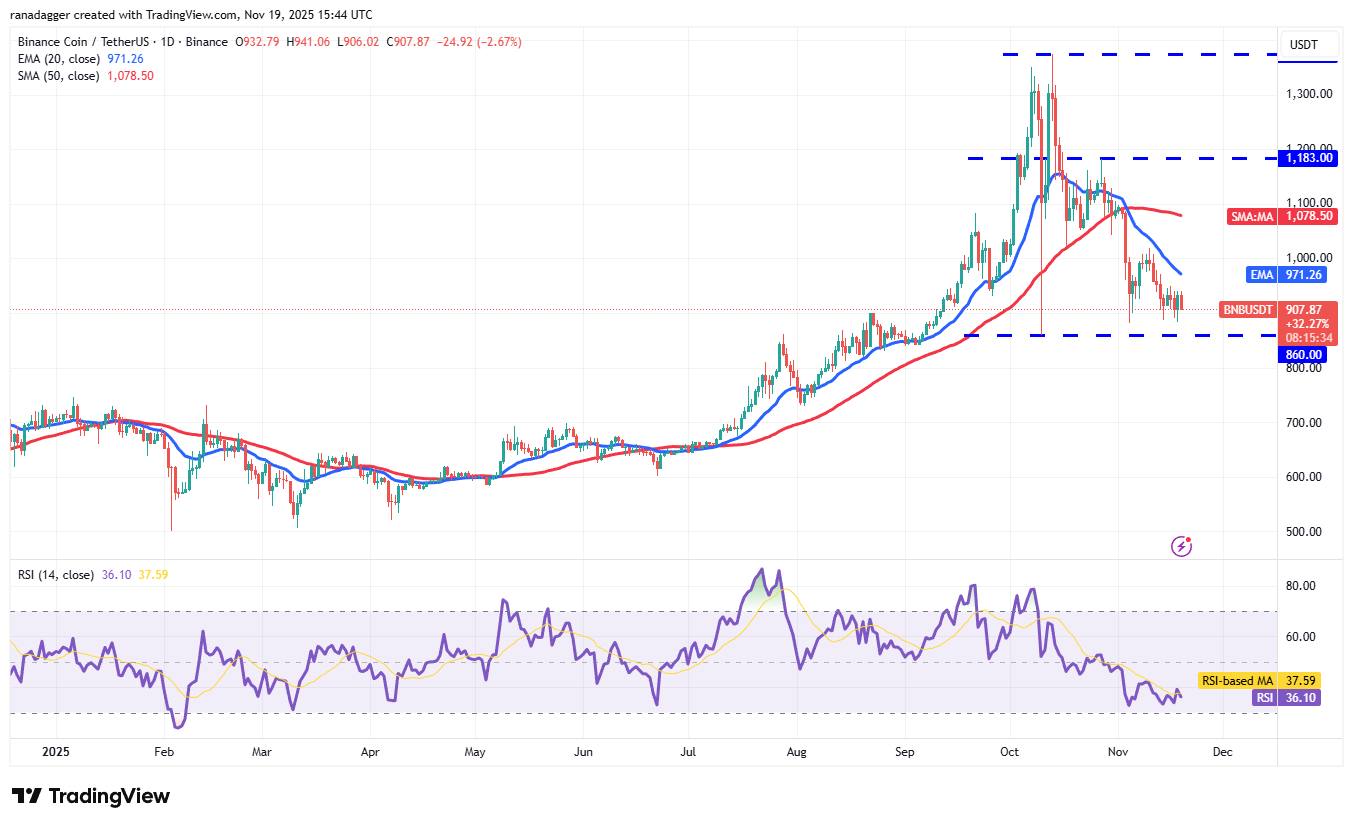
The bears will attempt to sink the BNB price below the $860 support and deepen the correction to $730.
Contrarily, if the price turns up and breaks above the 20-day EMA ($971), it suggests that the sellers are losing their grip. The BNB/USDT pair could rise to $1,019 and then to the 50-day SMA ($1,078). Such a move signals a possible range-bound action between $860 and $1,183 for some time.
Solana price prediction
Solana (SOL) bounced off the $126 support on Tuesday, but the relief rallies are being sold into.
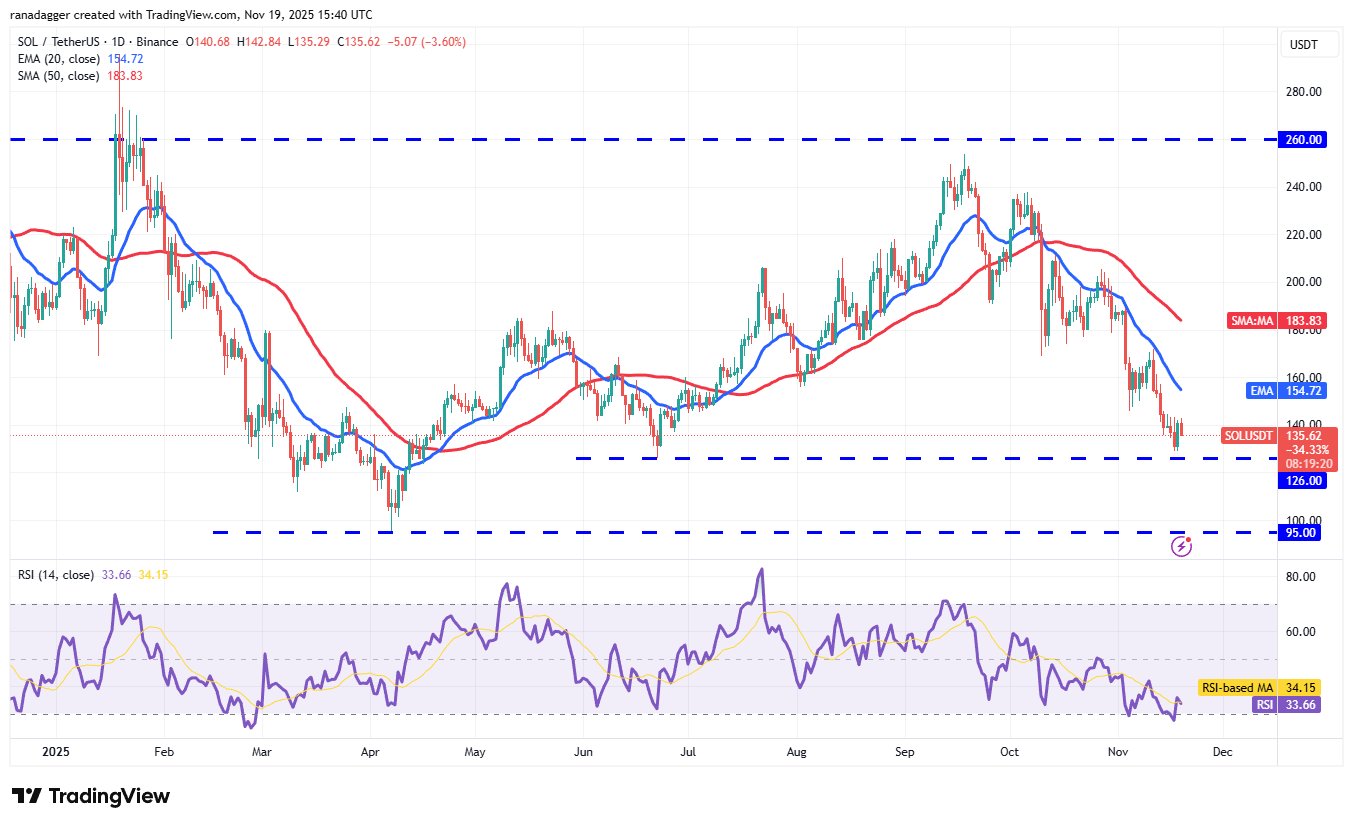
The bears will again attempt to pull the price below the $126 support. If they can pull it off, the Solana price could plummet toward the next major support at $95.
Conversely, if the price turns up from the current level or $126 and rises above the 20-day EMA ($154), it suggests that the bulls are attempting a comeback. The SOL/USDT pair could then climb to the 50-day SMA ($183), which is likely to attract sellers again.
Dogecoin price prediction
Dogecoin (DOGE) turned up from $0.15 on Tuesday, but the shallow bounce shows a lack of aggressive buying by the bulls.
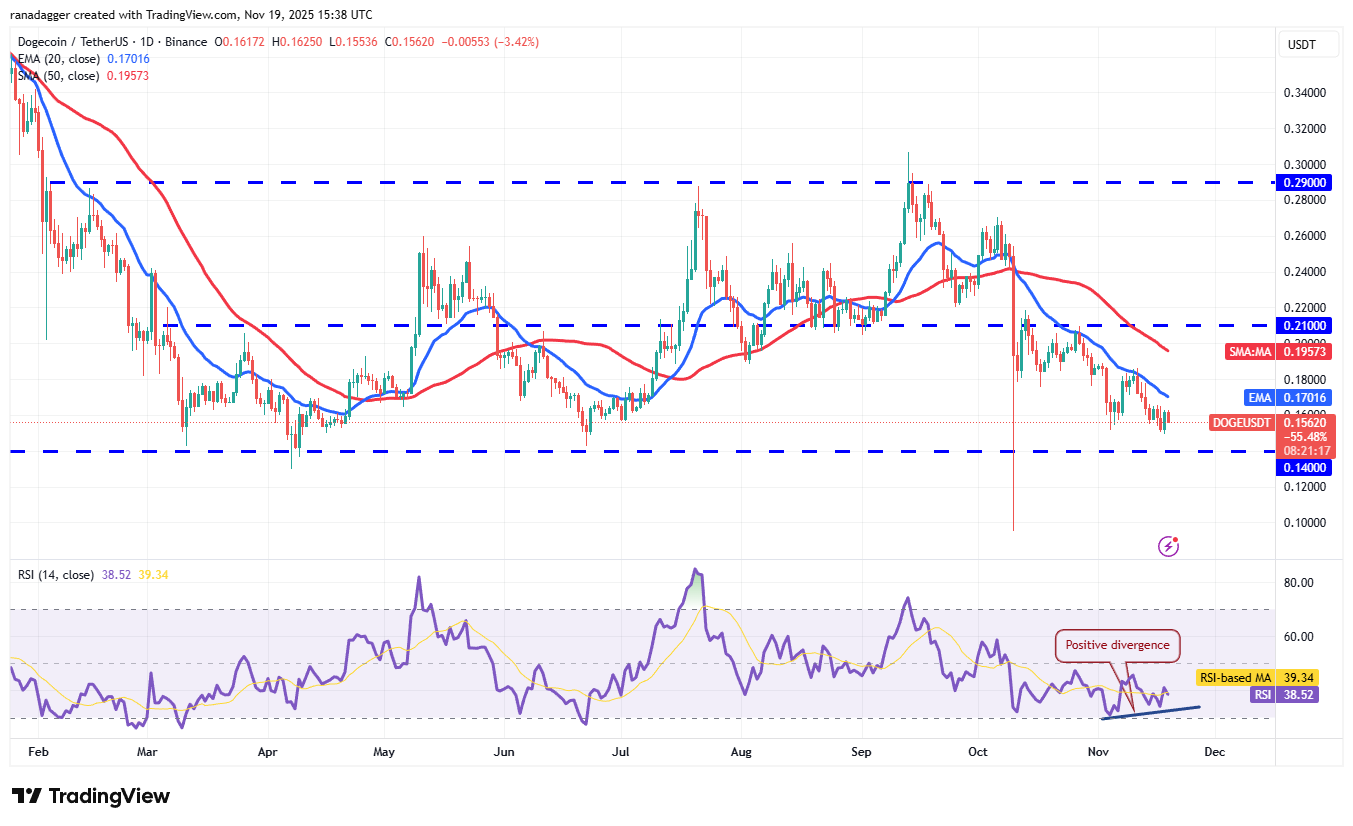
The sellers will attempt to sink the Dogecoin price to the $0.14 level, where the buyers are expected to step in. The positive divergence on the RSI suggests that the selling pressure is reducing and a relief rally is possible. Buyers will have to drive the DOGE/USDT pair above the 20-day EMA to gain strength. The pair may then climb to the 50-day SMA ($0.19).
On the contrary, a break below the $0.14 support could intensify selling, pulling the pair to the Oct. 10 low of $0.10.
Cardano price prediction
Cardano (ADA) extended its slide below the $0.50 level, indicating that the bears remain in control.
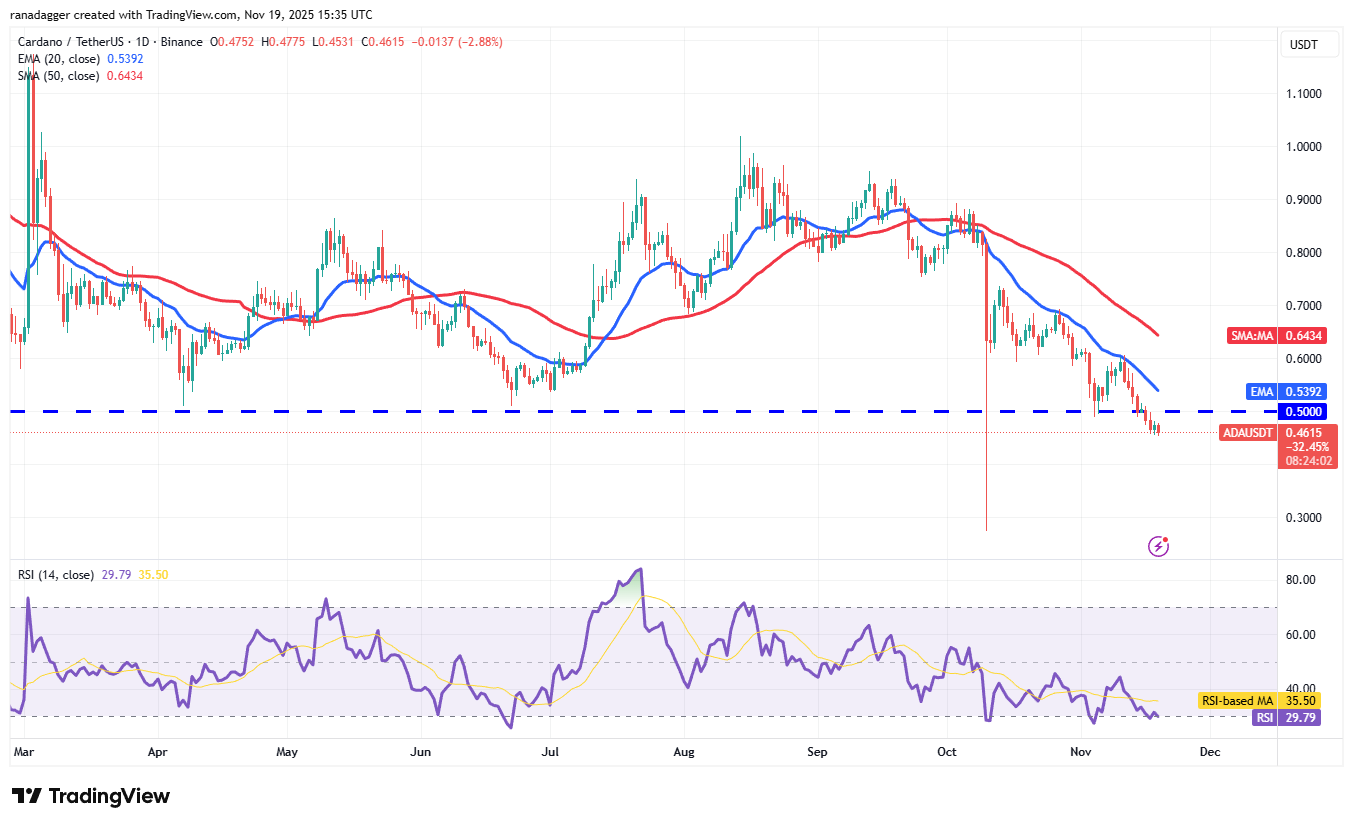
There is minor support at $0.45, but if the level cracks, the ADA/USDT pair could drop to $0.40. The Cardano price may stage a recovery from $0.40, but is likely to face selling at $0.50. If the price turns down from $0.50, it suggests that the bears have flipped the level into resistance. The pair may then decline toward the Oct. 10 intraday low of $0.27.
Buyers will have to thrust the price above the 20-day EMA ($0.54) to indicate that the selling pressure is reducing. The pair could then rise to the 50-day SMA ($0.64) and later to $0.74.
Related: Here’s what happened in crypto today
Hyperliquid price prediction
Hyperliquid (HYPE) reached the 50-day SMA ($41.51) on Tuesday, but the bulls could not overcome the barrier.
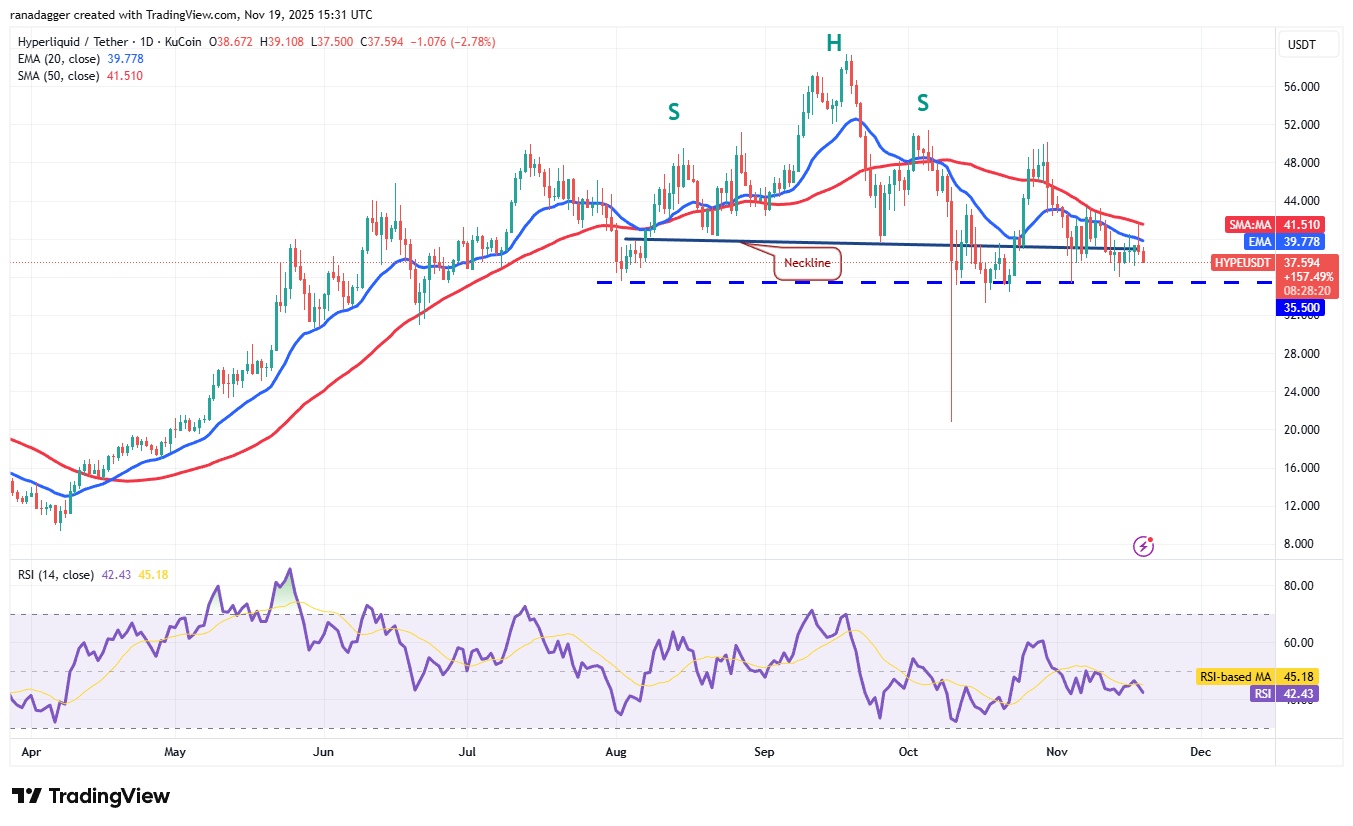
The price turned down, and the bears are striving to pull the HYPE/USDT pair below the $35.50 support. If they succeed, the selling could accelerate and the Hyperliquid price could dive to $28.
The first sign of strength will be a break and close above the 50-day SMA. The pair could then rally to $44 and later to $52, where the bears are expected to mount a strong defense.
Bitcoin Cash price prediction
The bulls attempted to push Bitcoin Cash (BCH) above the resistance line on Tuesday, but the bears held their ground.
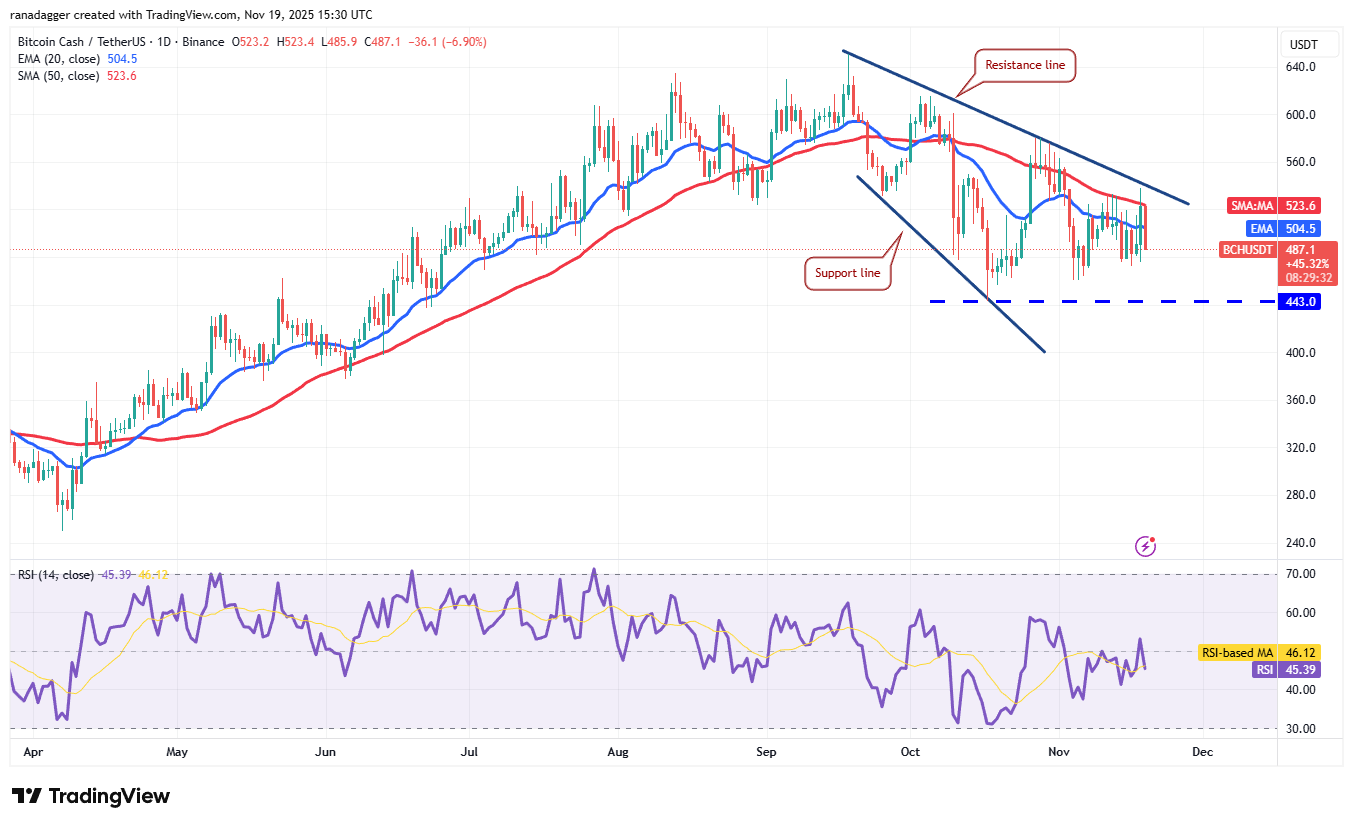
The Bitcoin Cash price has turned down sharply and slipped below the moving averages. Sellers will try to strengthen their position by pulling the price below the $443 support. If they manage to do that, the BCH/USDT pair could plummet to the support line.
The bulls will have to push and maintain the price above the resistance line to signal that the corrective phase may be over. The pair could then rally to $580 and subsequently to $615.
Zcash price prediction
Zcash (ZEC) is facing solid resistance at $750, but the bulls have not allowed the price to dip below the 20-day EMA ($536).
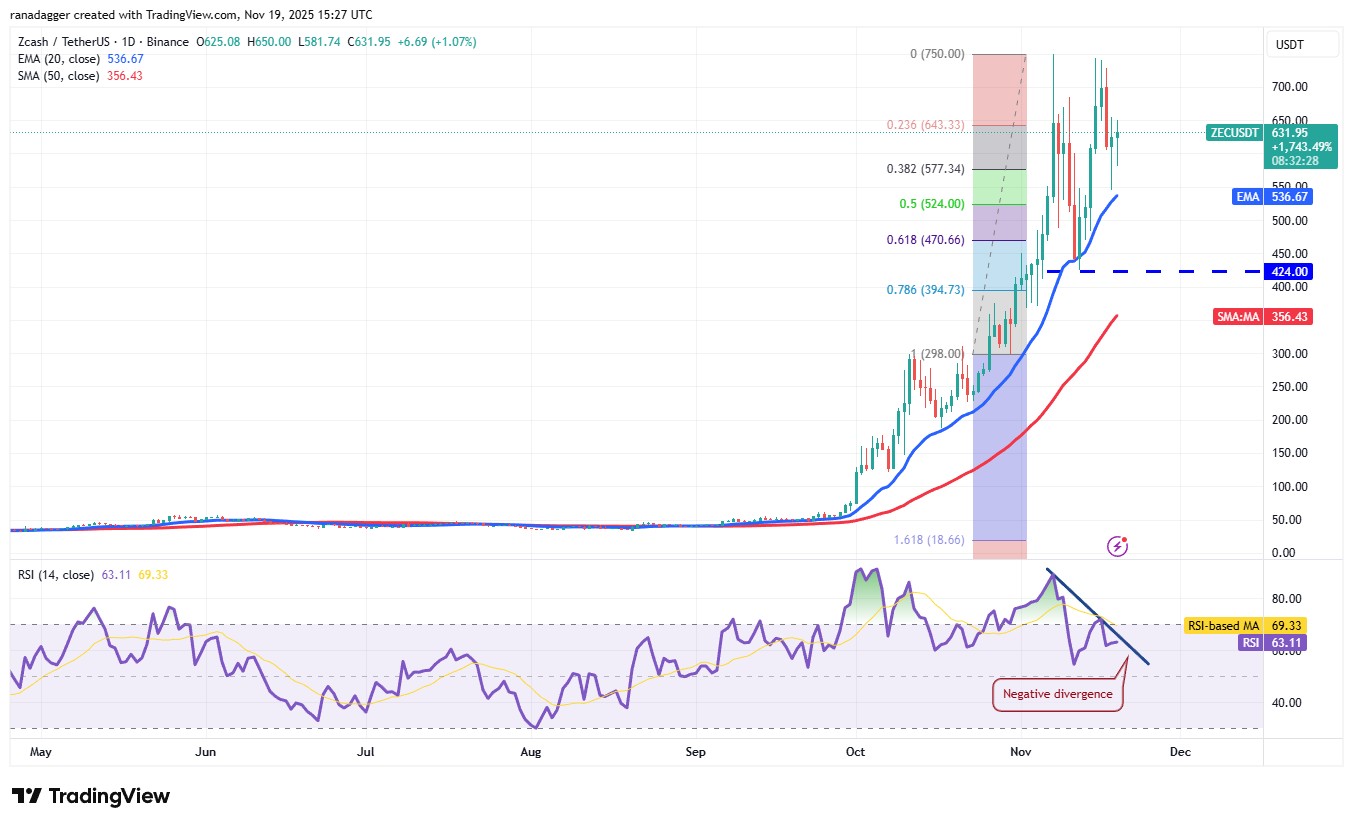
The upsloping moving averages indicate advantage to buyers, but the negative divergence on the RSI shows that the momentum is slowing down. That increases the risk of a break below the 20-day EMA. If that happens, the ZEC/USDT pair could drop toward $424.
The buyers will have to defend the 20-day EMA if they want to retain the advantage. If the Zcash price turns up from the current level or rebounds off the 20-day EMA with strength, the bulls will again attempt to drive the pair above $750.
This article does not contain investment advice or recommendations. Every investment and trading move involves risk, and readers should conduct their own research when making a decision.
