


The price of Ethereum’s native token, Ether (ETH), risks sliding below $2,000 in February as a classic bearish setup plays out.
Key takeaways:
-
ETH breakdown keeps $1,665 downside target in focus.
-
MVRV bands also point to price sliding toward $1,725 or lower before a potential bottom.
ETH risks declining 25% in February
As of Wednesday, ETH had entered the breakdown stage of its prevailing inverse-cup-and-handle (IC&H) pattern. This could extend a downtrend that has already erased about 60% from its August 2025 peak.
An IC&H pattern forms when price forms a rounded top and then drifts higher in a small recovery channel. It typically resolves when the price breaks below the neckline support, often falling by as much as the cup’s maximum height.
Ether broke below the inverse cup-and-handle neckline near $2,960 in January. It later rebounded to retest that level as resistance, a common post-breakdown move, only to resume its decline.
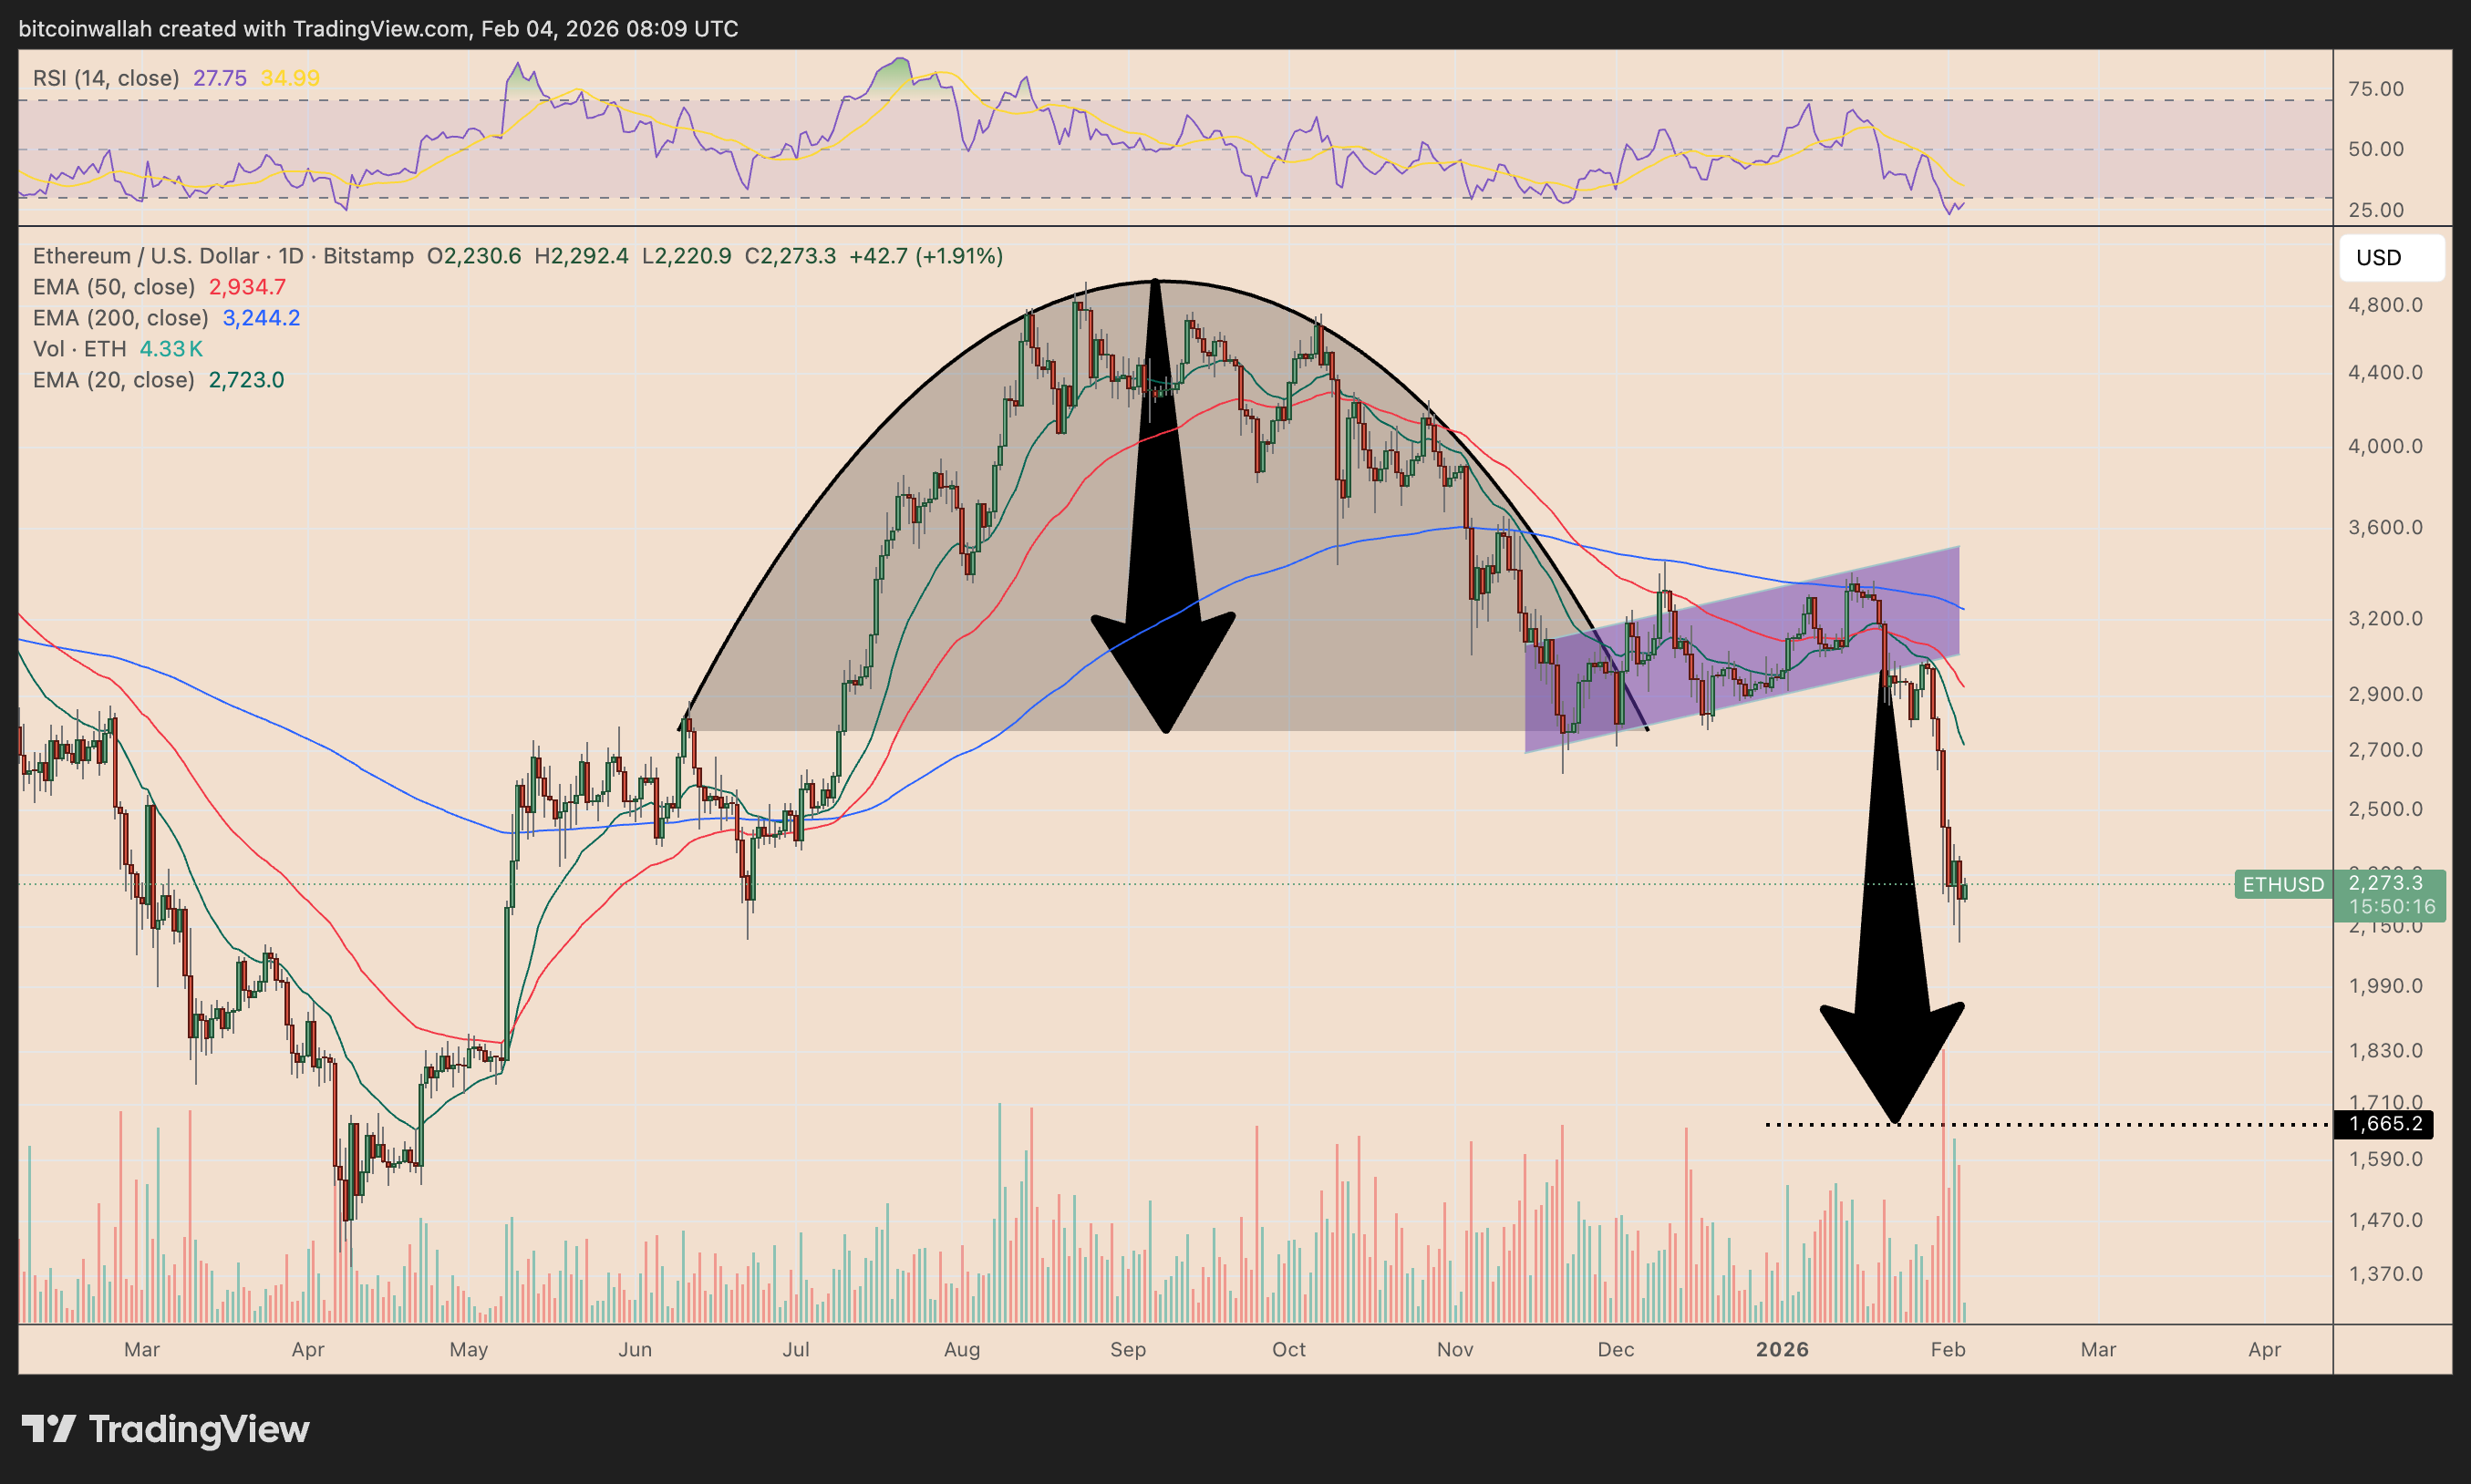
ETH’s rebound also stalled below the 20-day (green) and 50-day (red) EMAs, which acted as overhead resistance.
These confluence indicators raised ETH’s odds of declining toward the IC&H breakdown target at around $1,665, down 25%, in February or by early March.
Historically, the inverse cup-and-handle hits its projected downside target with an 82% success rate, according to a study by Chartswatcher.
From a macro perspective, Ethereum’s downside risk is increasing as traders cut back on crypto bets, worried the market could slip into a broader 2026 downturn similar to past “four-year cycle” pullbacks.
Fears of an “AI bubble” popping are also forcing traders to avoid riskier bets such as crypto.
Ethereum’s MVRV bands hint at $1,725 target
Ethereum’s technical downside target sat just below the lowest boundary of its MVRV extreme deviation pricing bands, currently at $1,725.
These bands are onchain price zones that show when ETH is trading below or above the average price at which traders last moved their coins.
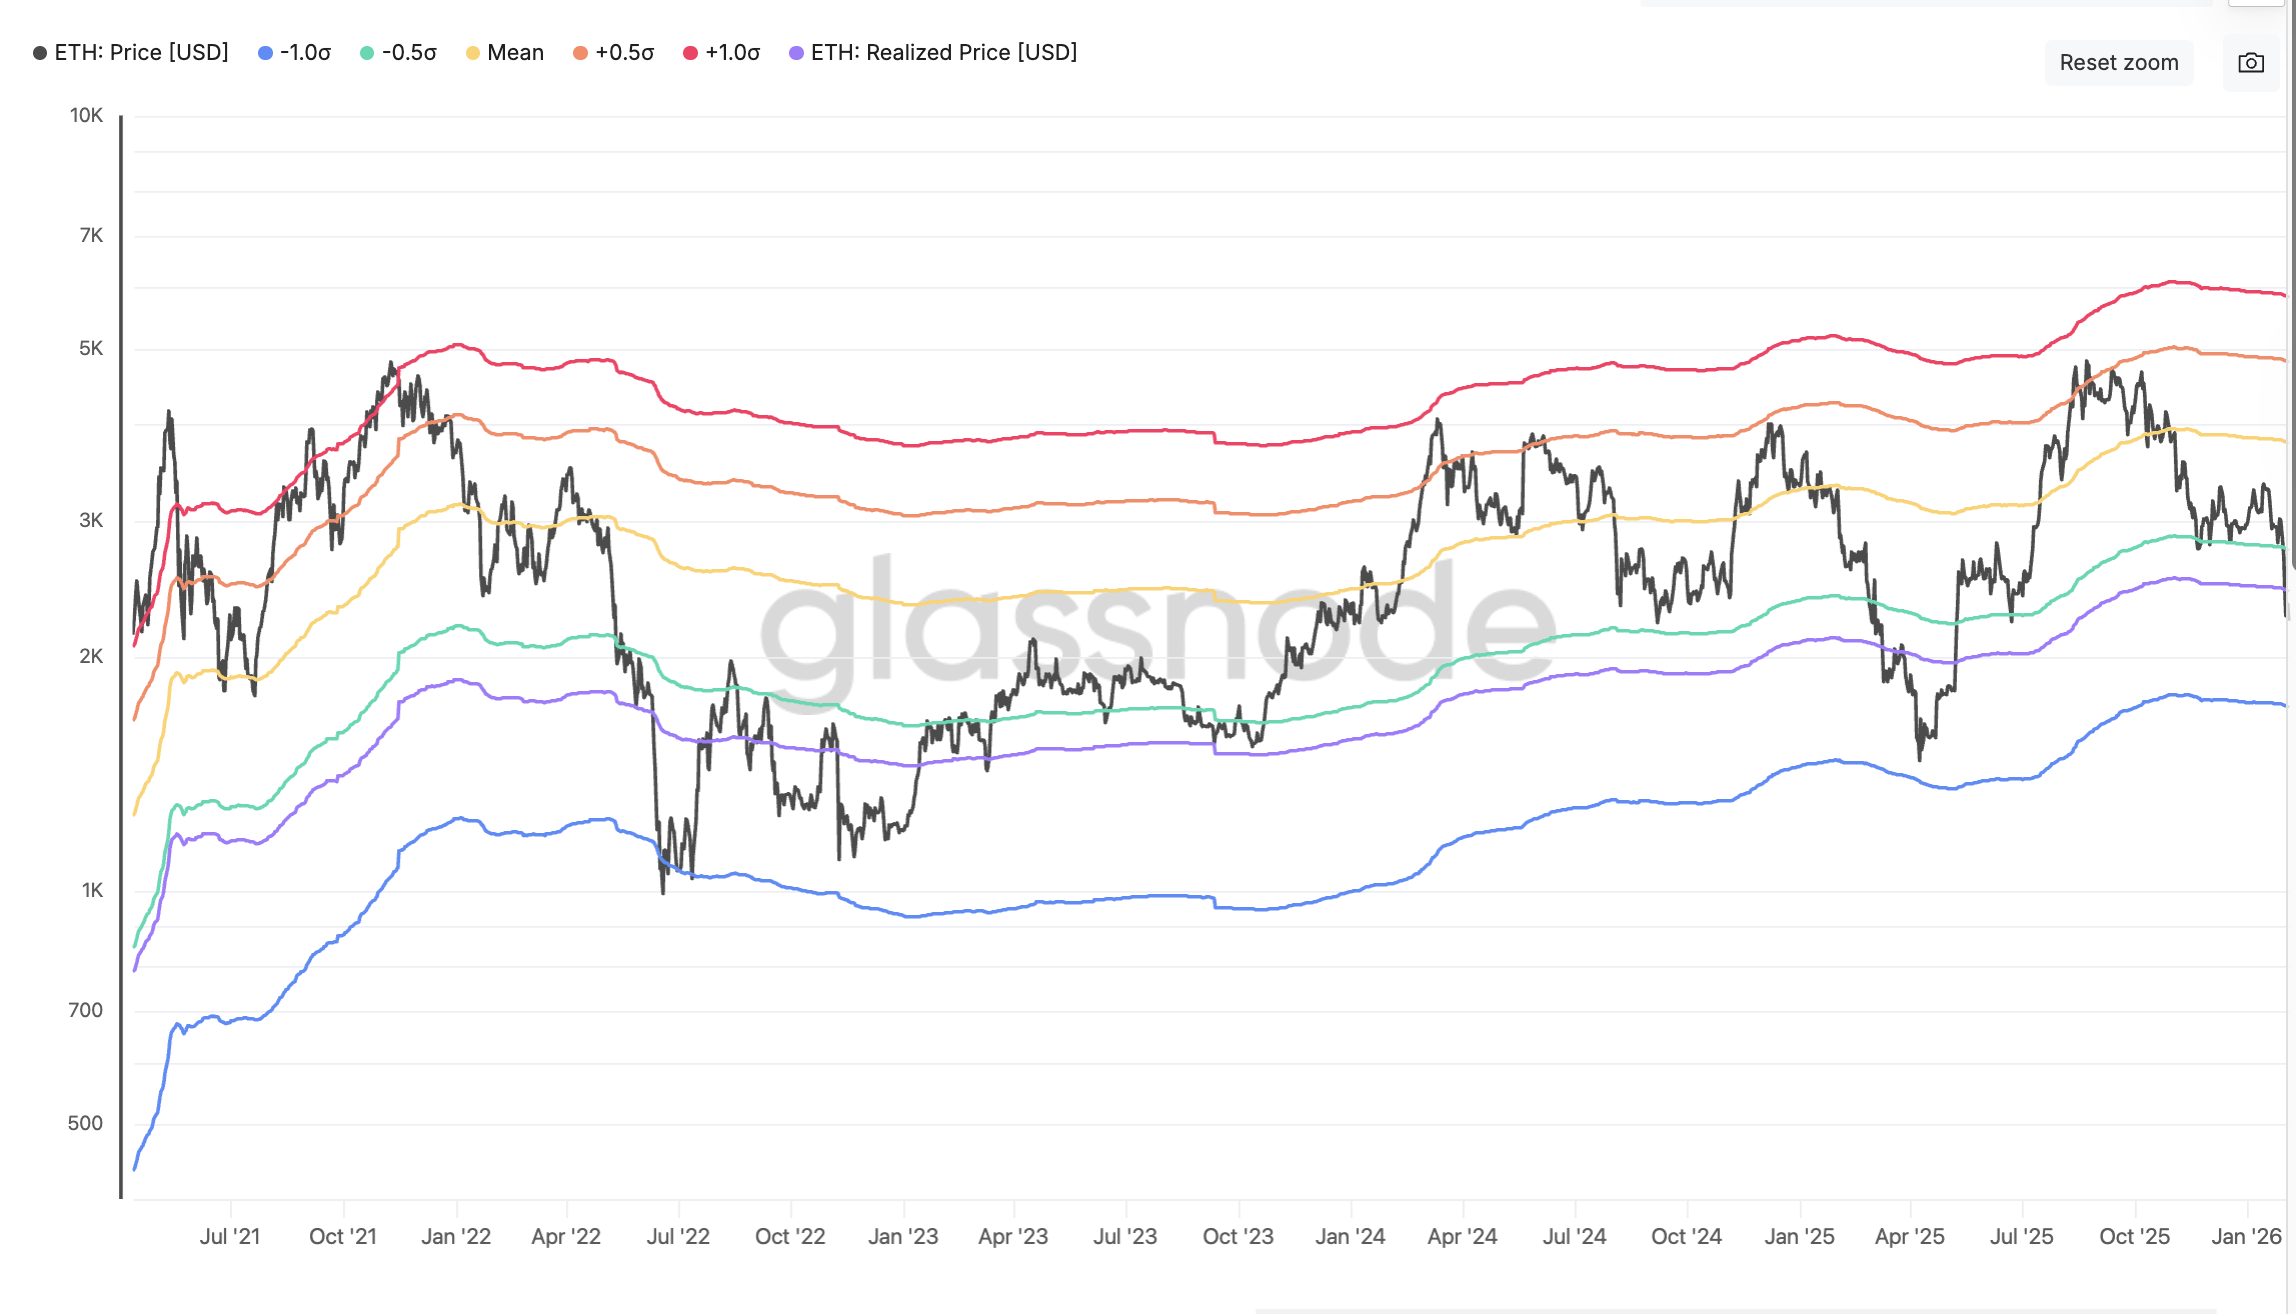
Historically, ETH price plunged near or even below the lowest MVRV band before bottoming out.
That includes the April 2025 bounce, when the ETH price rose 90% a month after testing the lowest MVRV deviation band around $1,390. A similar rebound occurred in June 2018.
Related: ETH funding rate turns negative, but US macro conditions mute buy signal
Therefore, Ether may decline toward $1,725 or below in February, which lines up with the IC&H downside target.
This article does not contain investment advice or recommendations. Every investment and trading move involves risk, and readers should conduct their own research when making a decision. While we strive to provide accurate and timely information, Cointelegraph does not guarantee the accuracy, completeness, or reliability of any information in this article. This article may contain forward-looking statements that are subject to risks and uncertainties. Cointelegraph will not be liable for any loss or damage arising from your reliance on this information.
