


Bitcoin’s (BTC) push toward $100,000 met strong resistance, with spot demand showing signs of exhaustion just as sellers stepped in. After setting a local high near $98,000 on Wednesday, BTC retraced for two straight sessions and slipped below $95,000 by Friday New York session.
Key takeaways:
-
Bitcoin’s pullback followed fading spot demand, reflected in a weakening Coinbase premium.
-
Data suggest rallies were driven by aggressive buyers, but without sustained follow-through.
-
Short-term holders sold over 40,000 BTC into strength as the price neared its cost basis.
Bitcoin spot demand fails at the local top
The correction coincided with a rollover in the Coinbase Bitcoin premium index. The metric briefly flipped positive near the highs, a sign of late spot buying, but the price failed to break higher, suggesting limited follow-through from larger buyers.
Bitcoin’s cumulative volume delta (CVD) made higher highs while price formed a higher low. This divergence typically shows aggressive market buying absorbing sell pressure, but without enough strength to push the price higher.
At the same time, the bid–ask ratio stayed negative throughout the rally, meaning sell orders continued to outweigh bids even as the price moved up, a sign that buyers were lifting offers rather than building passive support.
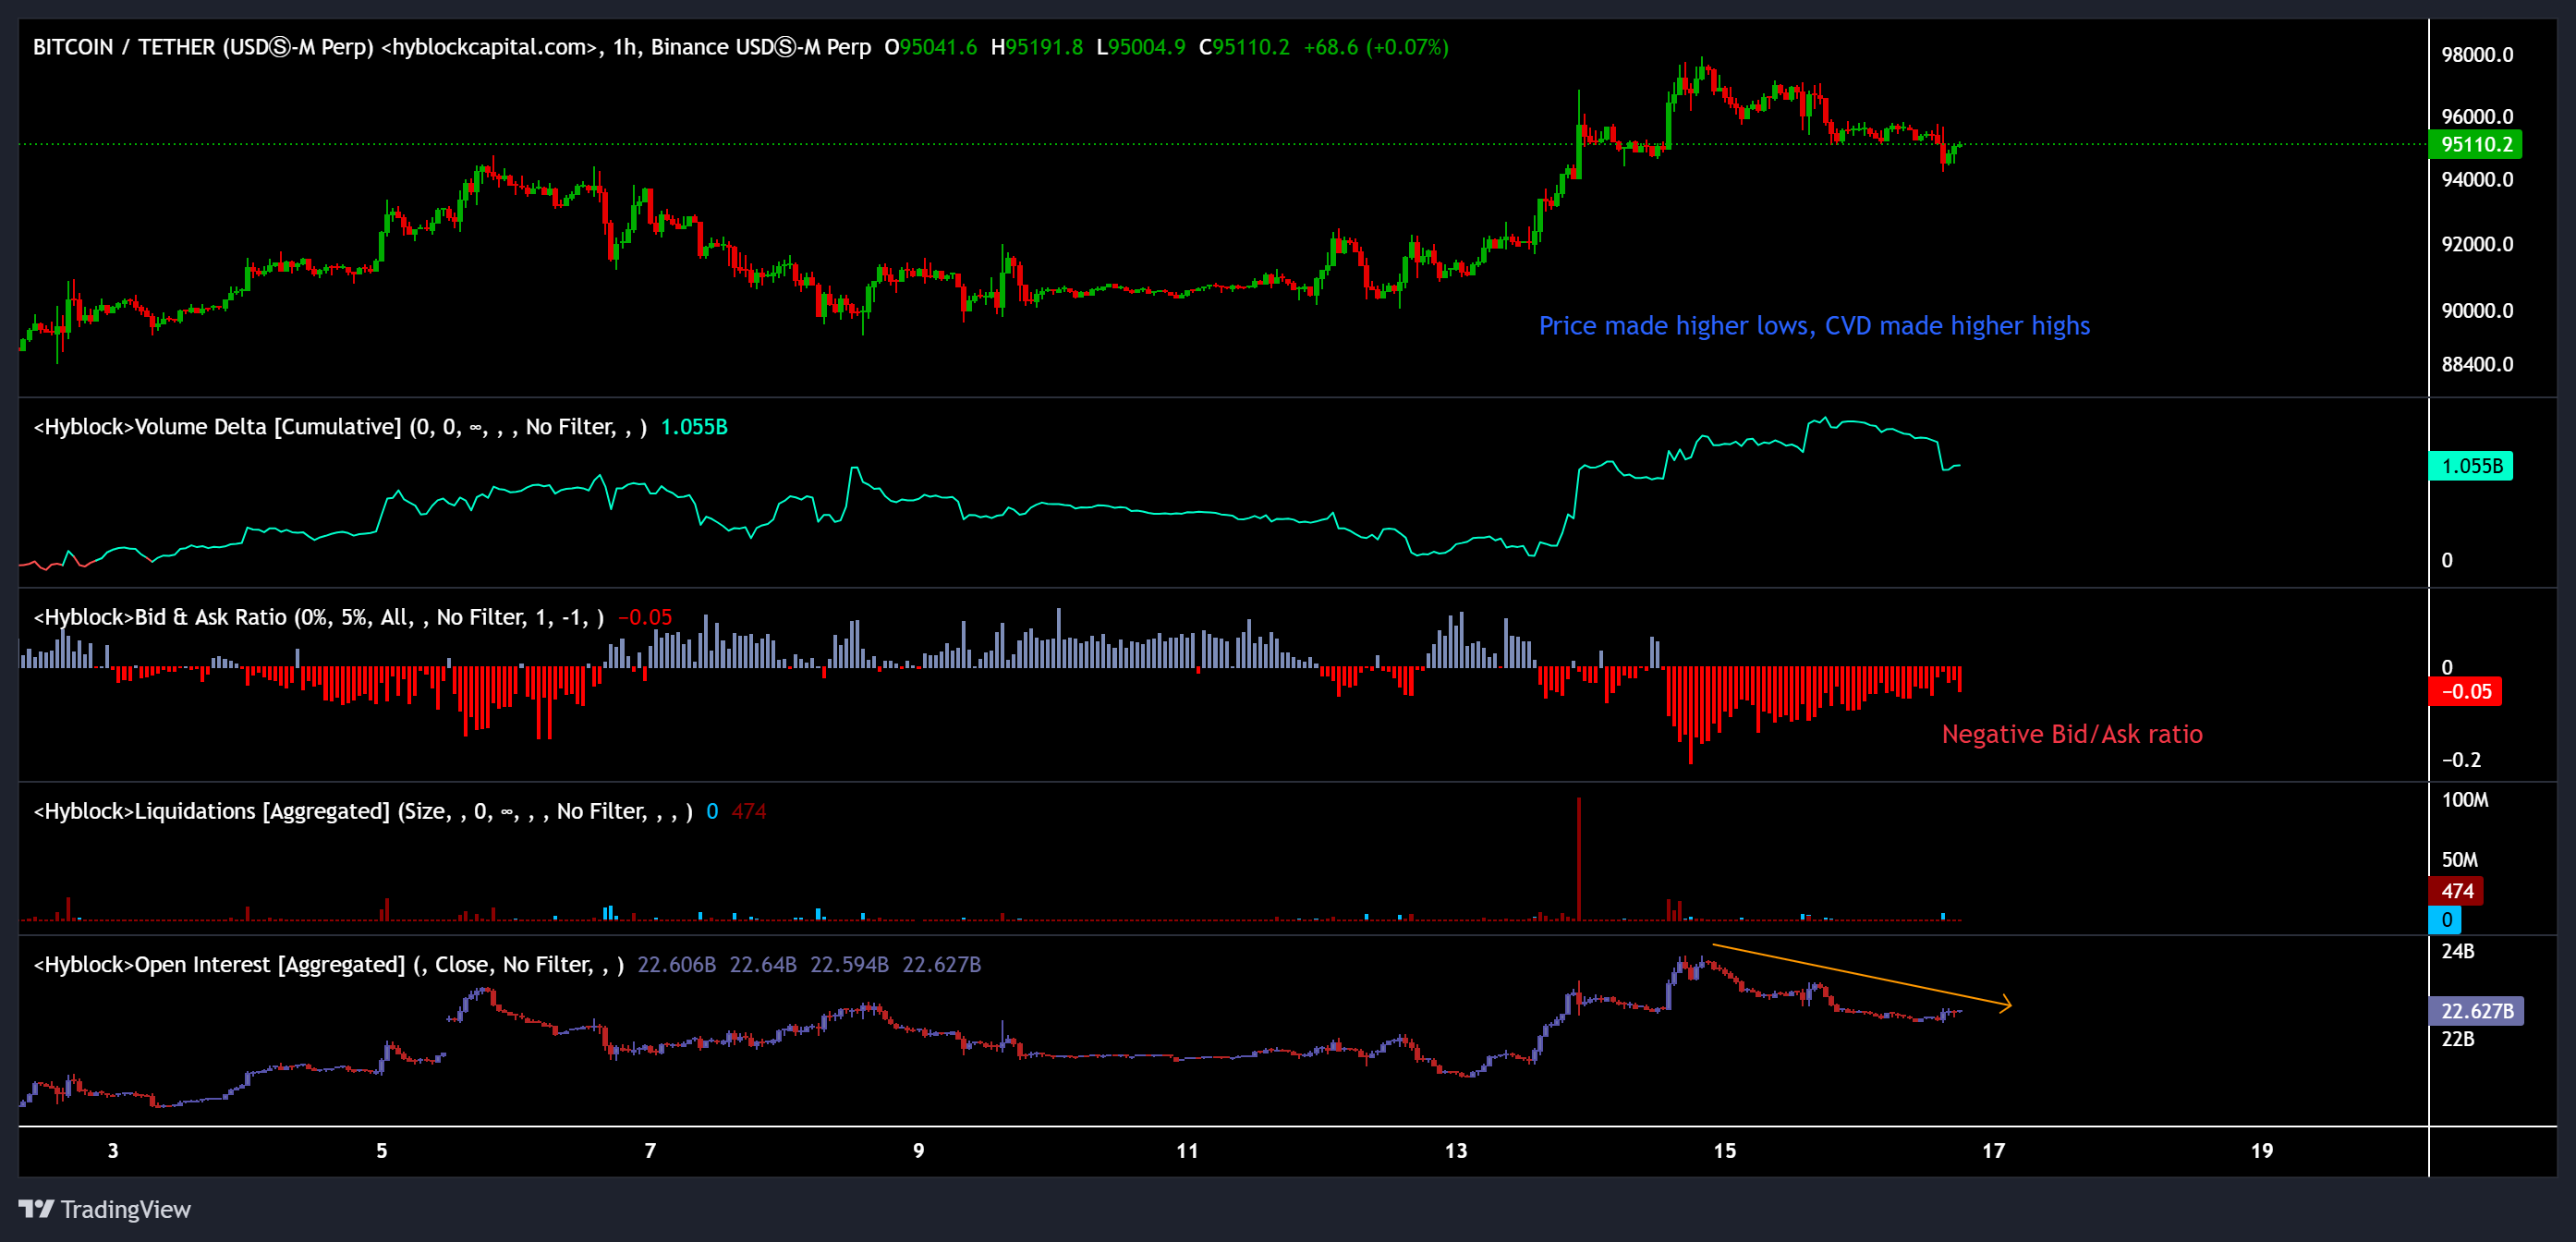
After a sharp, short liquidation, open interest also fell alongside the price. This indicates that leverage was flushed out, and new long positions were not eager to step in, reducing momentum behind the move.
Market analysis firm Material Indicators noted that bears “fought back hard,” with trend signals flipping on the daily chart. The firm warned that losing key trendlines could lead to a deeper support test, though a reclaim above $97,000 would invalidate the latest bearish signals.
Related: Bitcoin rally collapses at $97K as funding rate stalls, retail traders sit out
Short-term holders take profits near cost basis
The dip also followed clear profit-taking from short-term holders (STHs). On Jan. 6, when BTC reached $94,000, STHs sent over 30,000 BTC in profit to exchanges. That behavior repeated on Jan. 15 as the price broke above $97,000, with more than 40,000 BTC in profits realized in a single day.
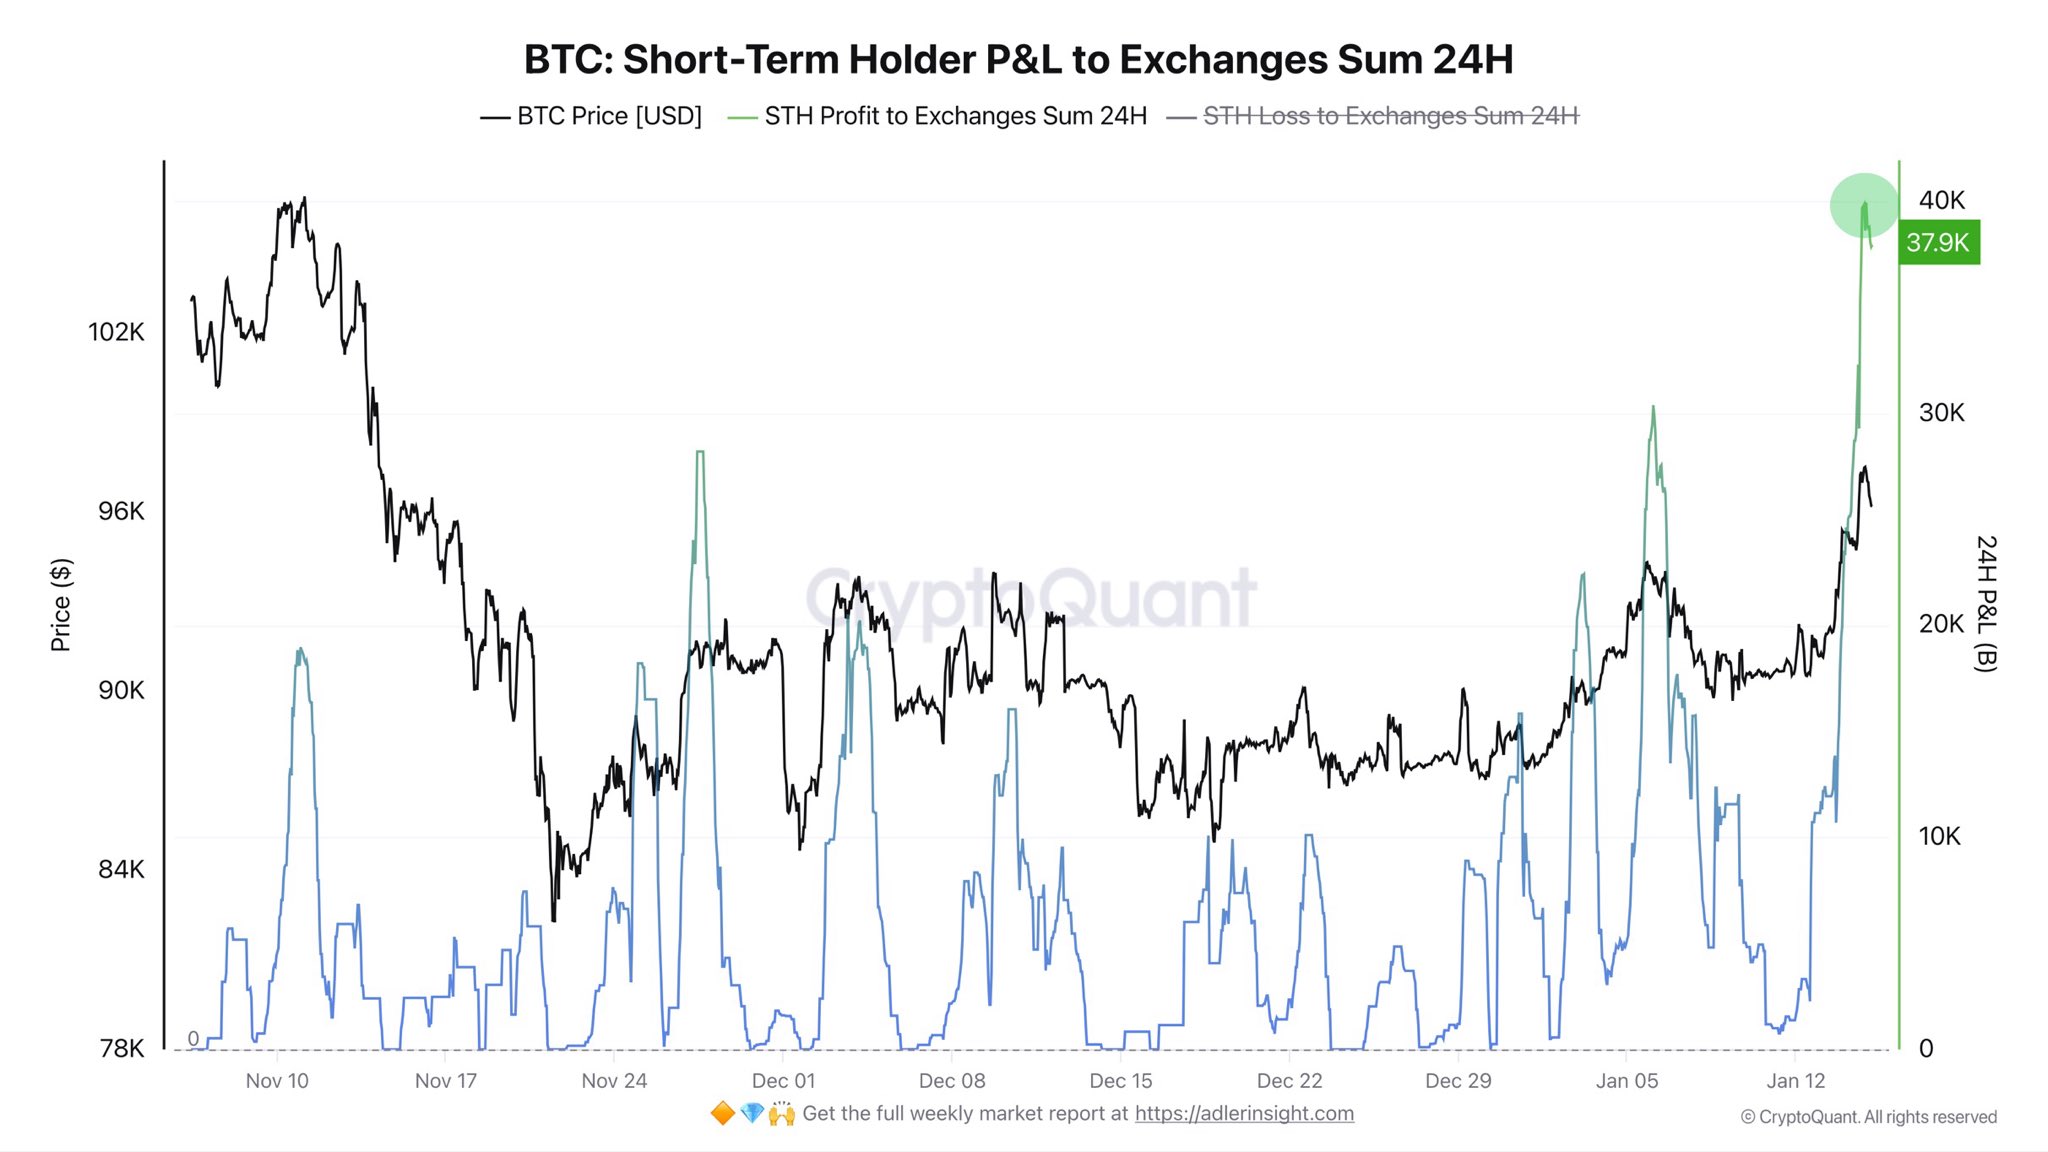
Although the STH discount has compressed from -22% to -4% over the past two months, the price stalled just below the STH cost basis near $98,300. With realized prices closer to $102,000, STH behavior suggests capital preservation remains the priority until stronger upside confirmation emerges.
Related: Bitcoin is now most undervalued versus gold: Will BTC price rebound?
This article does not contain investment advice or recommendations. Every investment and trading move involves risk, and readers should conduct their own research when making a decision. While we strive to provide accurate and timely information, Cointelegraph does not guarantee the accuracy, completeness, or reliability of any information in this article. This article may contain forward-looking statements that are subject to risks and uncertainties. Cointelegraph will not be liable for any loss or damage arising from your reliance on this information.
