


Bitcoin (BTC) fell to $80,600 on Friday, extending weekly losses to more than 10%. Its monthly drawdown has now reached 23%, the steepest decline since June 2022. The drop below $84,000 also pushed BTC to test the 100-week exponential moving average for the first time since October 2023, aligning exactly with the start of the current bull cycle.
Bitcoin futures liquidations surpassed $1 billion, underscoring the severity of this downturn, described by the Kobeissi Letter as the “fastest bear market ever.”
Key takeaways:
-
Crypto market cap has erased 33% since October, marking a rapid structural unwind.
-
A record fund outflow and negative ETF flows signal persistent institutional selling pressure.
-
A major macroeconomic liquidity indicator (NFCI) is trending lower, historically preceding BTC rallies by four to six weeks.
Crypto market cap collapses as “structural” selling accelerates
Since Oct. 6, the total crypto market cap has fallen to $2.8 trillion from $4.2 trillion, a 33% drawdown. The Kobeissi Letter called it “one of the fastest-moving crypto bear markets ever,” with selling intensifying across all major sectors. The newsletter said digital asset investment products are reflecting the same stress, with crypto funds recording $2 billion in weekly outflows, the largest since February.
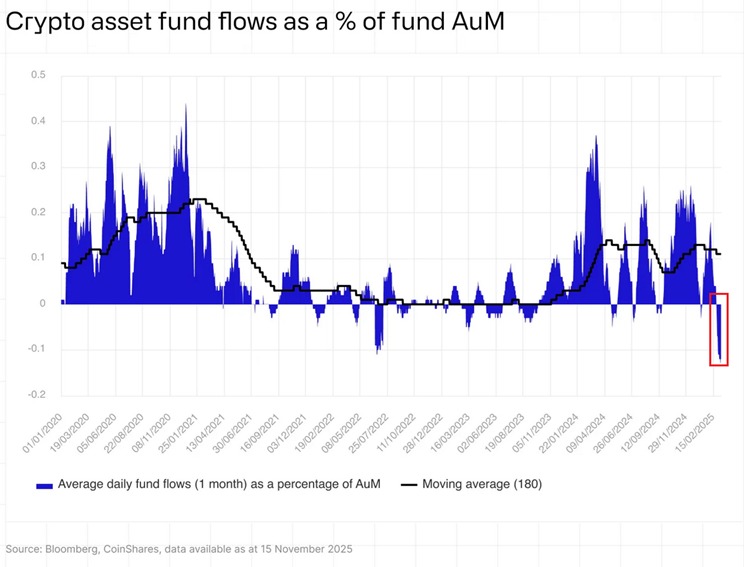
This marked the third consecutive week of net selling, resulting in total outflows of $3.2 billion over that period. Bitcoin accounted for the bulk of the withdrawals with $1.4 billion in redemptions, while Ether followed with $689 million, representing some of the biggest weekly losses either asset has seen in 2025.
Average daily outflows as a share of assets under management (AUM) hit all-time highs, dragging total AUM to $191 billion, down 27% from October. Analysts classified this as a clear structural decline, not just short-term panic.
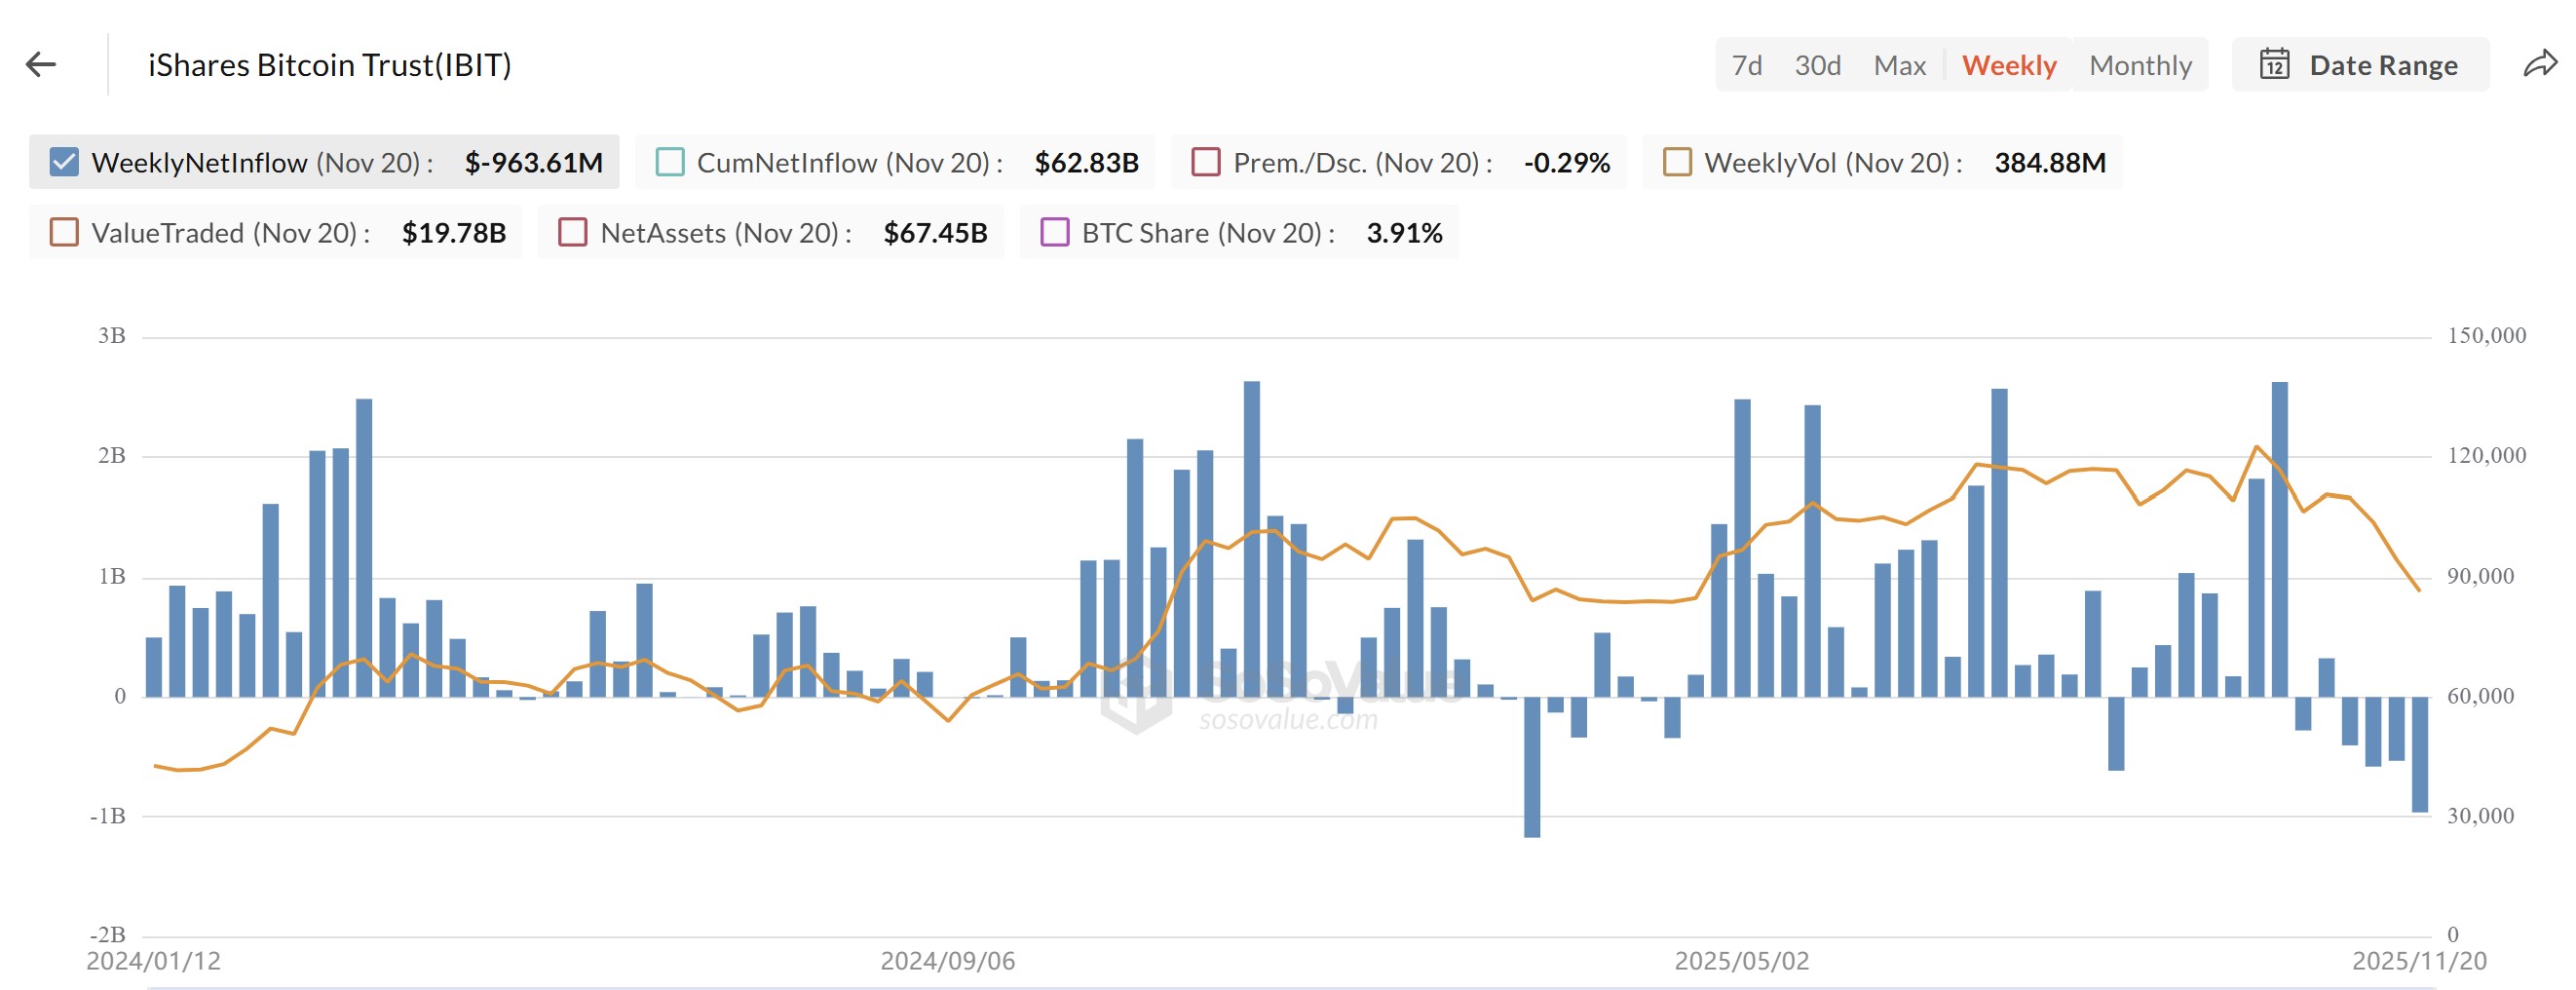
US exchange-traded fund (ETF) flows worsen the pressure. Spot BTC ETF flows remain below zero, reinforcing the sell-off. Meanwhile, BlackRock’s spot ETF is on pace for its largest weekly outflow ever, close to surpassing the $1.17 billion record from February.
Related: Bitcoin slump to $86K brings BTC closer to ‘max pain’ but great ‘discount’ zone
A macroeconomic shift could give Bitcoin a liquidity lead
While several analysts continued to call for a Bitcoin bottom based on technical charts and onchain data, Miad Kasravi took a different approach. Kasravi carried out a decade-long backtest of 105 financial indicators, indicating that the National Financial Conditions Index (NFCI) is one of the few metrics that reliably leads Bitcoin by four to six weeks during major macroeconomic regime shifts.
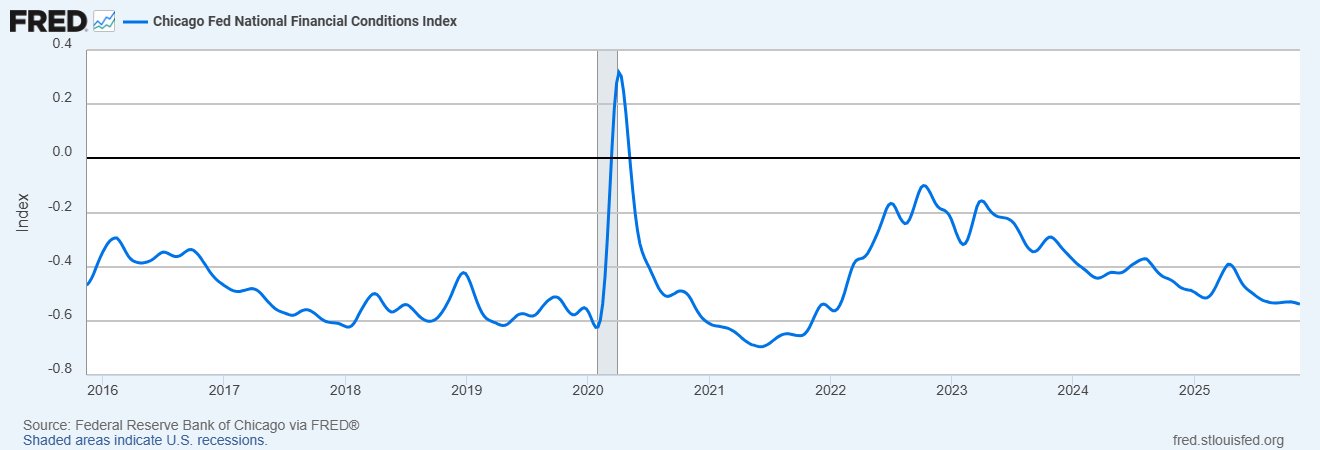
This dynamic was evident in October 2022, when easing financial conditions preceded a 94% rally, and again in July 2024, when tightening conditions signaled stress several weeks before Bitcoin surged from $50,000 to $107,000.
At the moment, NFCI sits at -0.52 and is trending lower. Historically, every 0.10 point decline in the index has aligned with roughly 15%–20% upside in Bitcoin, with a deeper move toward -0.60 typically marking an acceleration phase. December also introduces a key catalyst: the Federal Reserve’s plan to rotate mortgage-backed securities into Treasury bills.
Kasravi noted that although it is not labeled Quantitative Easing (QE), the operation could inject liquidity in a similar way to the 2019 “not-QE” event that preceded a 40% Bitcoin rally.
If the NFCI continues to decline into mid-December, it would signal the early stages of a new liquidity expansion window. Based on the index’s consistent four-to–six week lead time during past regime shifts, Bitcoin’s next major cyclical move would align with early to mid-December 2025, offering a potentially significant inflection point for market participants tracking macroeconomic conditions.
Related: Bitcoin realized losses rise to FTX crash levels: Where is the bottom?
This article does not contain investment advice or recommendations. Every investment and trading move involves risk, and readers should conduct their own research when making a decision.
