


Bitcoin (BTC) slid to eight-day lows on Tuesday as macro headwinds gave bulls new headaches.
Key points:
-
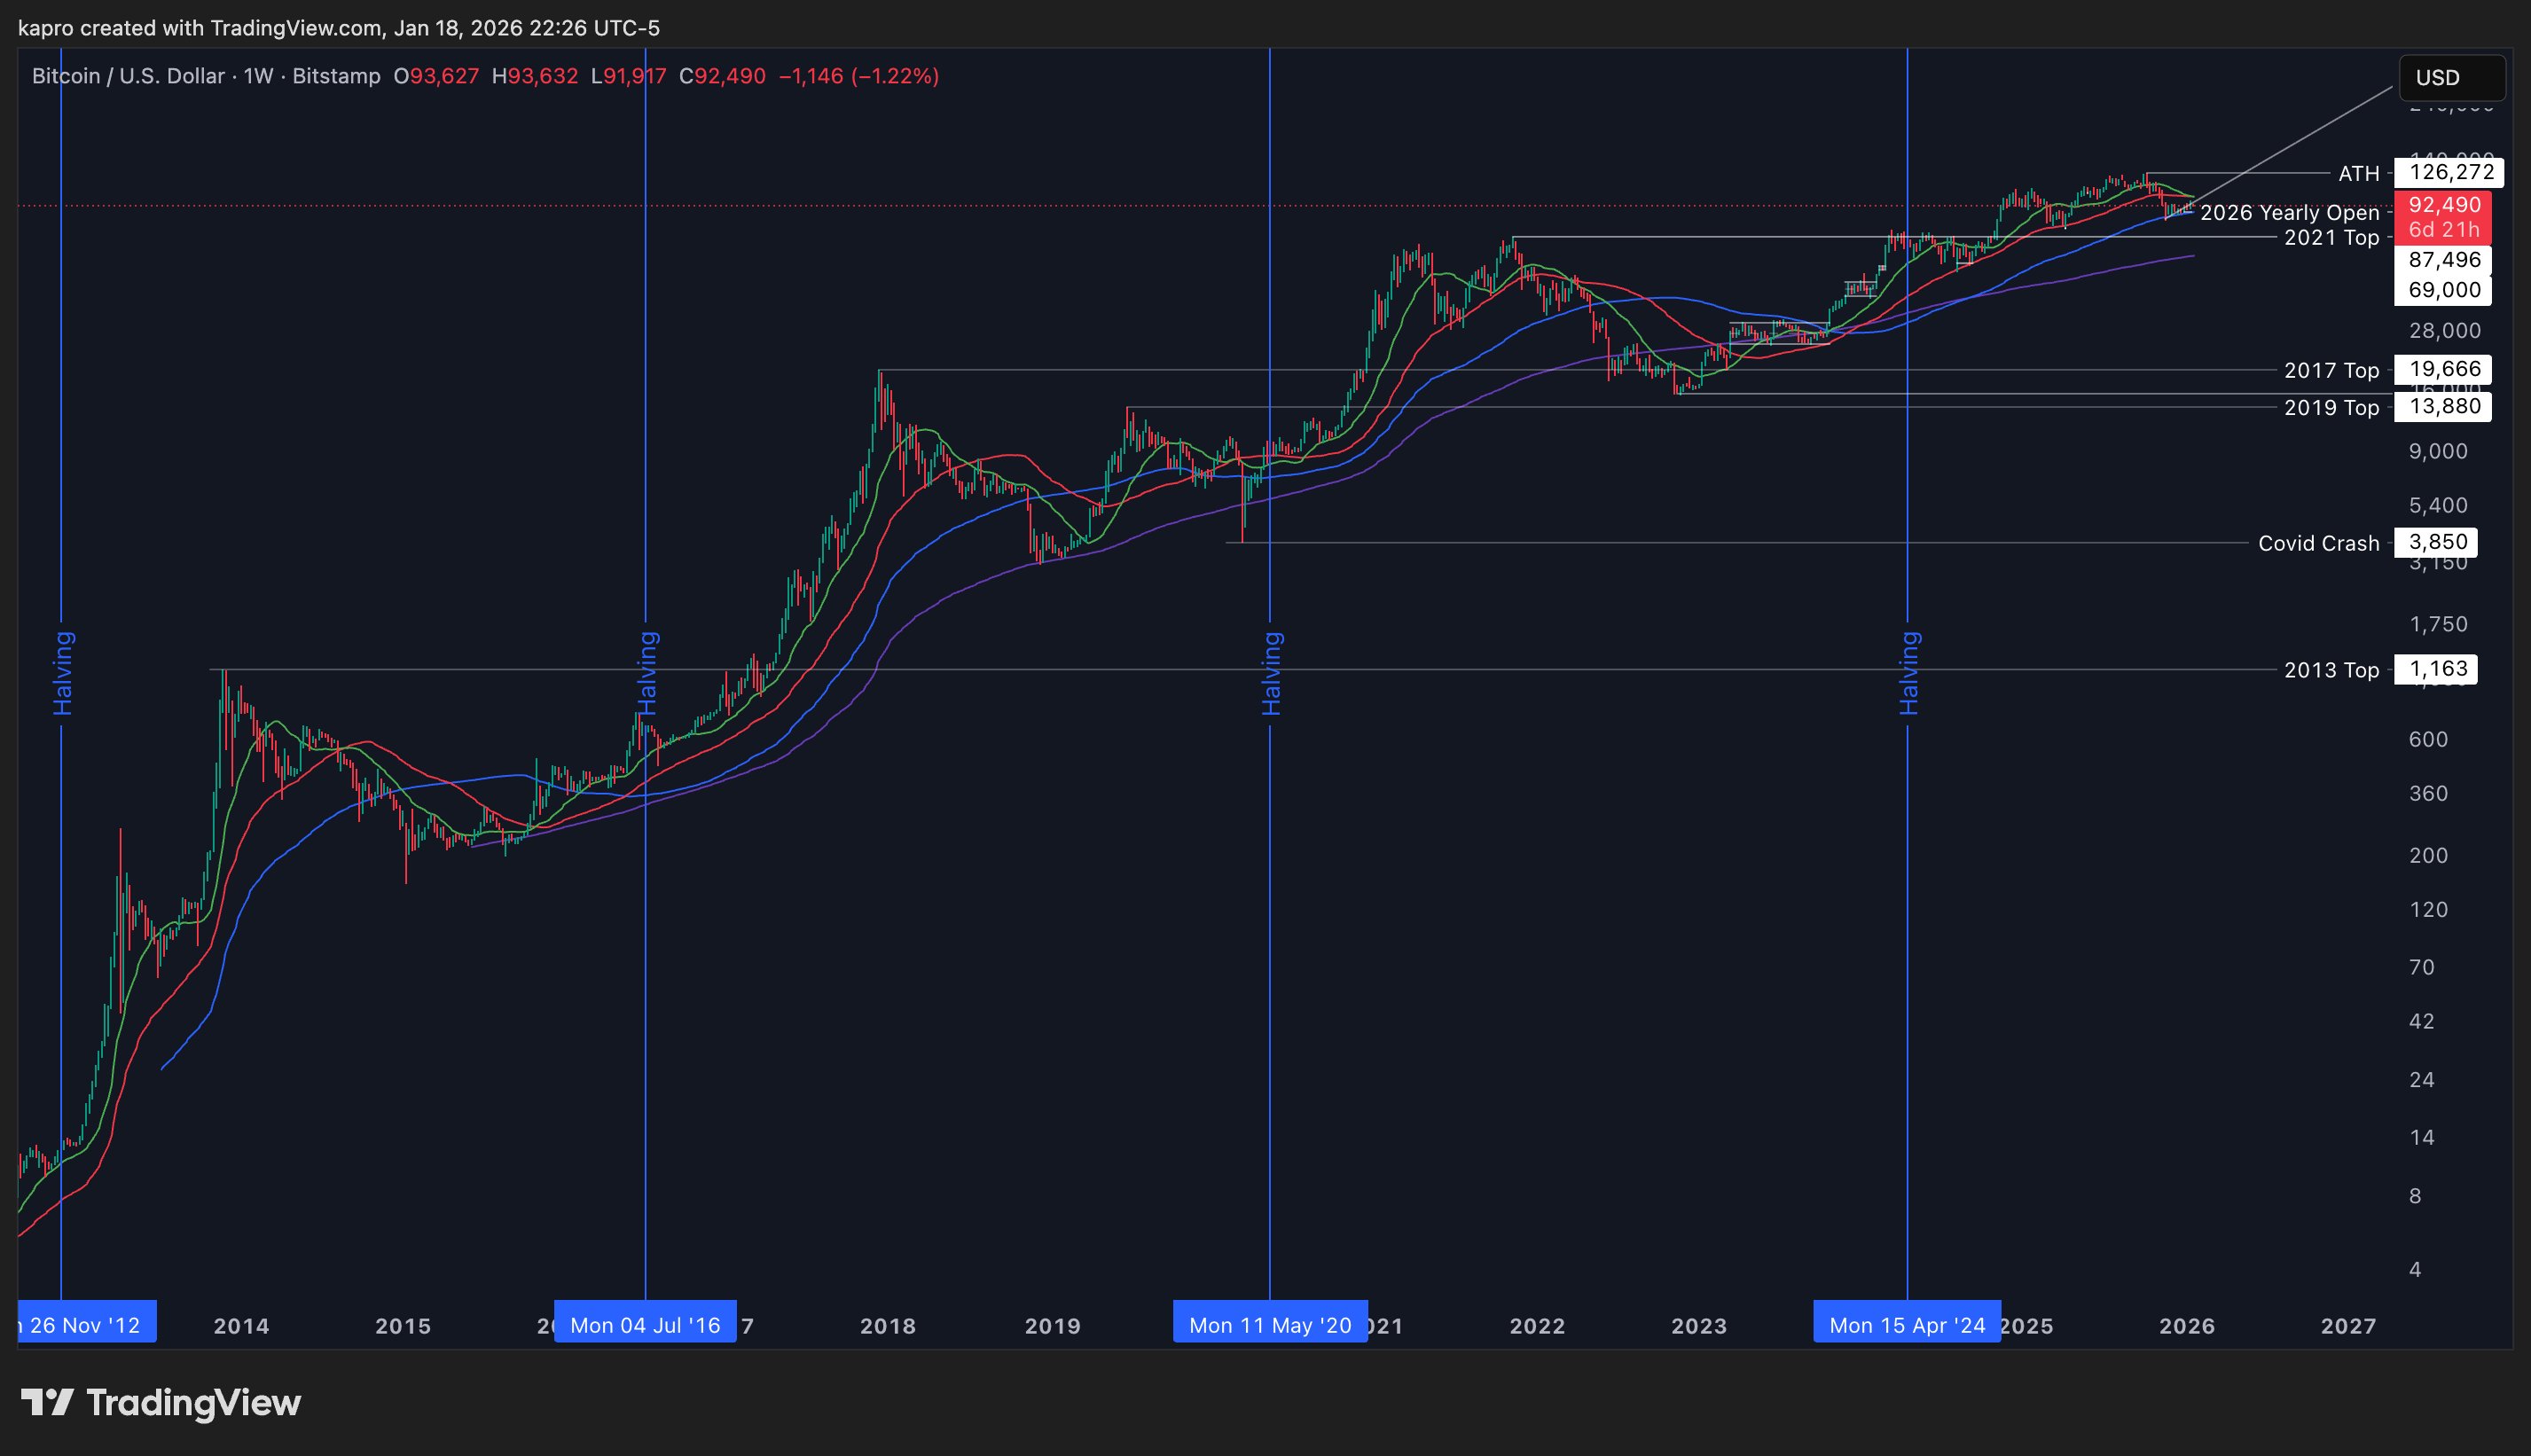
Bitcoin toys with the 2025 and 2026 yearly opens after a “failed” breakout from its multimonth range.
-
Current BTC price weakness is not a result of the macro environment, analysis says.
-
Targets for Bitcoin include a comedown to 15-month lows.
Bitcoin “breakout failed” as $90,000 looms
Data from TradingView showed BTC price action retargeting $90,000 prior to the week’s first Wall Street trading session.
This was tipped to be volatile thanks to a potent combination of geopolitical and macroeconomic forces, chief among which was the reemergence of the US-EU trade war, thanks to the former’s plans for Greenland.
With tariffs back on the cards, risk assets suffered while precious metals hit new all-time highs as traders sought safe havens.
“Now fully back into the ~$84K-$94K range it has spend the past 2 months in already,” trader Daan Crypto Trades summarized in his latest analysis on X.
“Breakout failed and doesn’t make for a pretty look now.”
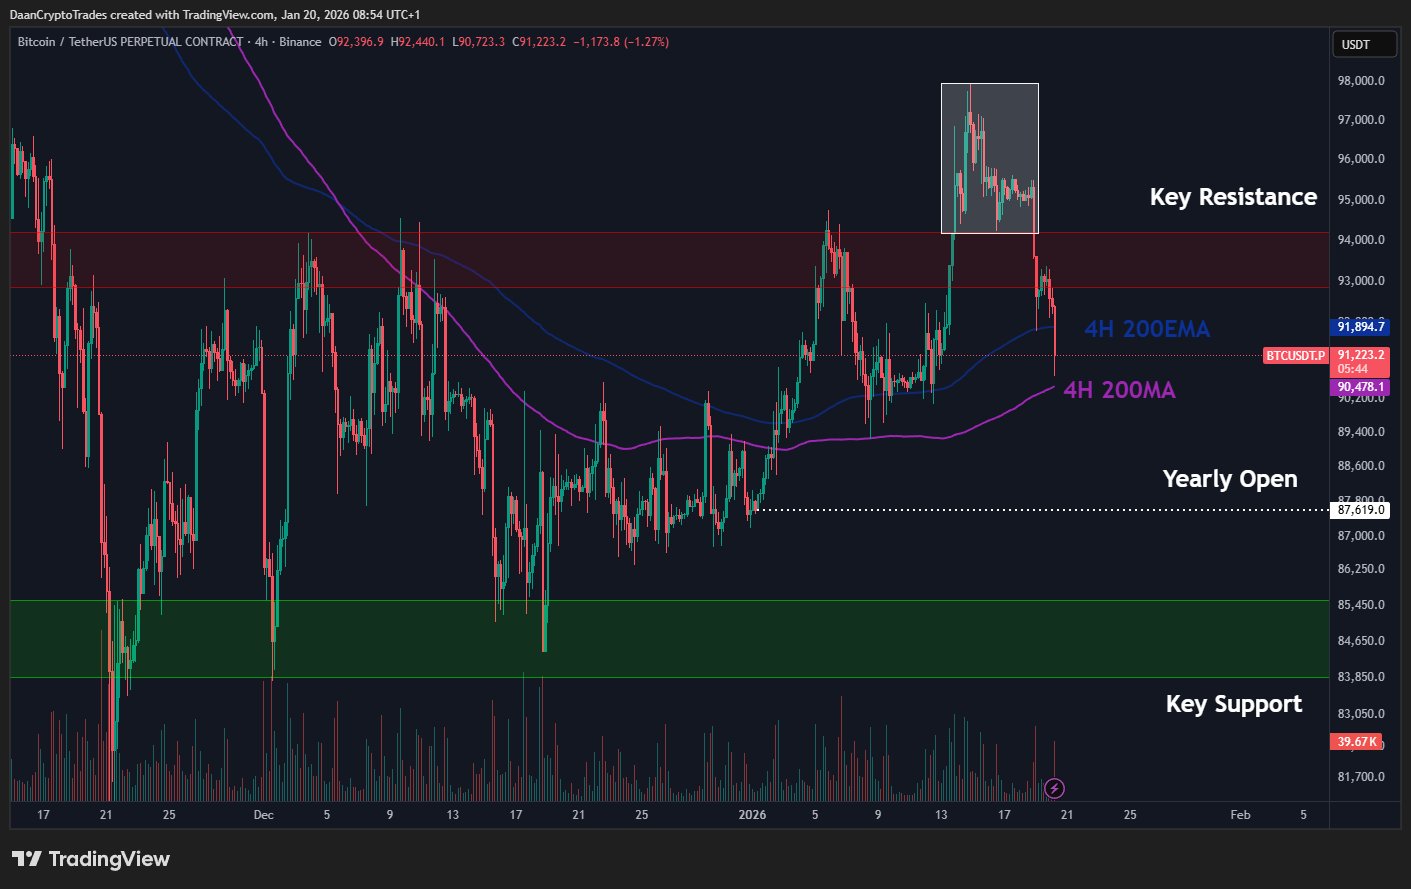
An accompanying chart showed price sliding through its 200-period simple (SMA) and exponential (EMA) moving averages on four-hour timeframes.
For Daan Crypto Trades, the 2026 yearly open near $87,000 was now of interest as a potential support level.
“Been talking about that yearly open likely being taken out at some point as it’s rare to see no wick below on the yearly candle. So better get that out of the way sooner than later if you ask me. Still just observing as I don’t see any reason to trade this chop,” he told X followers.
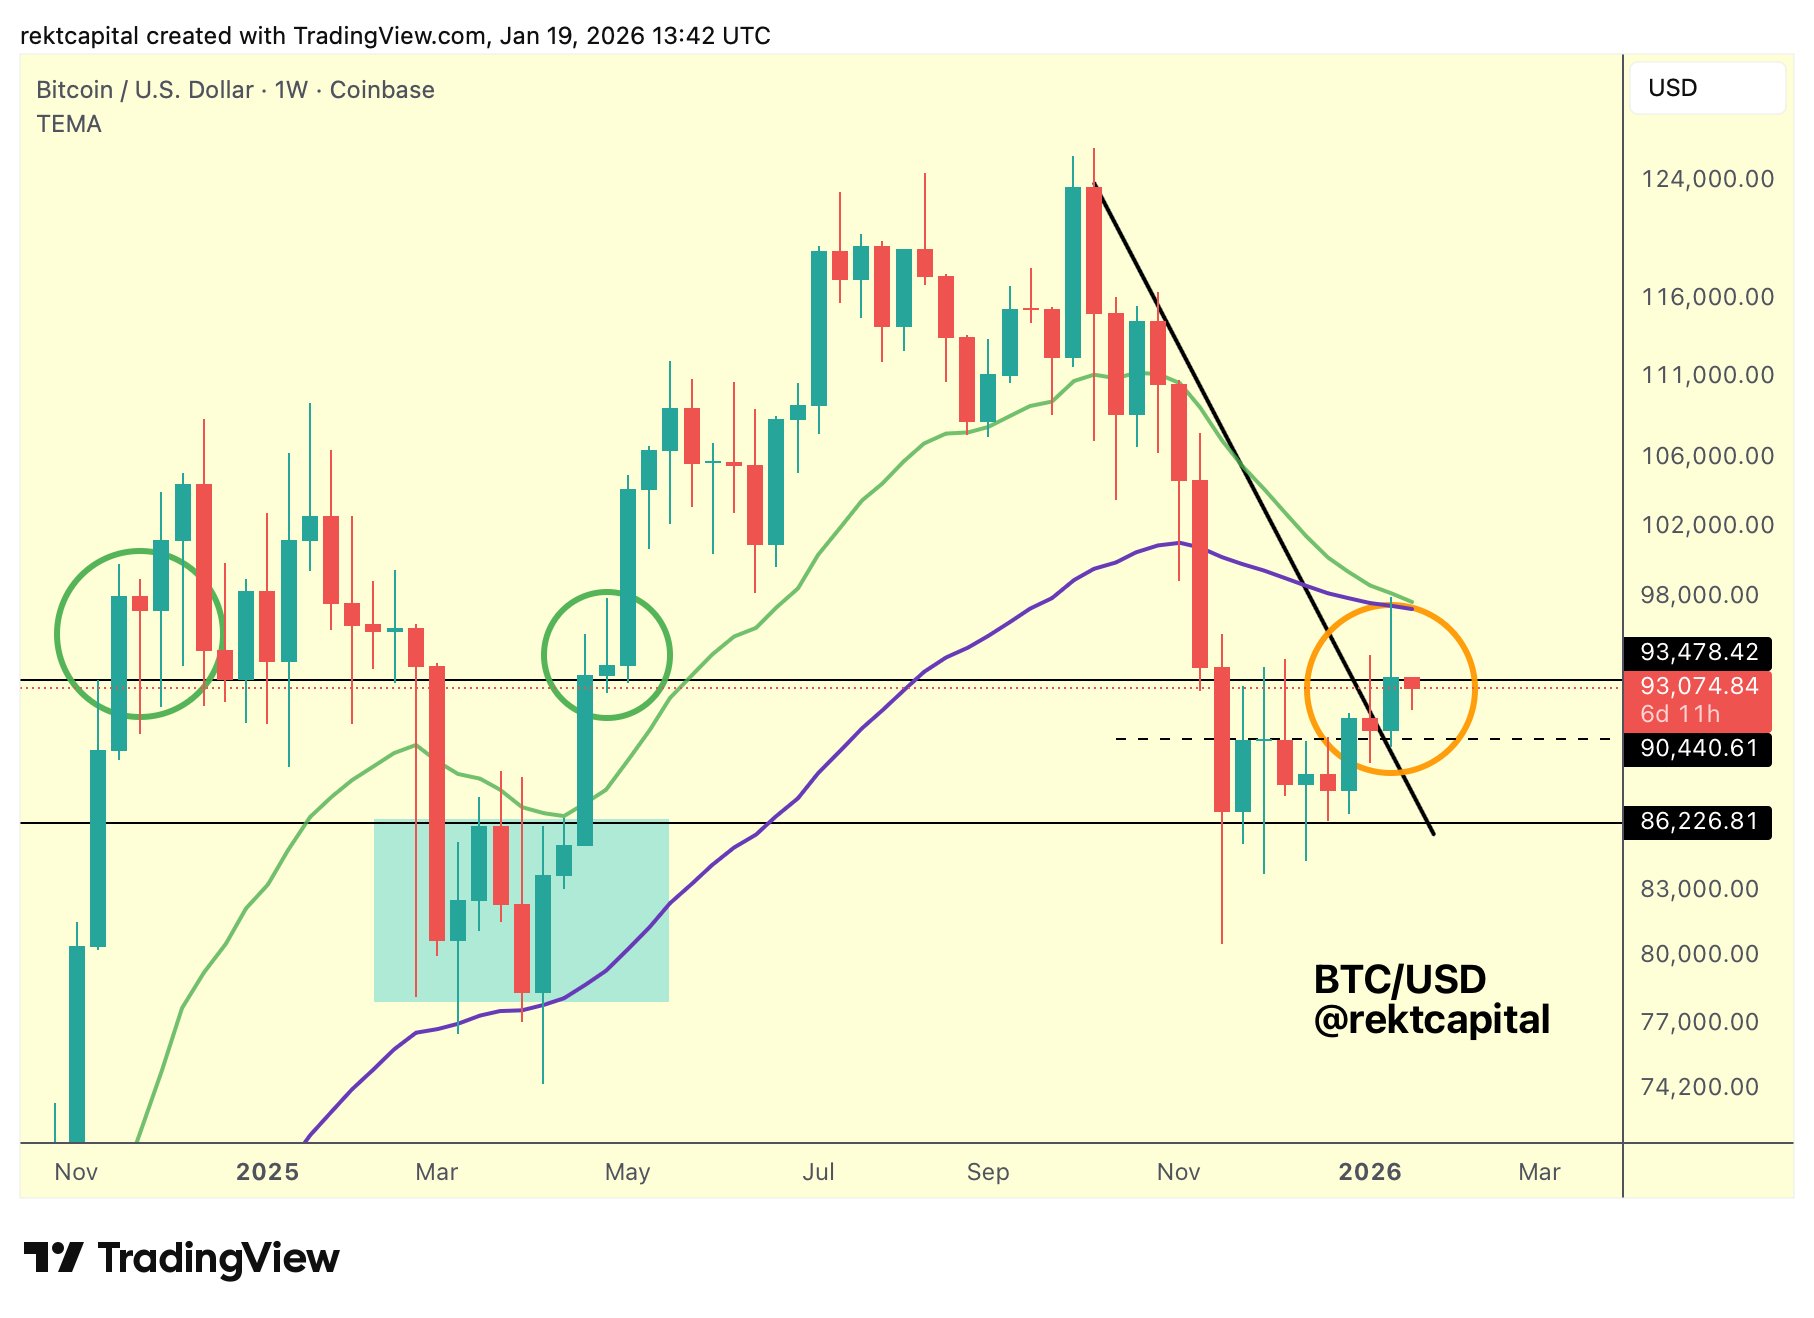
Trader and analyst Rekt Capital, meanwhile, focused on the 2025 yearly open at $93,500 — a level that was of key importance for the weekly chart.
“In fact, Bitcoin has marginally Weekly Closed above $93500, therefore resembling more the April 2025 Weekly Close above $93500 than the November 2024 one (both green circles),” he wrote Monday alongside an explanatory chart.
“Bitcoin will need to find a way to reclaim $93500 throughout the week to ensure this becomes a successful retest to confirm the breakout from the Weekly Range (black-black).”
Back to $58,000 for BTC price?
Exchange order-book data showed signs of panic on the day, with liquidations hitting $360 million in the 24 hours to the time of writing, per data from CoinGlass.
Related: BTC vs. new $80K ‘liquidity grab’: Five things to know in Bitcoin this week
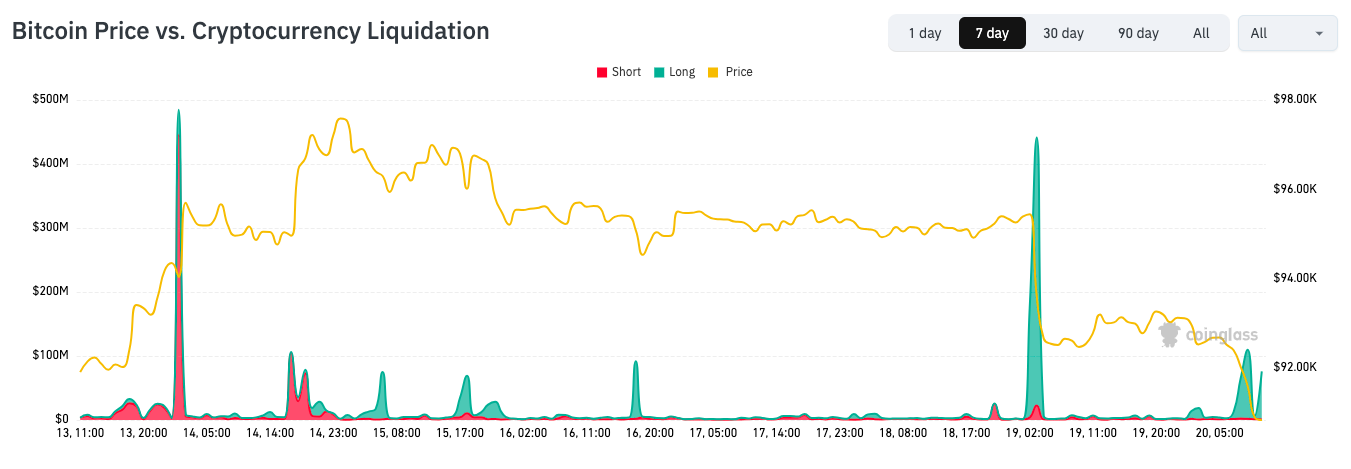
Overnight Sunday, liquidations spiked as US futures markets opened to news of fresh trade-war fears.
Despite the macro timing, however, Keith Alan, cofounder of trading resource Material Indicators, argued that the writing had been on the wall for Bitcoin bulls.
“If you were caught off guard by the Bitcoin selloff, you simply haven’t been paying attention to the right things. This move had nothing to do with narratives. We’ve seen it developing in the charts, and have been talking about it for over a month,” an X post stated after the futures open.
Alan pointed to a so-called “death cross” involving the 21-week and 50-week SMAs — something that in the past has “always led to a macro bottom.”
The cross occurs when the falling 21-period trendline crosses under the 50-period equivalent. Alan added that he was looking at the 100-week SMA for a bounce, which is now at $86,900.
Even more downbeat was veteran trader Peter Brandt, who eyed a retreat below the $60,000 mark.
The last time that BTC/USD traded at that level was in October 2024.
58k to $62k is where I think it is going $BTC
If it does not go there I will NOT be ashamed, so I do not need to see you trolls screen shot this in the future
I am wrong 50% of the time. It does not bother me to be wrong pic.twitter.com/NDOuSrqLwa— Peter Brandt (@PeterLBrandt) January 19, 2026
This article does not contain investment advice or recommendations. Every investment and trading move involves risk, and readers should conduct their own research when making a decision. While we strive to provide accurate and timely information, Cointelegraph does not guarantee the accuracy, completeness, or reliability of any information in this article. This article may contain forward-looking statements that are subject to risks and uncertainties. Cointelegraph will not be liable for any loss or damage arising from your reliance on this information.
