


Key takeaways:
-
Bitcoin’s death cross, which previously led to 64%-77% BTC price declines, has flashed again.
-
Mounting selling pressure is prompting many investors to sell their BTC holdings at a loss.
Bitcoin (BTC) may have confirmed its entry into a bear market after the price dropped to $80,000 on Friday. This view is reinforced by a convergence of technical indicators that have historically preceded extended declines.
Bitcoin’s macro uptrend was invalidated
The BTC/USD pair closed below its 50-week moving average on Sunday, a level crypto analyst Rekt Capital has been closely watching, saying that the “price will need to reclaim it promptly on a relief rally to protect the structure.”
It’s going to get complicated for Bitcoin to maintain bullish market structure if it performs a Weekly Close below the 50-week EMA later today
If the Weekly Close indeed occurs below the 50 EMA, price will need to try reclaim it promptly on a relief rally to protect the… https://t.co/kxqpfUXC91 pic.twitter.com/SNp1Lxj0Dx
— Rekt Capital (@rektcapital) November 16, 2025
“Bitcoin wasn’t able to reclaim the 50-week EMA,” the analyst said in a Friday post on X, adding:
“Bullish market structures are invalidated when the macro trend shifts.”
Rekt Capital was referring to Bitcoin’s drop below key support lines, even as the price slid below the 100-week moving average to reach a six-month low of $80,500 on Friday.
Related: Bitcoin slump to $86K brings BTC closer to ‘max pain’ but great ‘discount’ zone
Meanwhile, the price confirmed a “death cross” on its daily chart at the end of last week, a technical pattern that has previously preceded significant price declines.
On Nov. 16, Bitcoin’s 50-day simple moving average (SMA) crossed below its 200-day SMA for the first time since January 2024, forming a death cross.
“Every Bitcoin cycle has ended with a Death Cross,” said analyst Mister Crypto in an X analysis on Monday, asking:
“Why would this time be different?”
In January 2022, the death cross was followed by a 64% BTC price drop, bottoming at $15,500, fueled by the FTX collapse.
March 2018 and September 2014 saw 67% and 71% declines in BTC price, respectively, after painting similar SMA crossovers.
As Cointelegraph reported, Bitcoin’s SuperTrend indicator also sent a bearish signal on the weekly chart, an occurrence that has historically marked the start of a bear market.
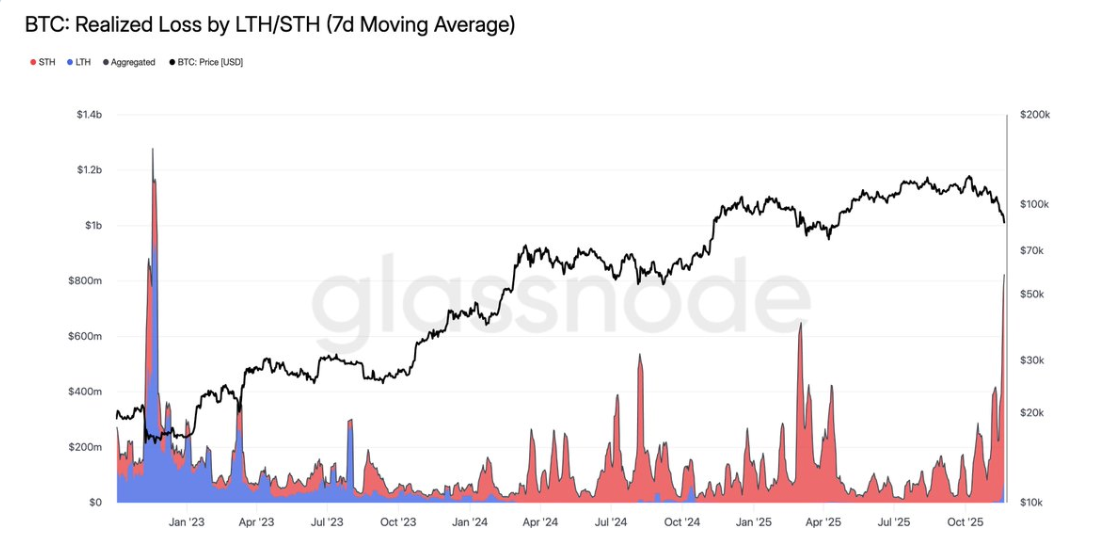
Bitcoin realized losses surpassed $800 million
With increasing selling pressure by the hour, the volume of realized losses has risen to levels not seen since the 2022 FTX collapse.
Onchain data provider Glassnode shared a chart showing that Bitcoin’s aggregate realized losses by both short-term and long-term holders have surged to areas above $800 million on a seven-day rolling basis. The $800 million mark was last crossed in November 2022.
“Short-term holders are driving the bulk of the capitulation,” Glassnode said, adding:
“The scale and speed of these losses reflect a meaningful washout of marginaBitcoin realized loss.ers unwind into the drawdown.”
Sharing a similar perspective, CryptoQuant analyst IT Tech said that short-term selling “often marks a local bottom if the price quickly reclaims the cost basis,” adding:
“Failing to do so historically indicates a deeper bearish trend or confirms a bear market.”
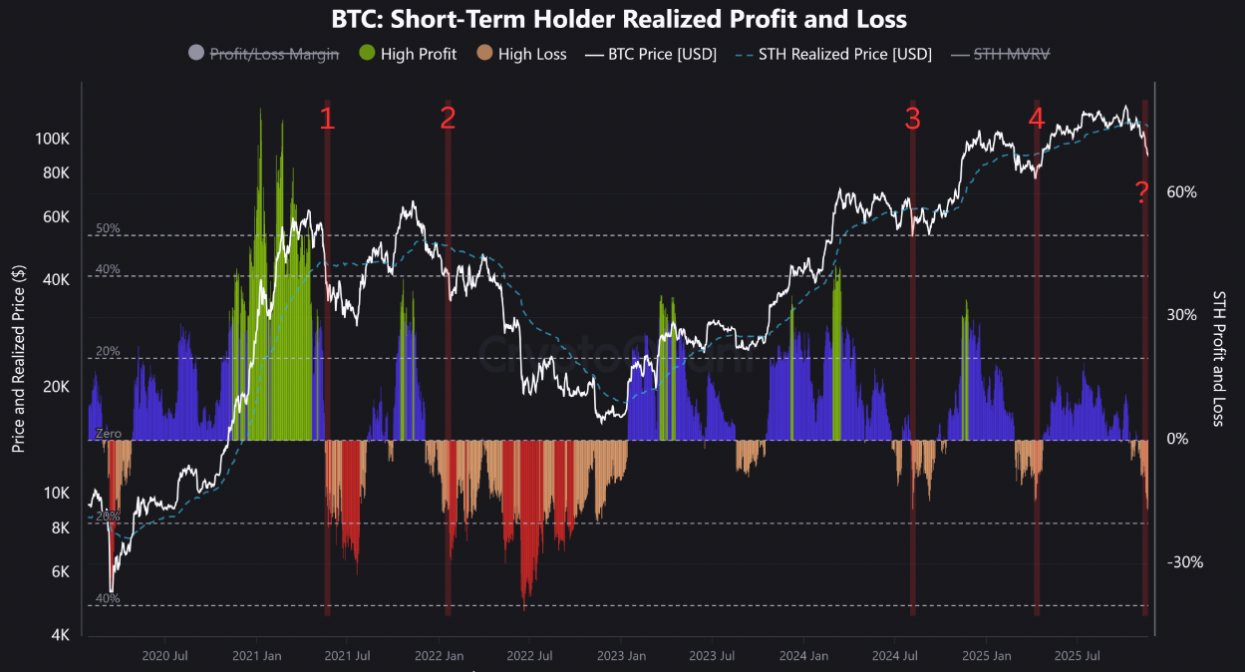
As Cointelegraph reported, short-term holders have been panic-selling their Bitcoin holdings at a loss, adding fuel to analysts’ predictions that the BTC price will extend its downtrend toward its April bottom of $74,500.
This article does not contain investment advice or recommendations. Every investment and trading move involves risk, and readers should conduct their own research when making a decision.
