


Key points:
-
Bitcoin’s break below $84,000 tilts the advantage in favor of the bears, opening the doors for a potential fall to $74,508.
-
Several major altcoins have slipped below their support levels, signaling that the bears are attempting to take charge.
Bitcoin (BTC) remains under pressure as sellers attempt to sustain the price below the $84,000 level. BTC’s fall near $81,000 caused $1.77 billion in liquidations in the past 24 hours, per CoinGlass data.
Several analysts have turned bearish and expect BTC’s downtrend to continue. They anticipate BTC to fall below the crucial $74,500 low, made in April 2025, following US President Donald Trump’s “Liberation Day” tariff announcement.
However, not everyone is bearish on BTC. Swyftx lead analyst Pav Hundal told Cointelegraph that BTC may form a bottom over the next 40 days if history repeats, as BTC bottoms “have historically lagged gold’s relative strength by about 14 months.”
Could BTC and the major altcoins start a relief rally? Let’s analyze the charts of the top 10 cryptocurrencies to find out.
Bitcoin price prediction
BTC turned down sharply from the 20-day exponential moving average (EMA) ($89,165) on Thursday and fell below the $84,000 support.
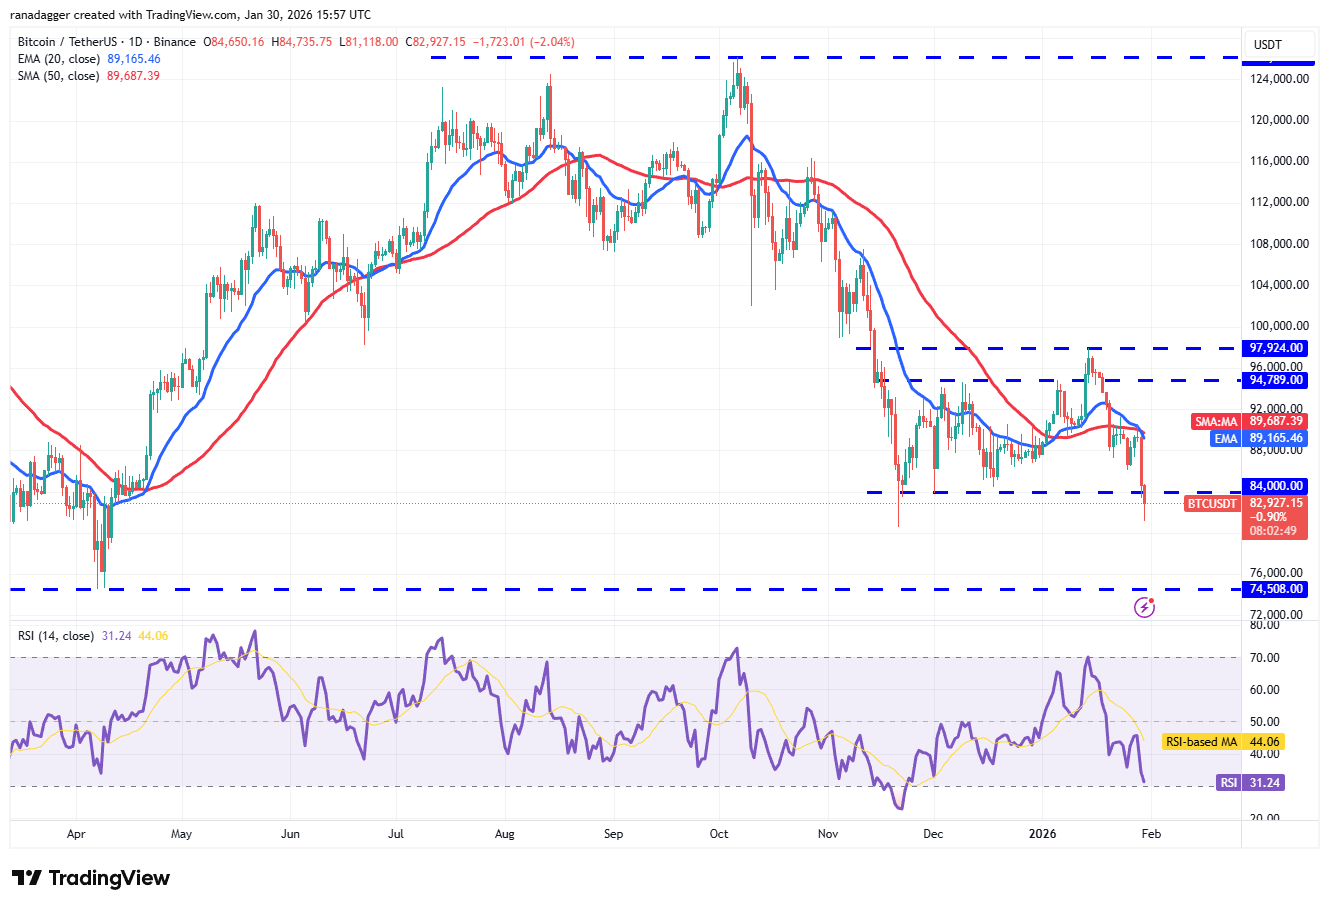
The $80,600 level is the crucial support to watch out for in the near term. If bears pull the Bitcoin price below $80,600, the BTC/USDT pair may extend the decline to the critical support at $74,508.
Buyers are likely to have other plans. They will attempt to defend the $80,600 level and push the price above the moving averages. If they do that, it shows that the market has rejected the dip below $84,000. The pair may then surge to the $94,789 to $97,924 resistance zone.
Ether price prediction
Ether (ETH) turned down from the moving averages on Thursday and fell below the $2,787 level, indicating selling on minor rallies.
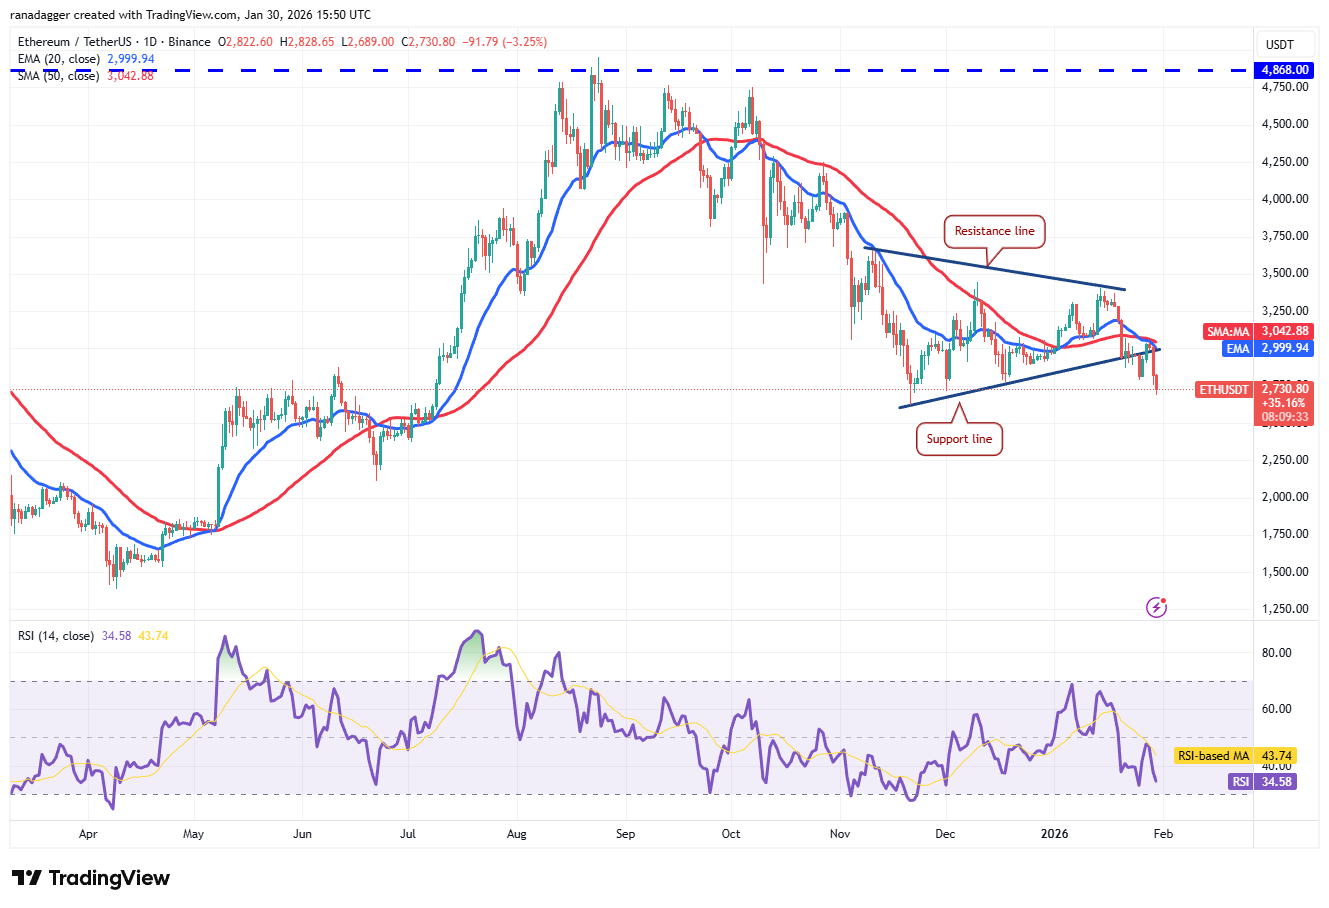
The downsloping 20-day EMA ($2,999) and the relative strength index (RSI) in negative territory indicate an advantage to sellers. The Ether price may slump to the $2,623 level, which is likely to attract buyers. However, if the bears prevail, the ETH/USDT pair is likely to resume the downtrend toward $2,111.
Time is running out for the bulls. They will have to swiftly push the ETH/USDT pair above the moving averages to signal strength. The pair may then climb to the resistance line.
BNB price prediction
The failure of the bulls to maintain BNB (BNB) above the 20-day EMA ($890) on Thursday triggered selling, which has pulled the price to the uptrend line.
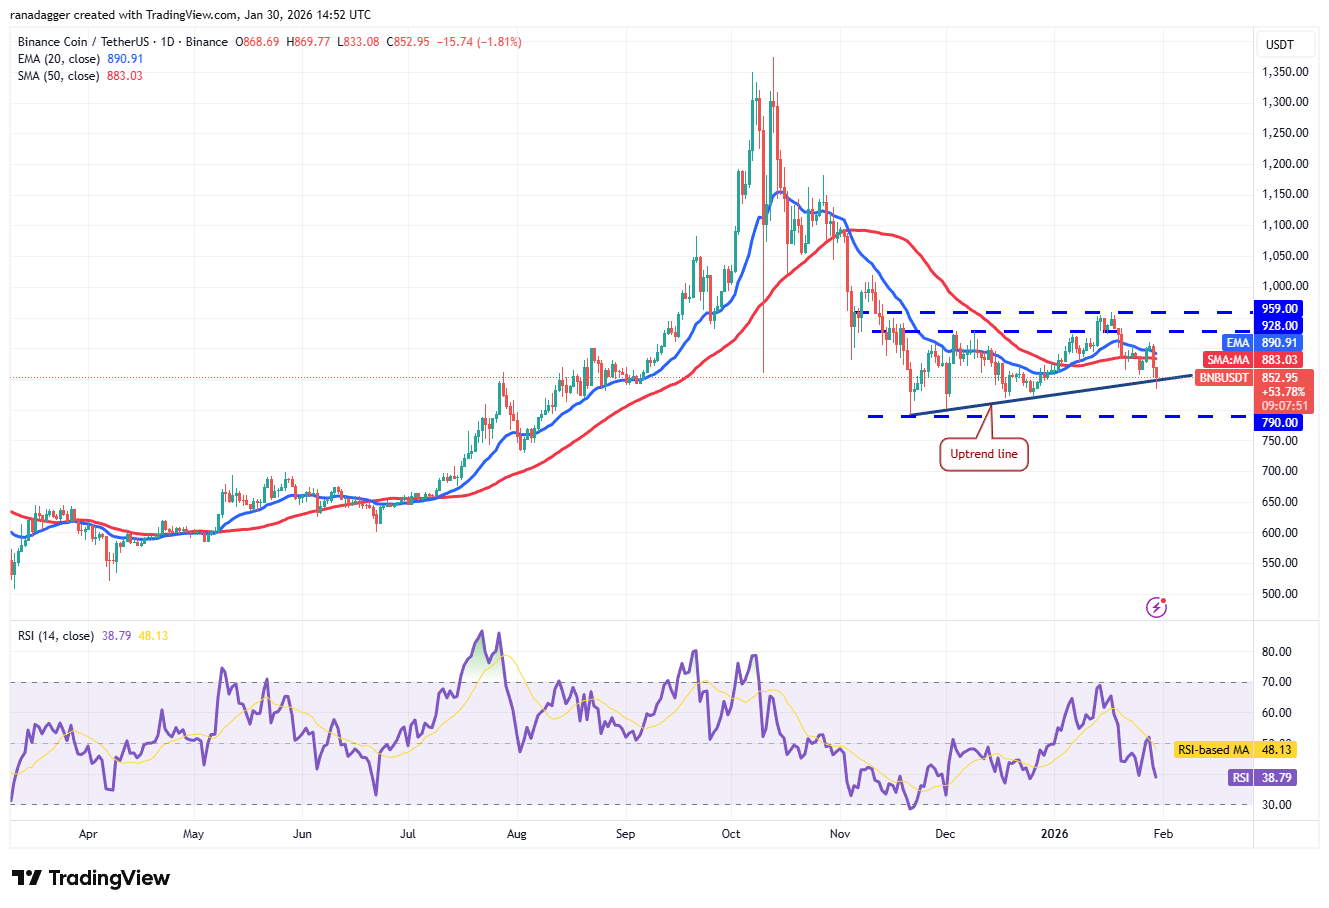
The bulls are expected to vigorously defend the uptrend line, as a close below it may sink the BNB/USDT pair to the $790 level. A break and close below the $790 support risks starting the next leg of the downtrend to $730.
Contrarily, if the BNB price turns up from the uptrend line, it suggests that the bulls remain buyers on dips. The pair may then reach the $928 to $959 overhead resistance zone, where the bears are expected to step in.
XRP price prediction
XRP (XRP) turned down from the moving averages and fell below the $1.77 level, indicating that the bears remain in control.
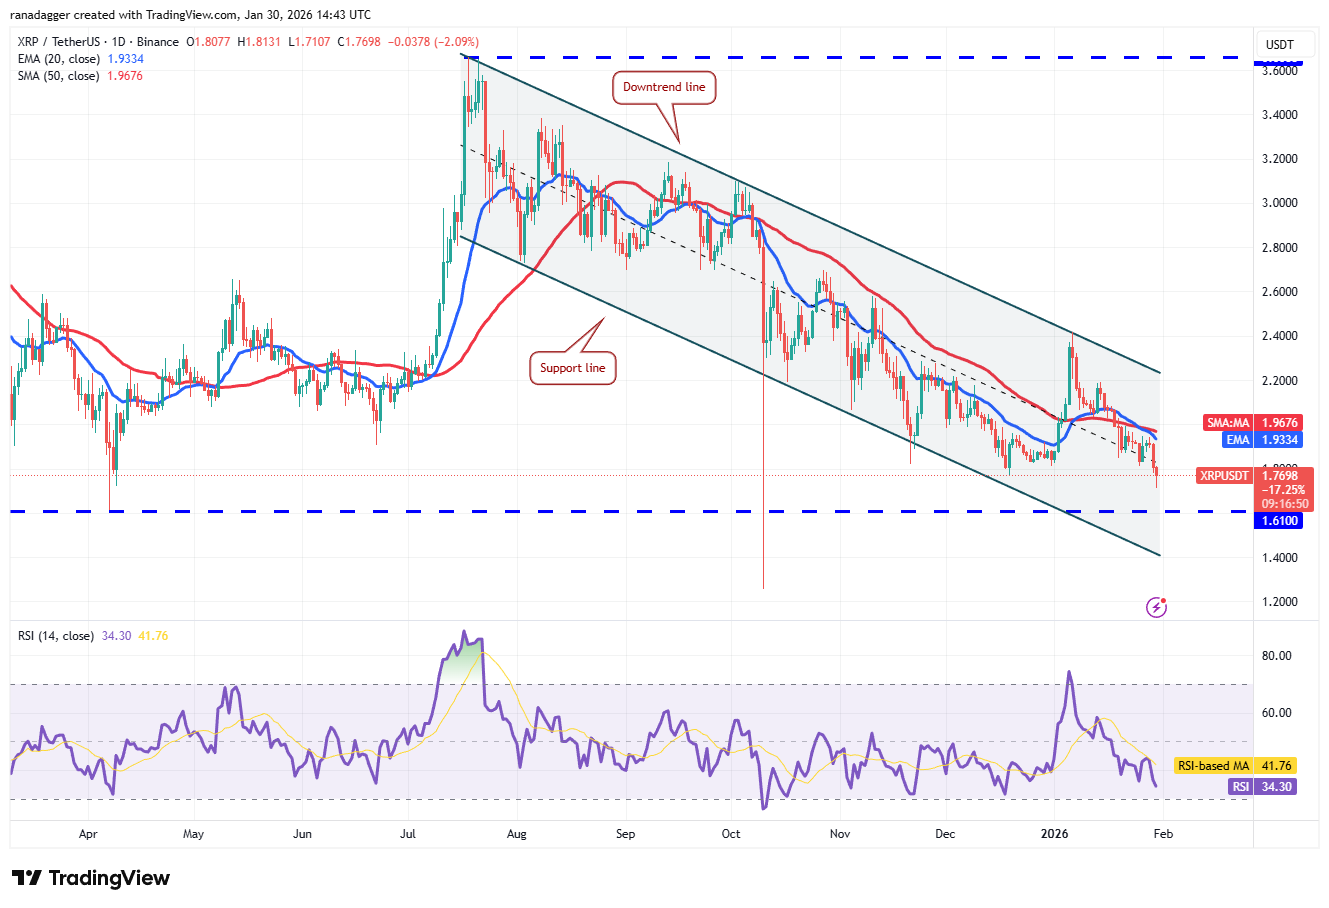
The XRP/USDT pair is likely to descend to $1.61, which is a critical level to watch out for. If sellers yank the XRP price below the $1.61 support, the pair risks falling to the support line of the descending channel pattern.
Instead, if the price turns up from $1.61, it is expected to face selling at the moving averages. If buyers overcome the hurdle, the pair may reach the downtrend line. A close above the downtrend line suggests that the bulls are back in the driver’s seat.
Solana price prediction
Solana’s (SOL) range-bound action from $117 to $147 resolved to the downside on Thursday, signaling that the bears are attempting to take charge.
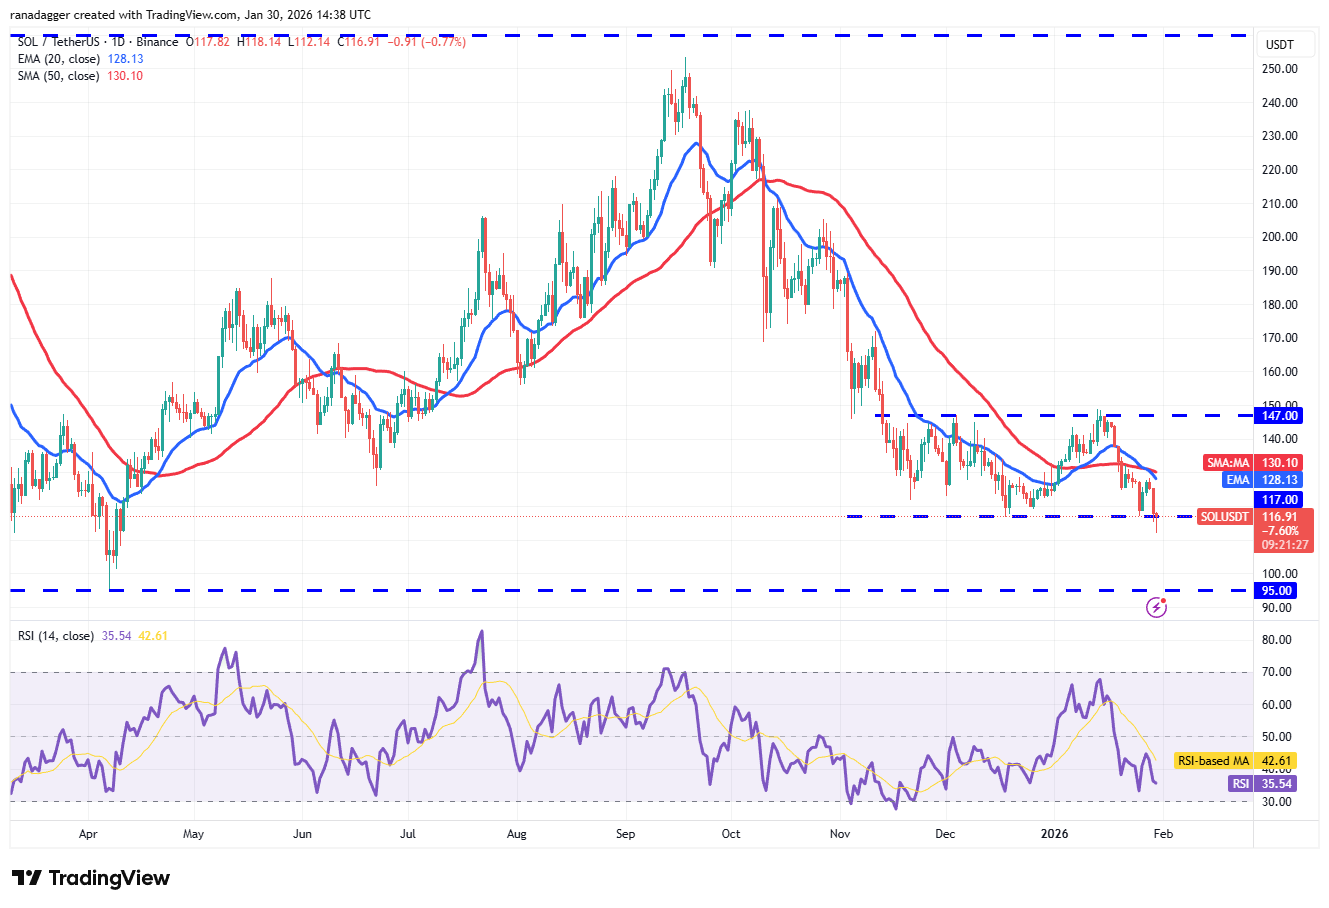
If the Solana price closes below $117, the SOL/USDT pair risks falling to the $95 support. Buyers are expected to mount a strong defense at the $95 level, as a break below it may sink the pair to $79.
The bulls will have to push the price back above the moving averages to suggest that the break below $117 may have been a bear trap. The pair may then ascend to the $147 resistance.
Dogecoin price prediction
Dogecoin (DOGE) closed below the $0.12 support on Thursday, signaling the resumption of the downtrend.
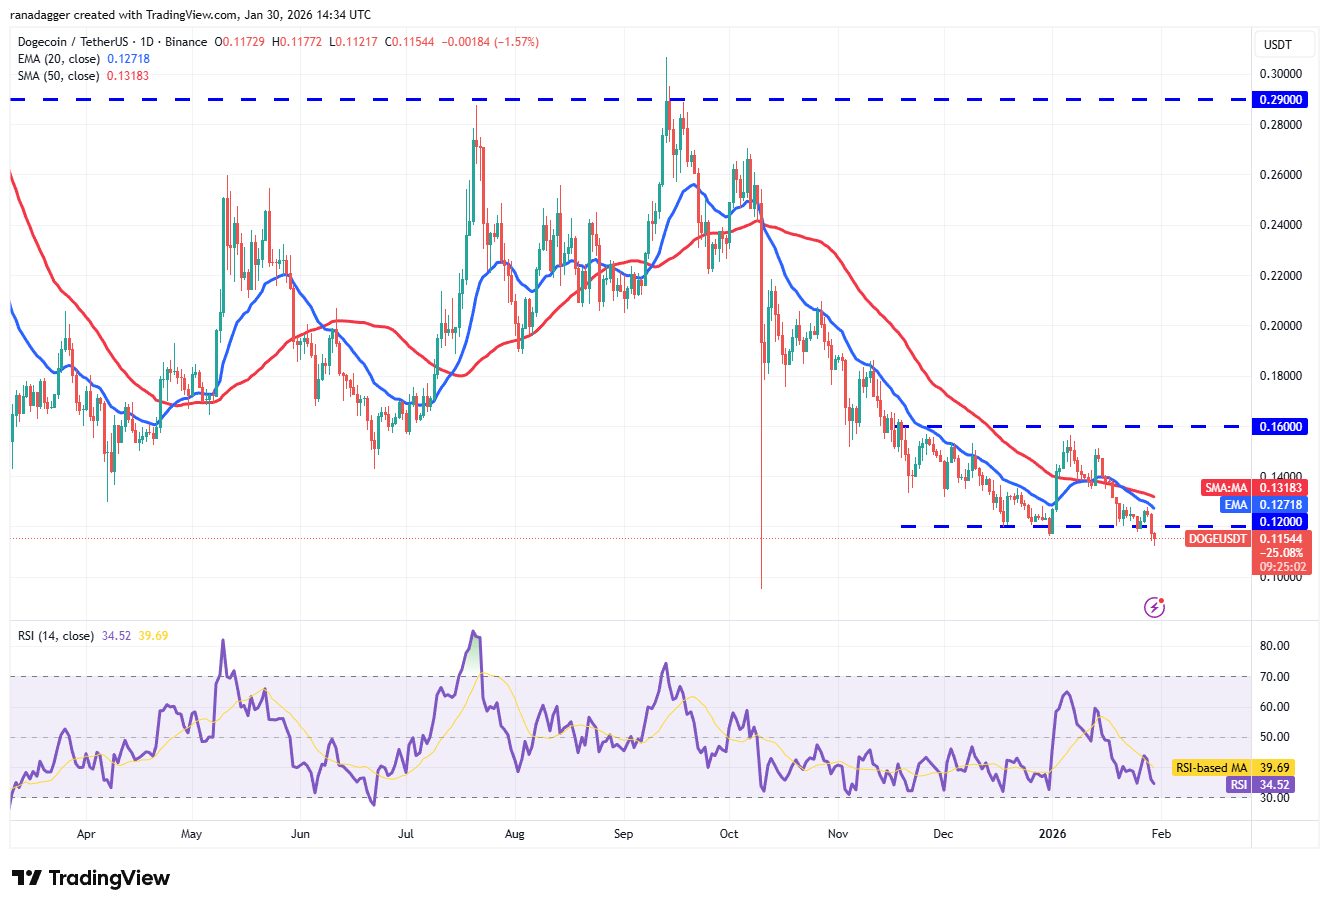
The bulls will attempt to push the Dogecoin price back above the breakdown level of $0.12 but are expected to face solid resistance from the bears. If the price turns down from the $0.12 level or the moving averages, it heightens the risk of a collapse to the Oct. 10, 2025, low of $0.10.
This negative view will be invalidated in the near term if the DOGE/USDT pair turns up and breaks above the moving averages. That suggests solid buying at lower levels, opening the gates for a potential rally to $0.16.
Cardano price prediction
Cardano (ADA) is witnessing a tough battle between the buyers and sellers at the $0.33 level.
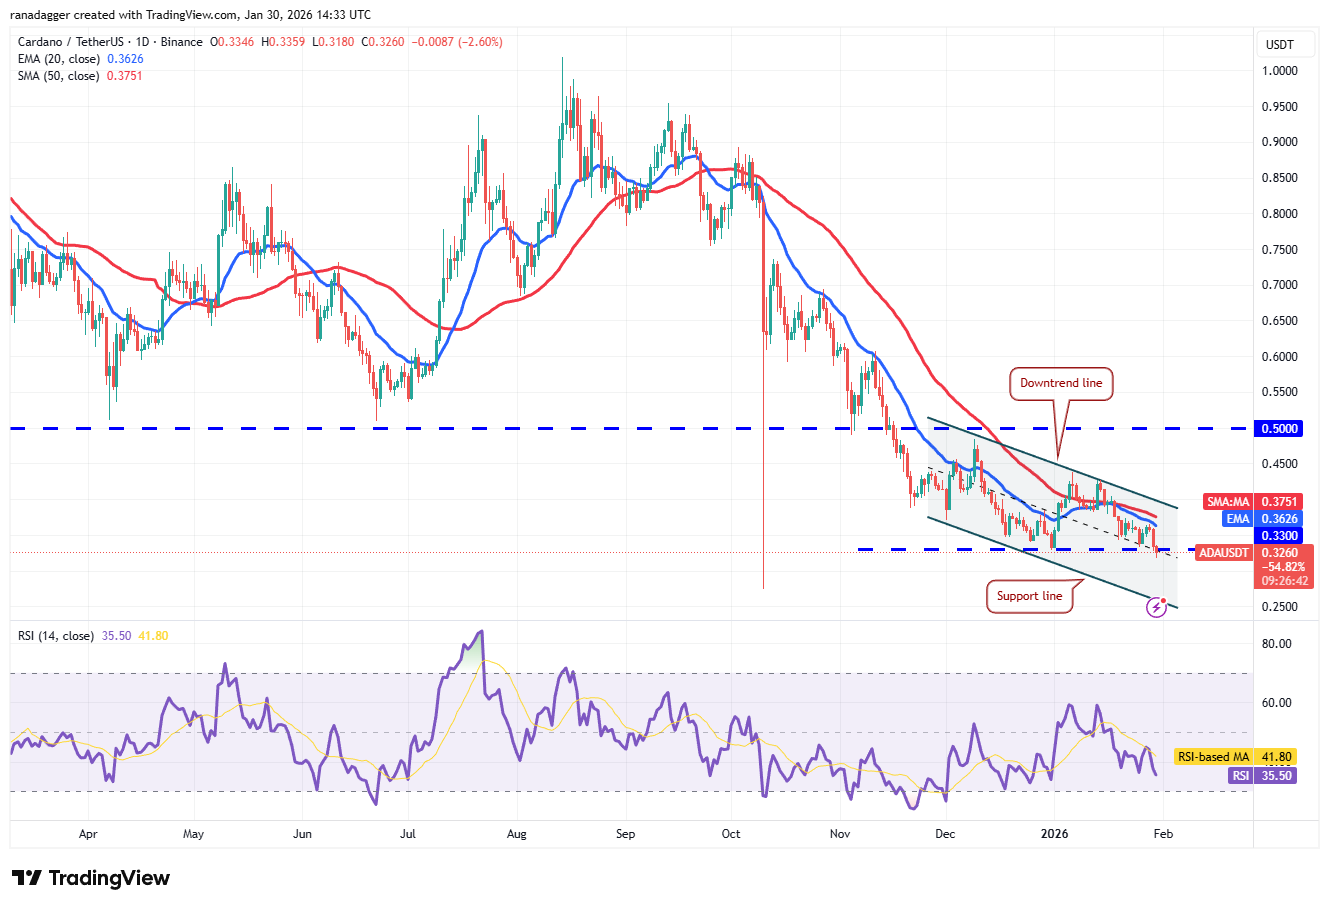
If the Cardano price closes below the $0.33 support, the ADA/USDT pair may decline to the support line of the descending channel pattern. The bulls are expected to defend the support line, which is close to the Oct. 10, 2025, low of $0.27.
Contrary to this assumption, if the price turns up from the current level and breaks above the downtrend line, it signals that the bulls are active at lower levels. That opens the doors for a rally to the breakdown level of $0.50.
Related: Ethereum loses $2.8K support as charts point to possible 22% downside
Bitcoin Cash price prediction
Bitcoin Cash (BCH) plunged below the $563 support on Thursday, completing a bearish head-and-shoulders pattern.
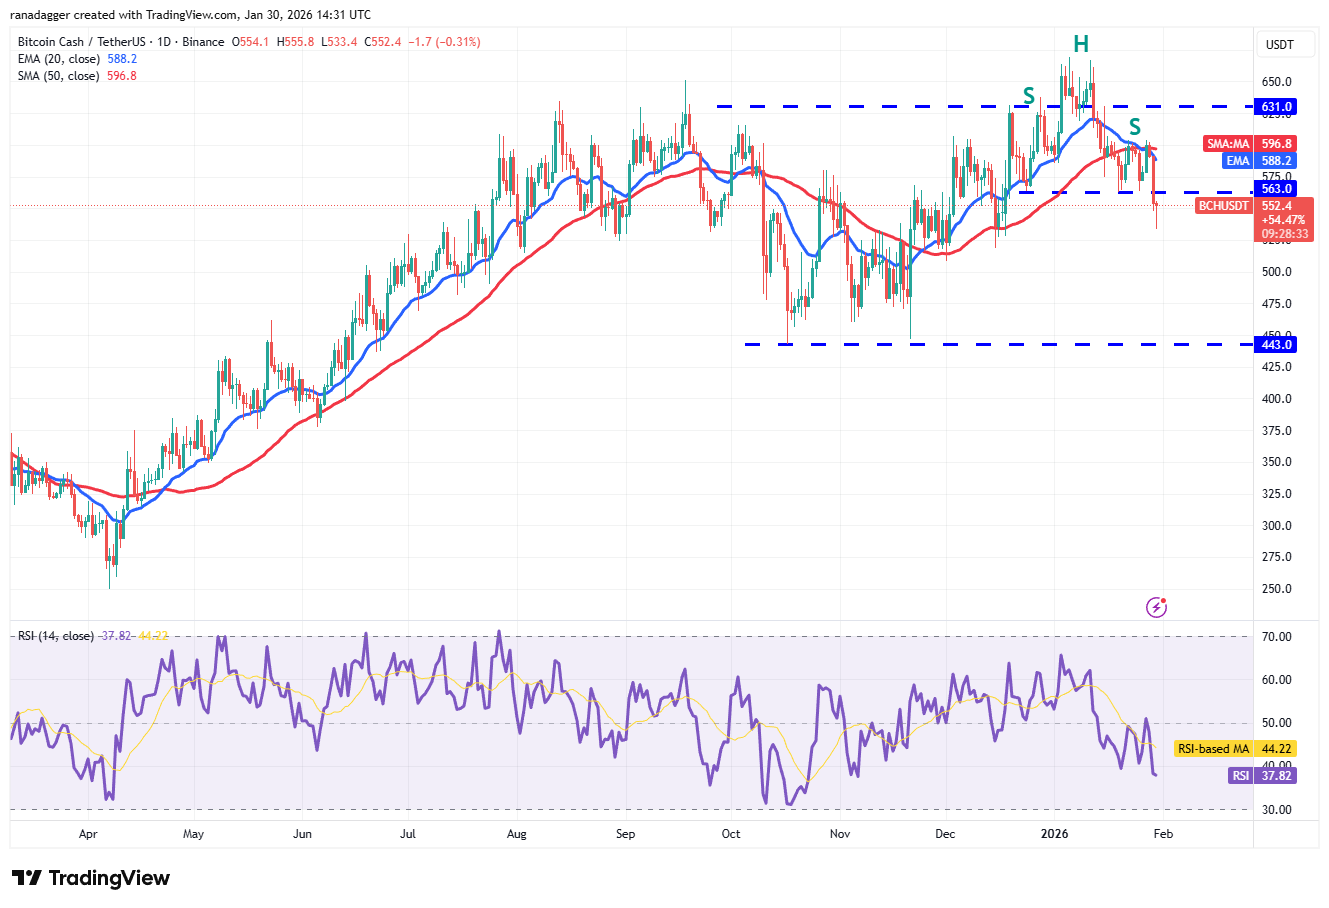
The bulls will attempt to push the Bitcoin Cash price back above the $563 level but are expected to face solid resistance from the bears. If the price turns down from $563, it suggests that the bears have flipped the level into resistance. That increases the likelihood of a drop to $518 and thereafter to the pattern target of $456.
This bearish view will be negated in the short term if buyers drive the price above the $604 resistance. The BCH/USDT pair may then jump to $631 and subsequently to $670.
Hyperliquid price prediction
Hyperliquid (HYPE) turned down from the breakdown level of $35.50 on Thursday, indicating that the bears are fiercely defending the level.
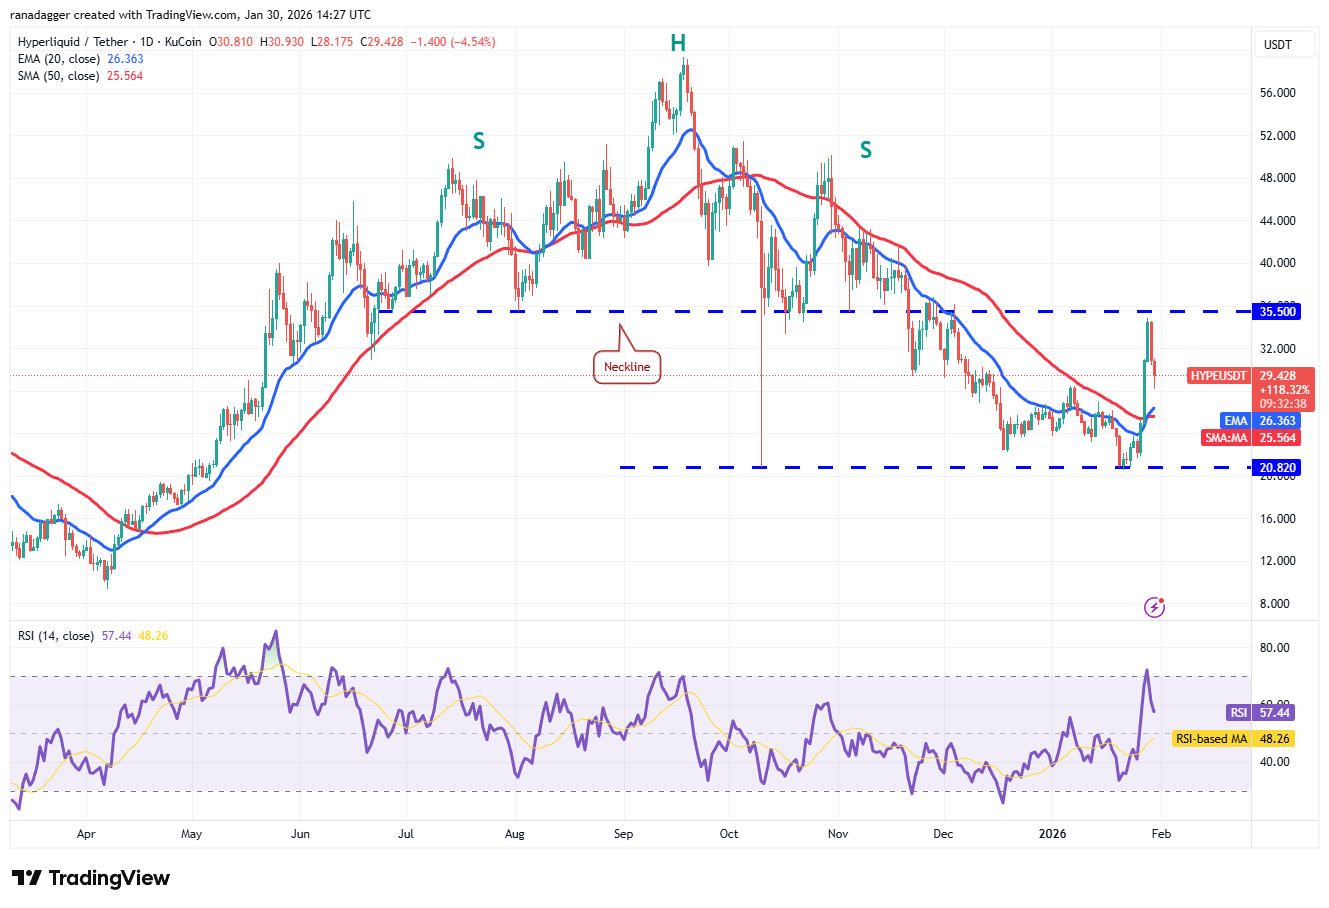
The 20-day EMA ($26.36) is the critical support to watch out for on the downside. If the price turns up from the 20-day EMA, the bulls will again attempt to propel the HYPE/USDT pair above $35.50. If they succeed, the pair may rally to $44.
Conversely, if the Hyperliquid price breaks below the moving averages, the pair may consolidate from $35.50 to $20.82 for a while longer. The downtrend may resume on a break below $20.82.
Monero price prediction
The failure of the bulls to push Monero (XMR) above the 50-day simple moving average (SMA) ($482) shows that the bears are selling on every minor rise.
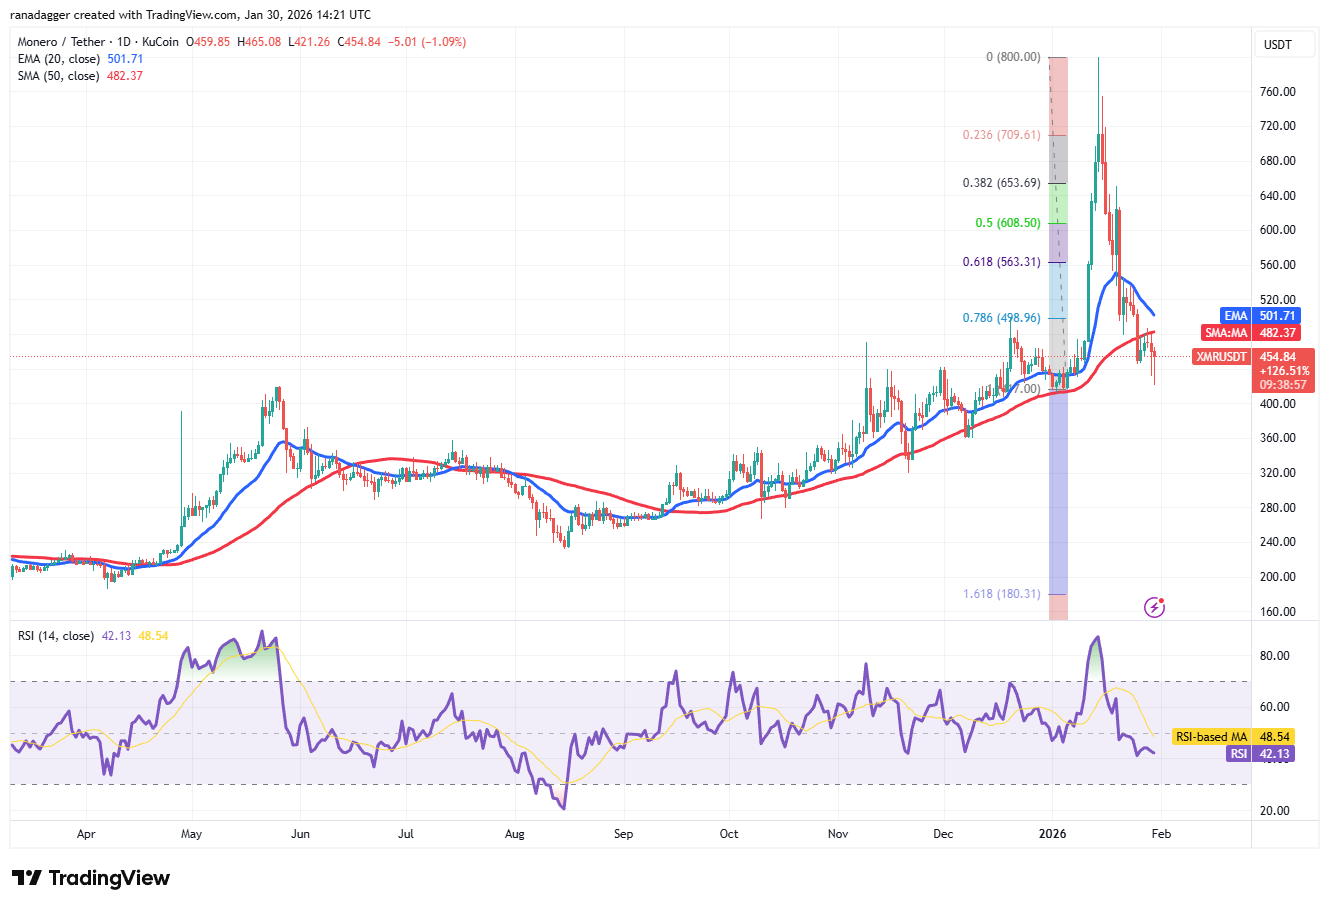
The bulls are attempting to defend the $417 support as seen from the long tail on the candlestick. The relief rally is expected to face selling at the moving averages. If the price turns down from the moving averages, the risk of a break below the $417 level increases. The XMR/USDT pair may then nosedive to $360.
Buyers have an uphill task ahead of them. They will have to drive the Monero price above the 20-day EMA ($501) to signal a comeback. The pair may then march toward $546, where the sellers are expected to step in.
This article does not contain investment advice or recommendations. Every investment and trading move involves risk, and readers should conduct their own research when making a decision. While we strive to provide accurate and timely information, Cointelegraph does not guarantee the accuracy, completeness, or reliability of any information in this article. This article may contain forward-looking statements that are subject to risks and uncertainties. Cointelegraph will not be liable for any loss or damage arising from your reliance on this information.
