


Key takeaways:
-
Bitcoin price charts from 2021 hint at a crash toward $60,000 if history repeats.
-
Bulls see $104,000 support holding, with targets at $140,000 or higher.
Bitcoin (BTC) has dropped more than 12.75% from its record high above $124,500, splitting traders into two camps.
One sees it as a routine bull market correction, while others warn that a new bear cycle has begun. But which side has the better argument?
Bitcoin 2021 chart fractals hint at $60,000
According to multiple analyses, Bitcoin could repeat the price trajectory that foreshadowed the 2021 market top.
Crypto analyst Reflection points out that in 2021, BTC staged a sharp rally to record highs, followed by a blow-off top, a correction into mid-range support, and finally a failed retest of resistance.
That sequence of moves triggered a 50%-plus crash, sending Bitcoin from nearly $69,000 to around $32,000 in just weeks.
Bitcoin’s 2025 structure is now echoing that same four-step process, with BTC hovering just below a similar distribution zone that marked the bearish reversal in 2021.
The cryptocurrency risks a similar rejection if the fractal holds.
Meanwhile, on the weekly chart, Bitcoin has broken below a rising wedge, a bearish formation of higher highs and lows within narrowing trendlines.
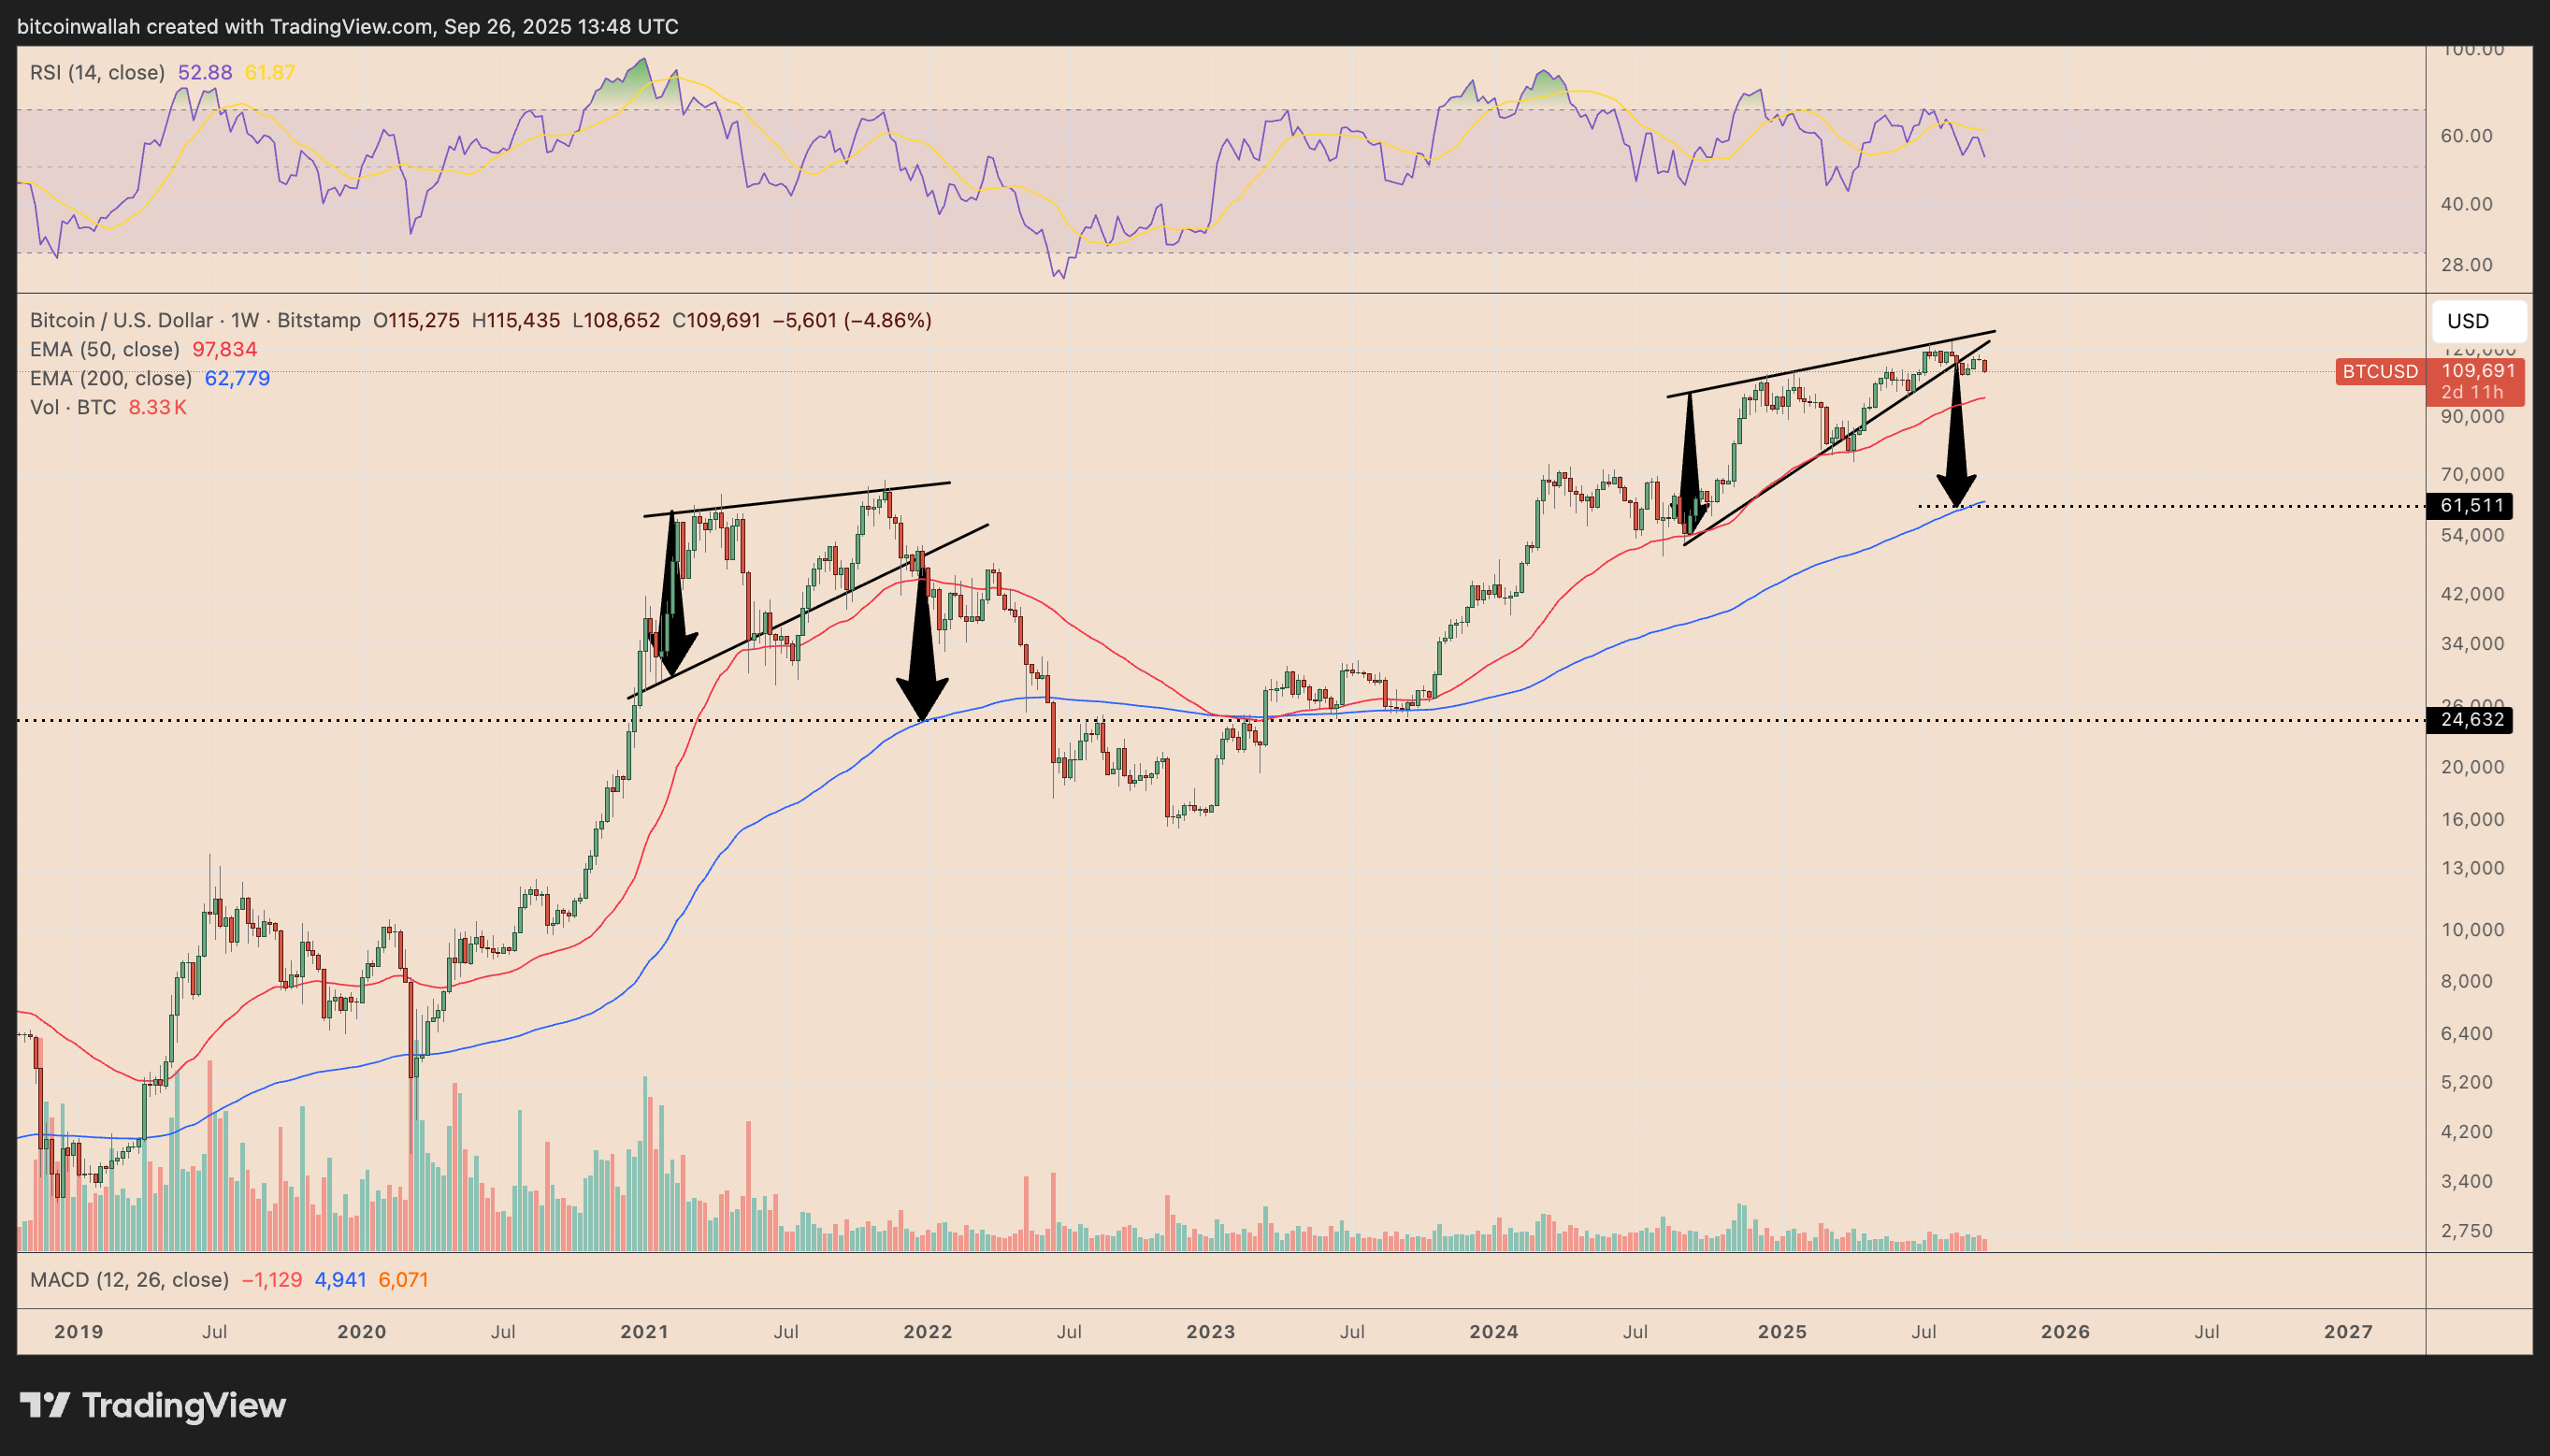
The breakdown raises the risk of a decline to the $60,000–$62,000 zone, which overlaps with the 200-week exponential moving average (200-week EMA; blue wave). Some analysts even predict the BTC price will drop toward $50,000.
Notably, a similar wedge collapse in 2021 triggered a 55% correction down to the same 200-week EMA support.
Bitcoin may recover to over $124,500
Not everyone anticipates broader declines in the Bitcoin market, however.
Trader Jesse highlights a cluster formed by BTC’s 200-day simple and exponential moving averages serving as support during bull market dips, saying that the crypto may form a “mid-term bottom” there.
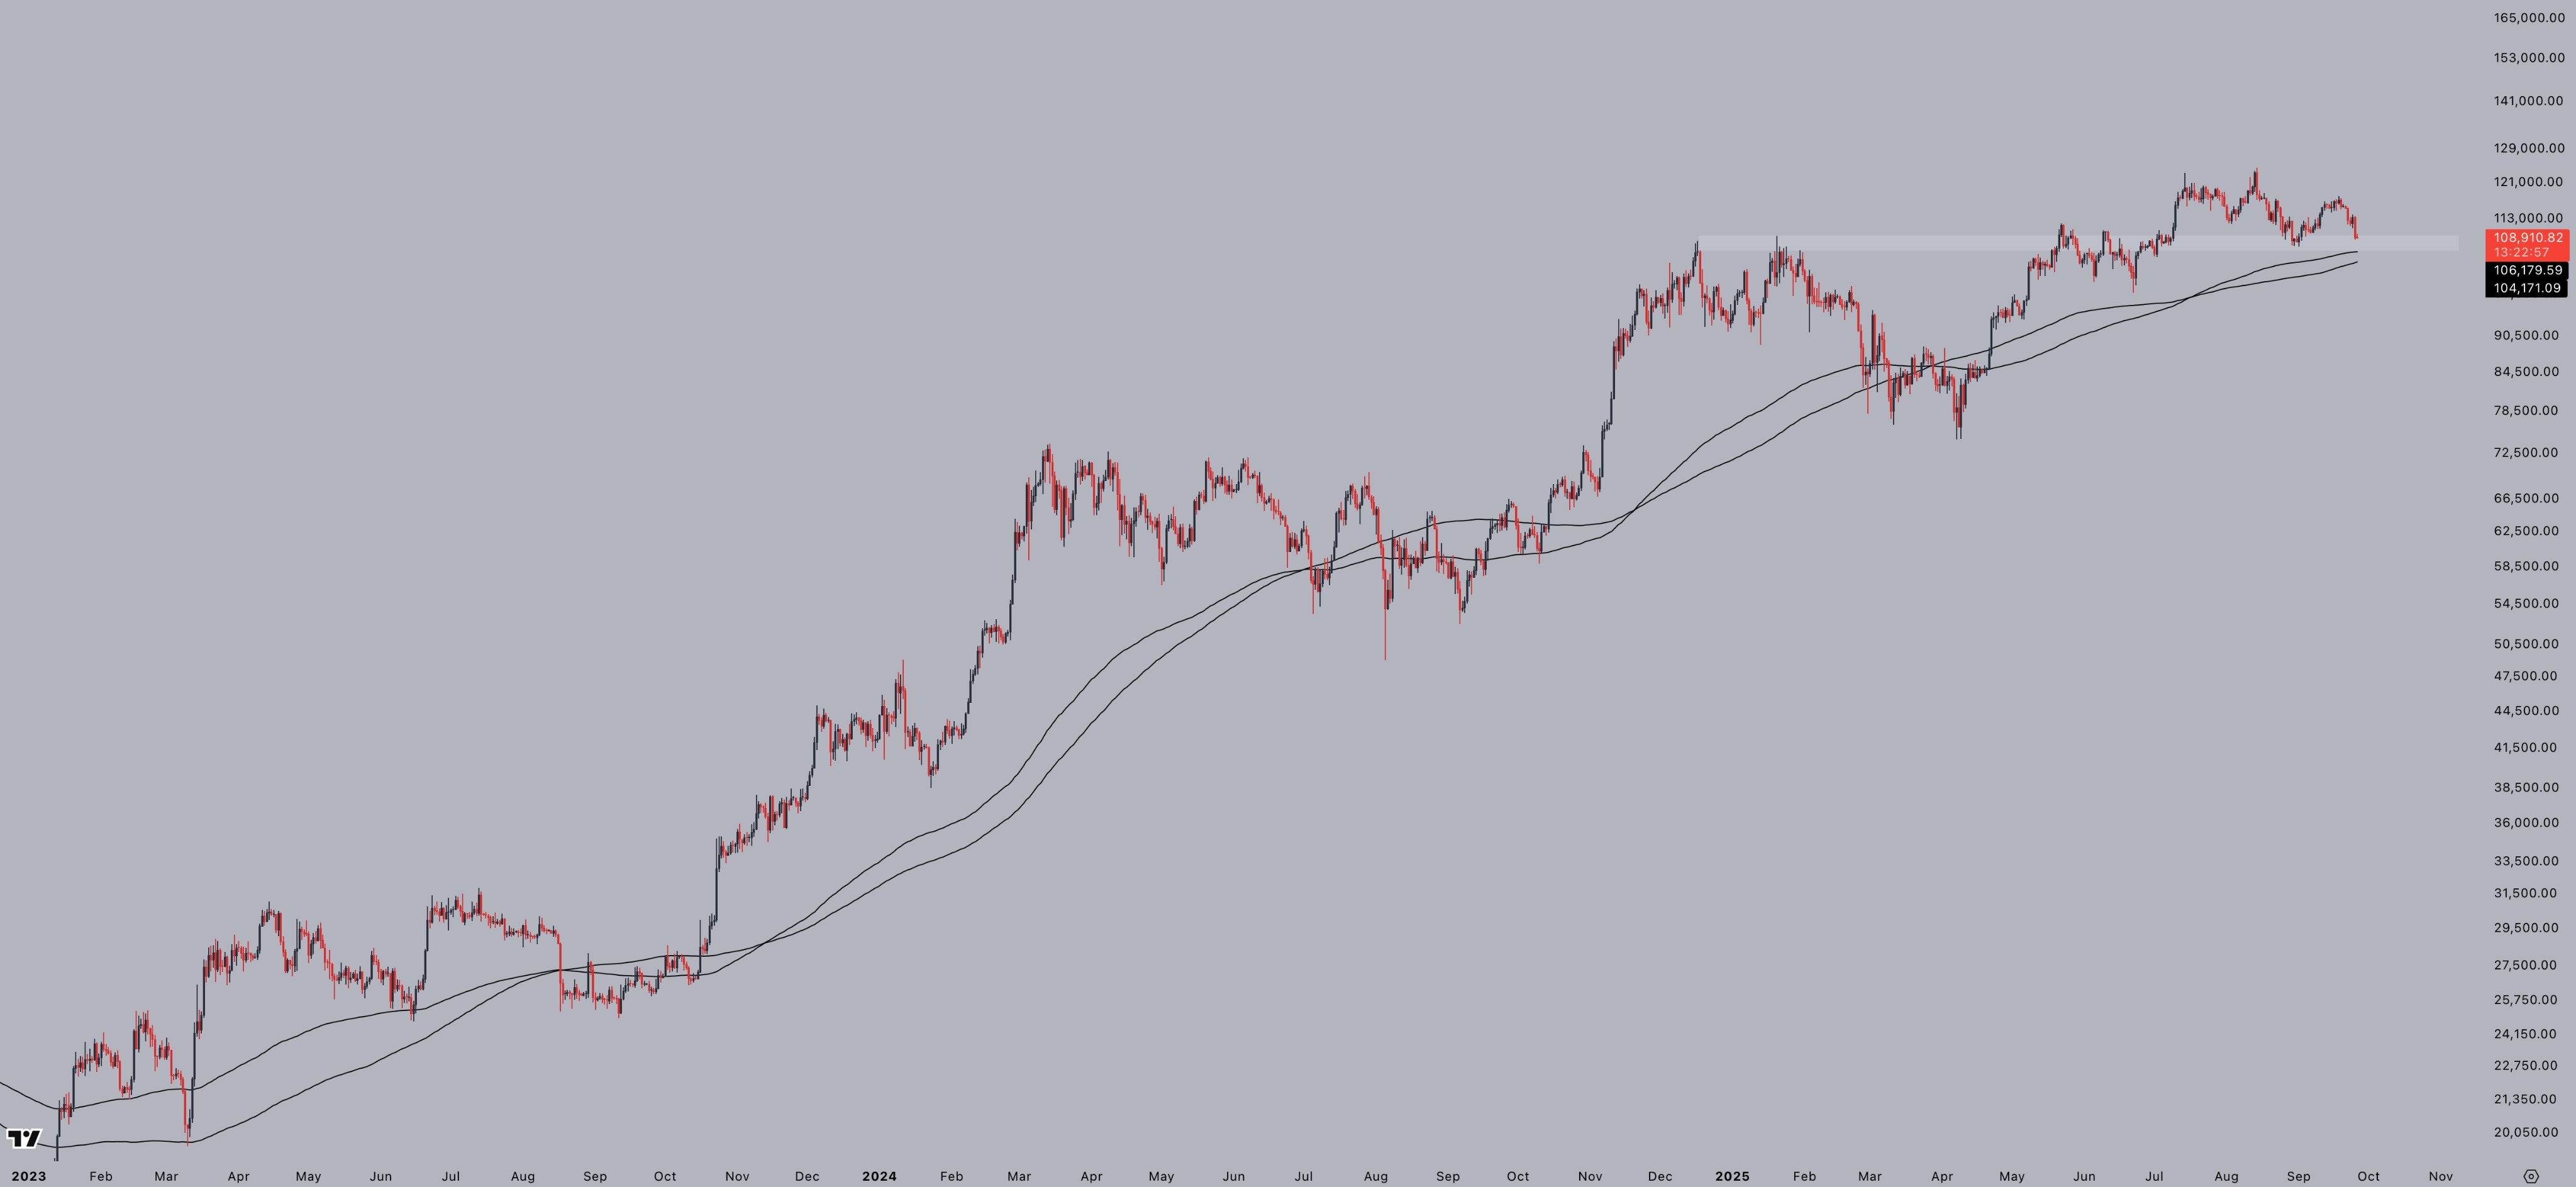
As of Friday, this EMA price floor was around the $104,000-106,000 area.
Related: Bitcoin must hit $104K to repeat past bull market dips: Research
Analyst Bitbull says that Bitcoin is still far from a true cycle top, pointing out that the US Business Cycle, a broad gauge of economic momentum, hasn’t peaked yet, which usually happens before markets roll over.
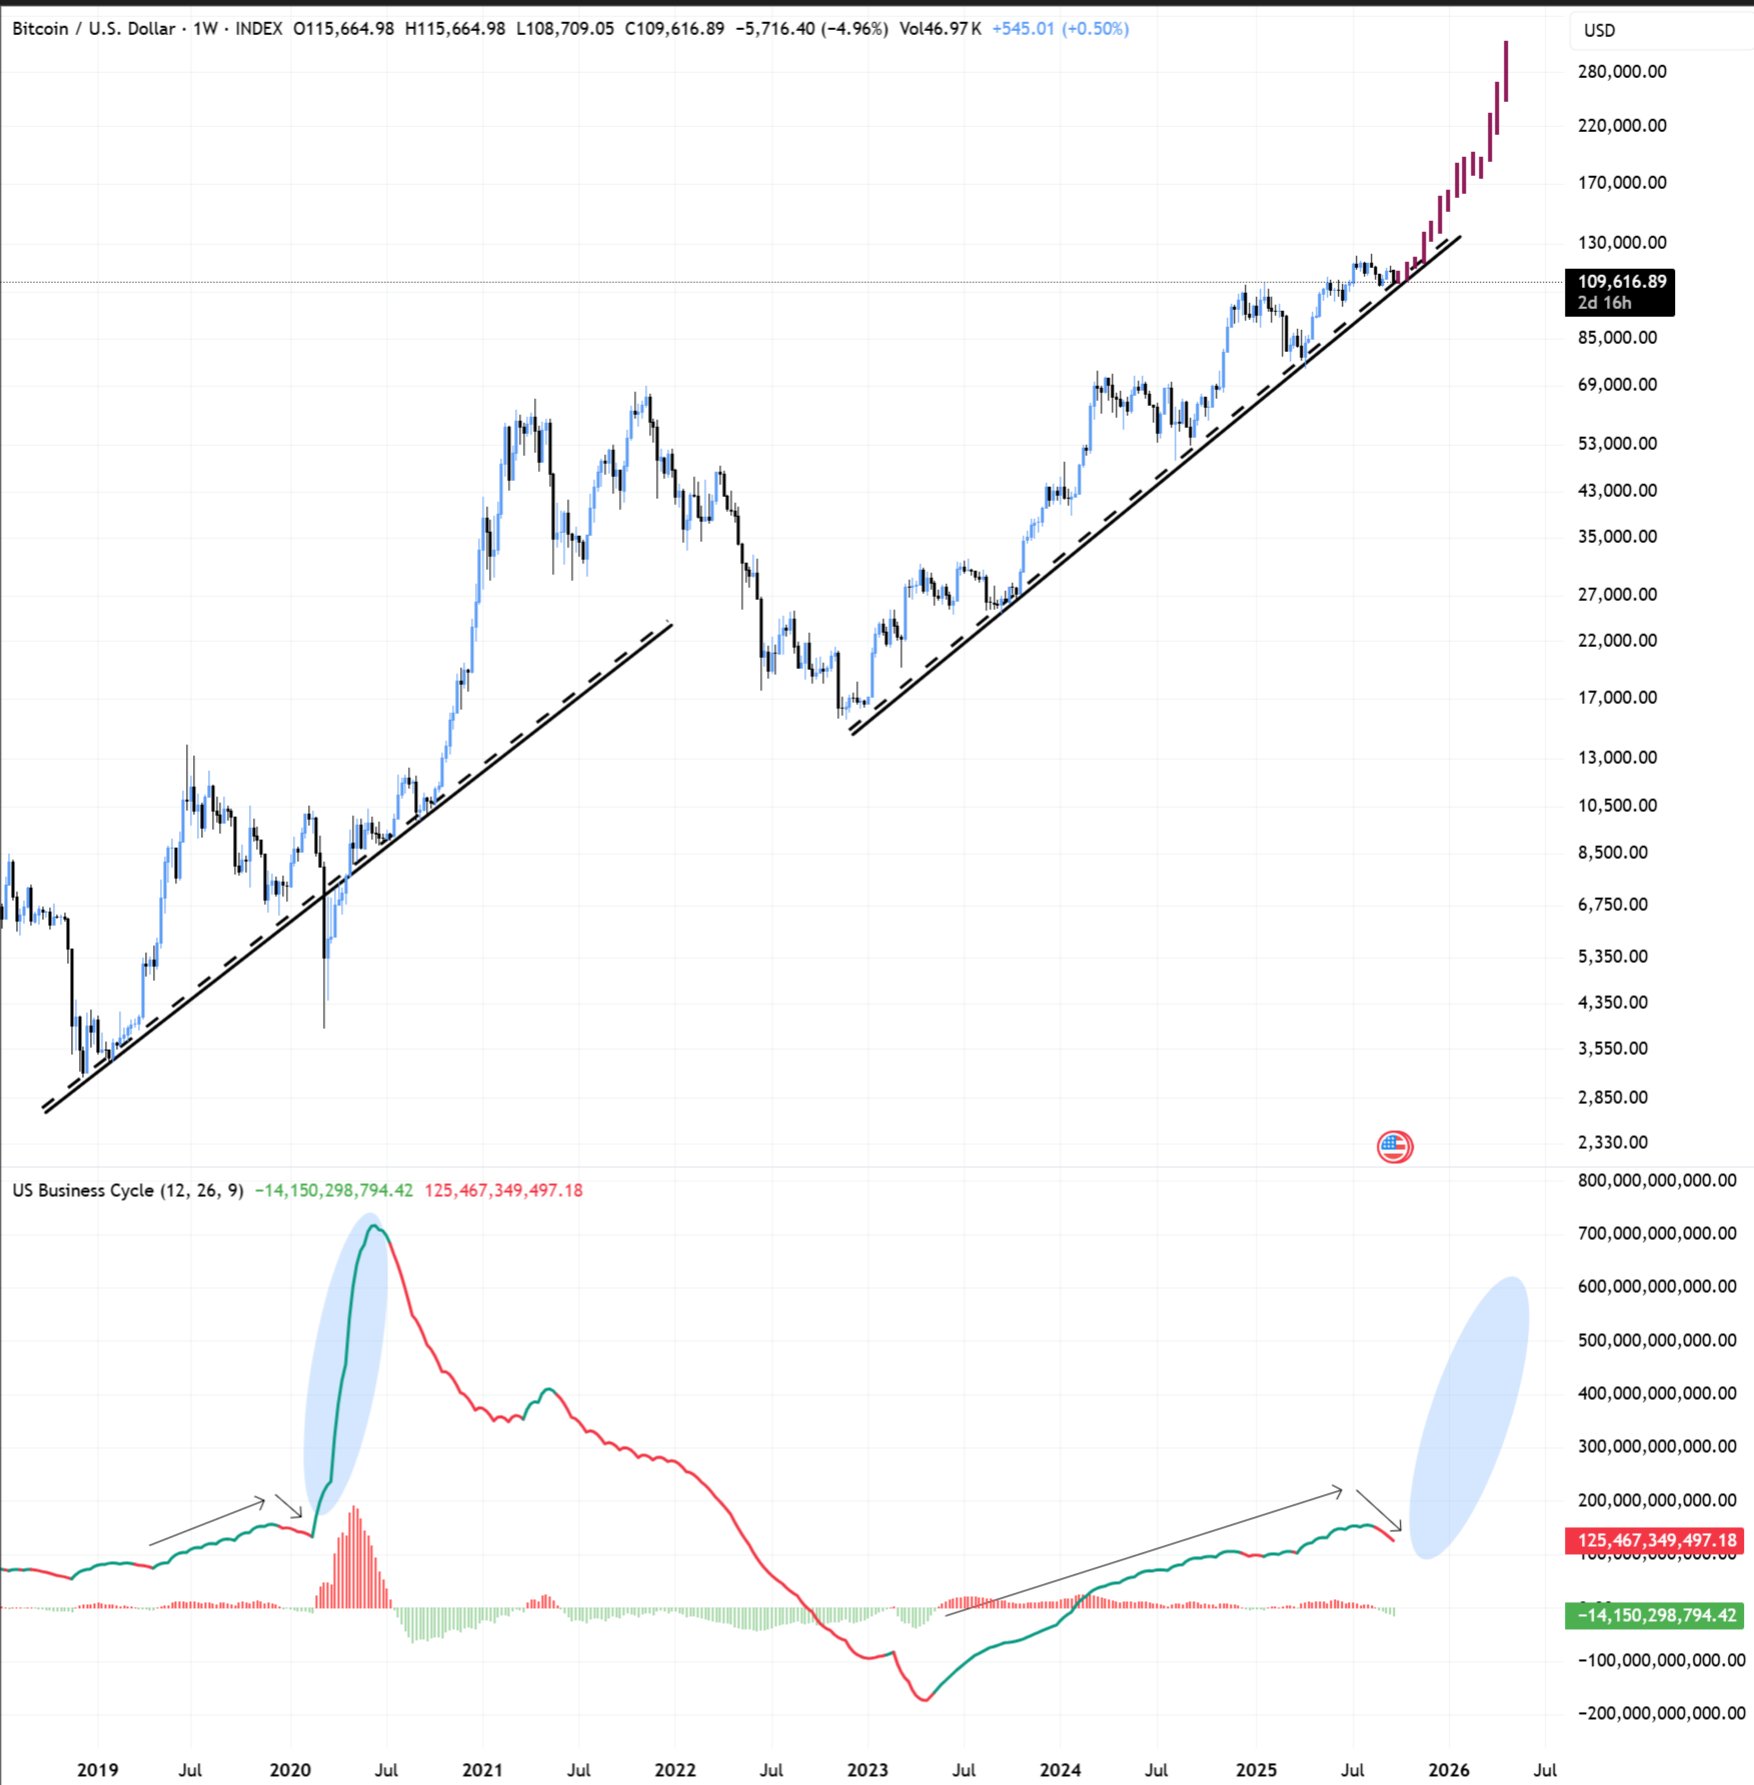
With the Federal Reserve now cutting interest rates, Bitbull believes crypto could still have another three to four months of upside before a potential “blow-off top.”
Signs of bullish continuation strengthen the case of Bitcoin rising to as high as $140,000, according to analyst Captain Faibik.
He argues that the current dip is a “healthy correction,” with BTC retesting its 200-day moving average near $104,000 as potential support.
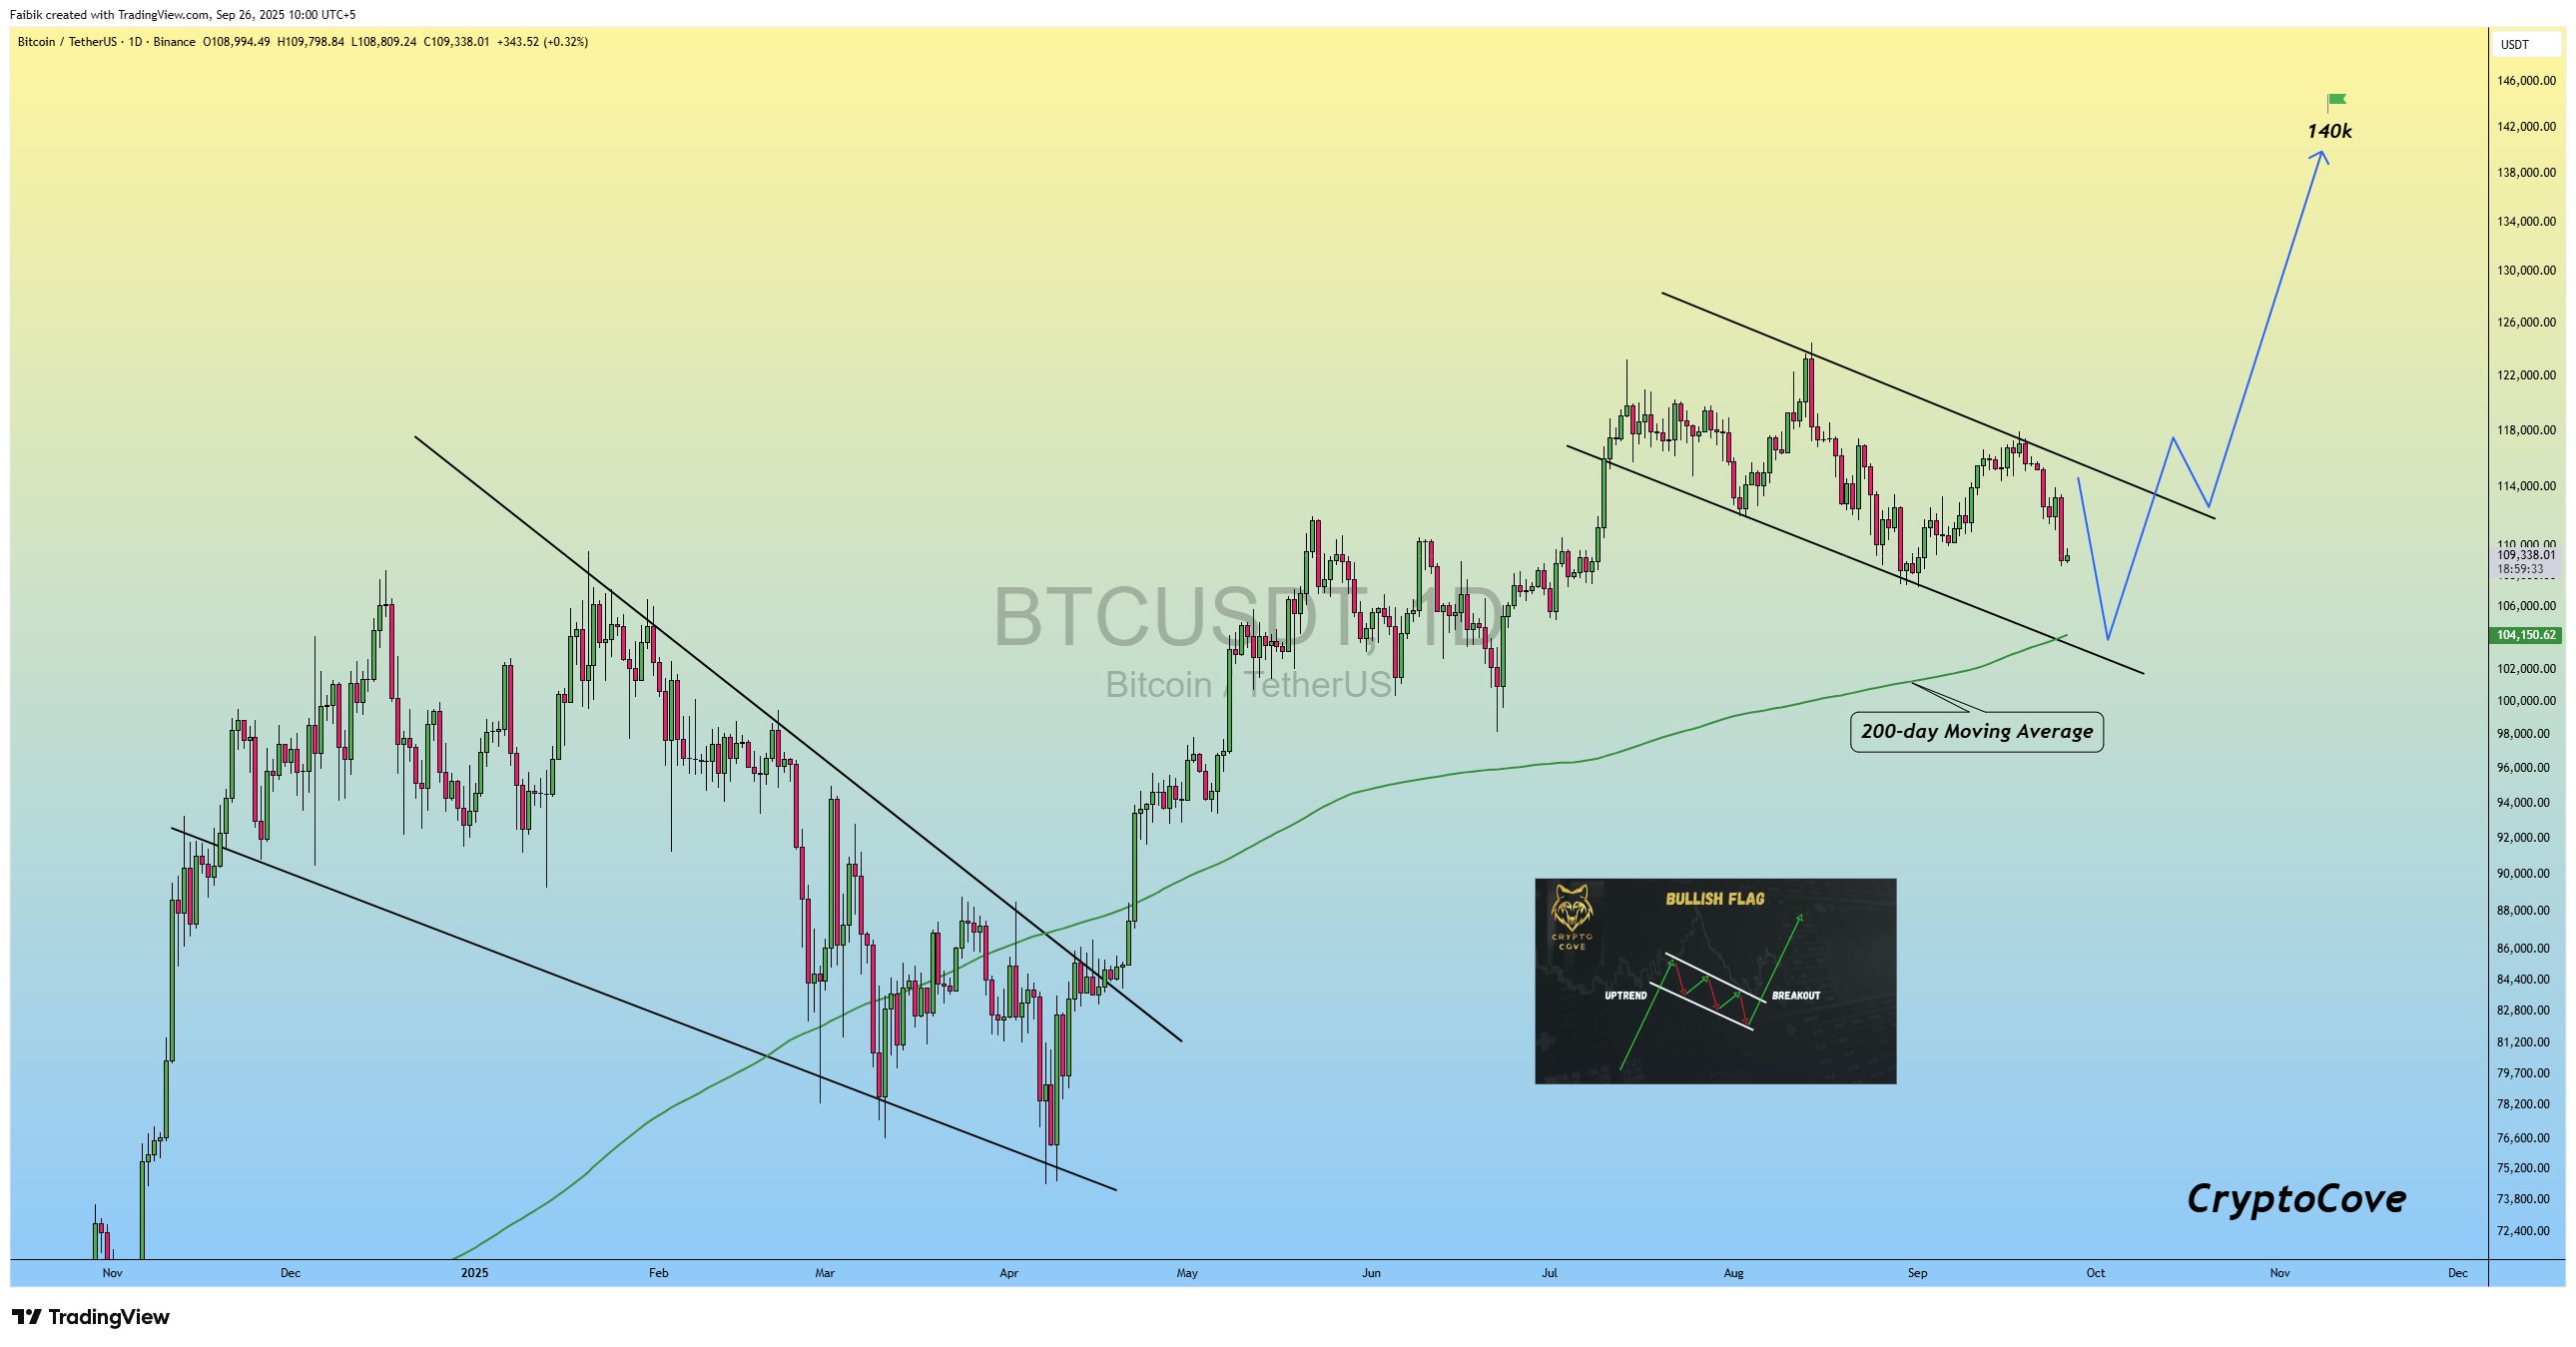
Faibik points to the emergence of a potential bull flag. In this case, a decisive move above the $113,000 resistance zone could confirm the breakout, opening the door for a rally toward $140,000 in the months ahead.
Many analysts have predicted similar year-end targets for Bitcoin in the past, with some even favoring macro BTC tops in the $150,000-200,000 range.
This article does not contain investment advice or recommendations. Every investment and trading move involves risk, and readers should conduct their own research when making a decision.
