


Key points:
-
Bitcoin finally sees investors who are willing to “buy the dip” at prices around $110,000.
-
Multiple support retests continue to grab trader attention.
-
Bulls can still realize a bullish RSI divergence with a strong daily close.
Bitcoin (BTC) kept up pressure on key support Thursday as buyer interest showed signs of a comeback.
BTC price brings back sub-$110,000 levels
Data from Cointelegraph Markets Pro and TradingView showed BTC/USD wicking below $110,000 on Bitstamp.
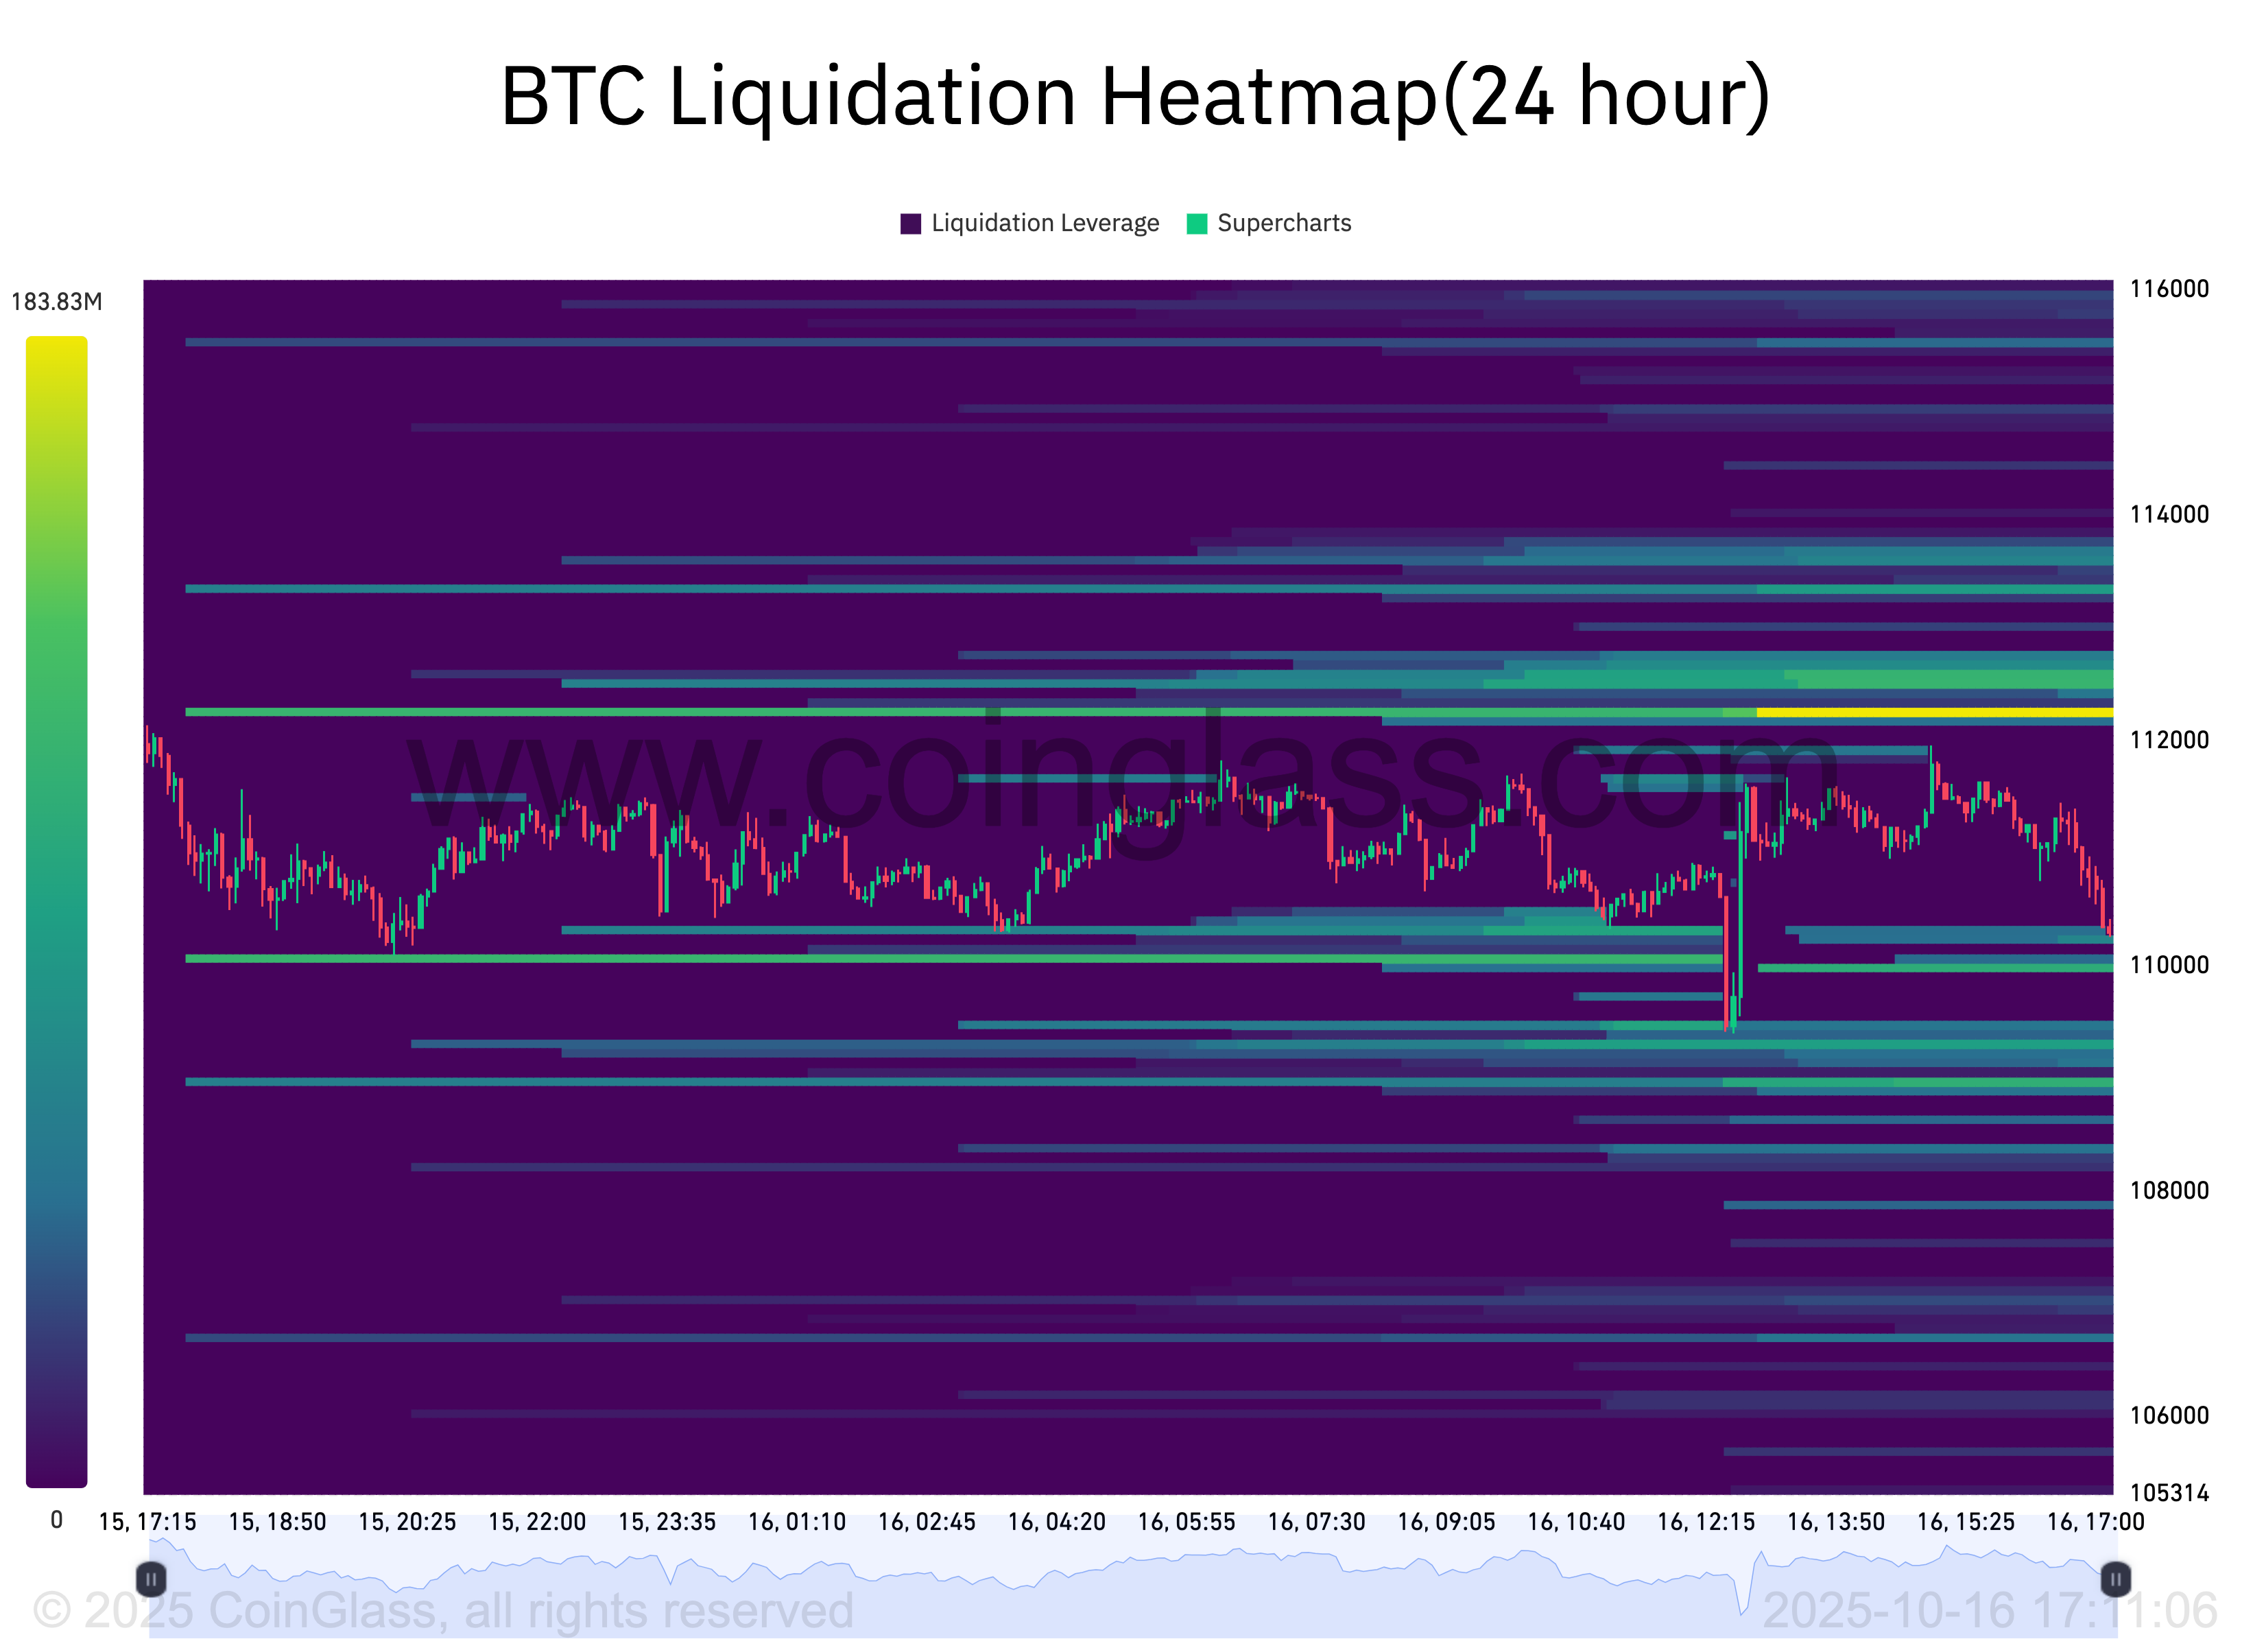
Exchange order-book liquidity on either side of the price was targeted, with both local lows and resistance at $112,300 now a key focus.
“Time to lock in again, 4th time testing this demand area,” trader Skew wrote about the former in an X post.
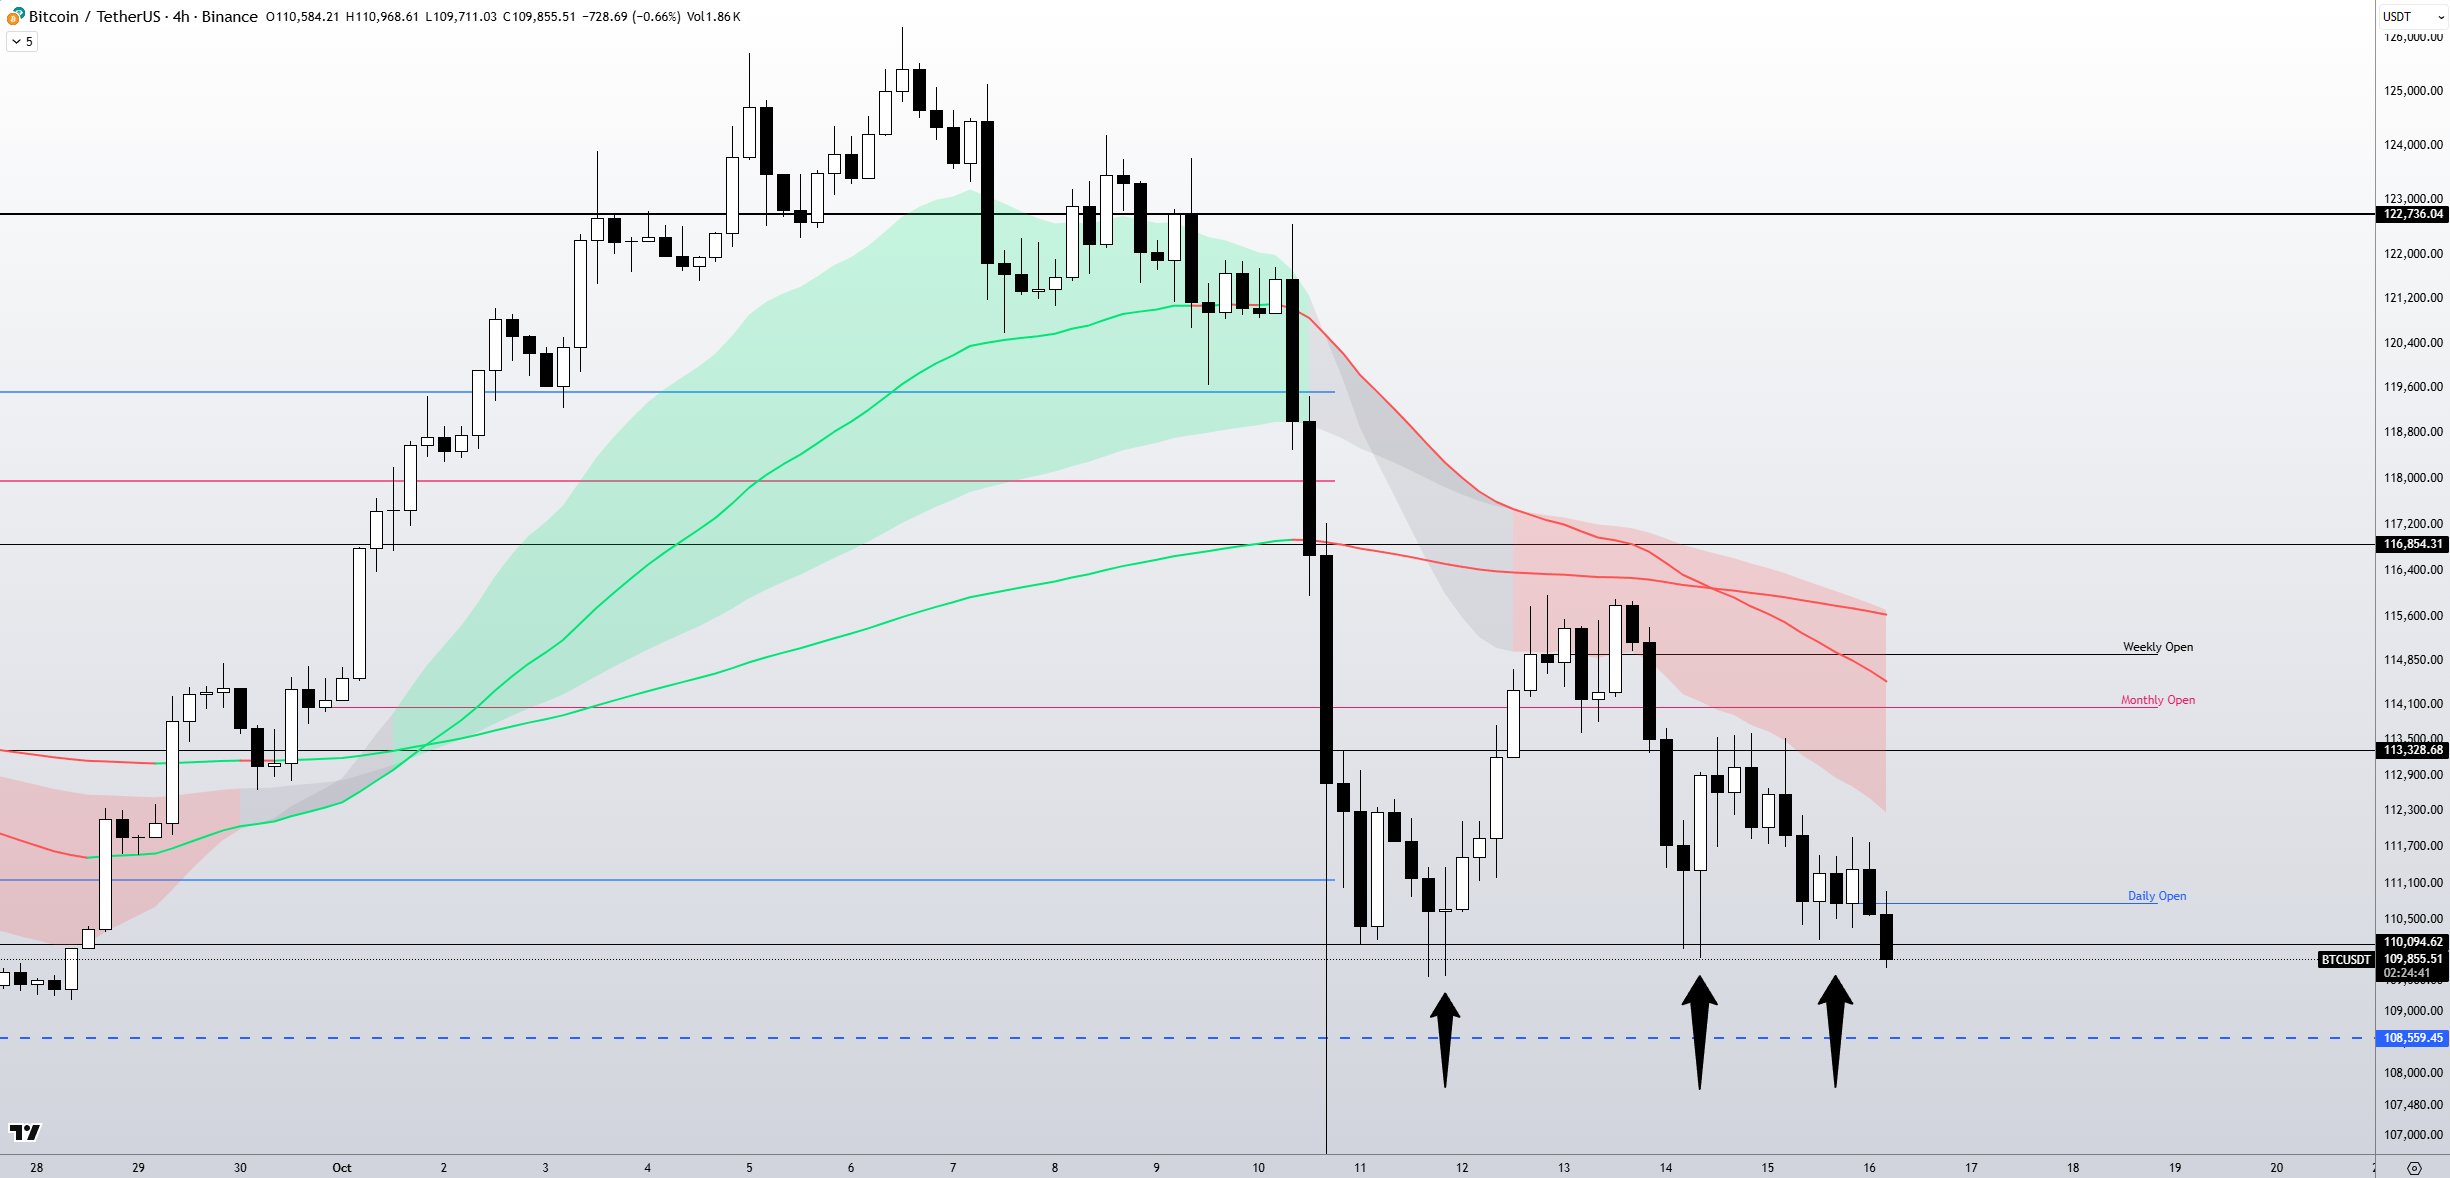
Trader and analyst Rekt Capital noted that BTC/USD had now filled an outstanding “gap” in CME Group’s Bitcoin futures market.
Bitcoin has now completely filled its Weekly CME Gap between $109680 and $111310$BTC #Crypto #Bitcoin https://t.co/NS86XQRgTn pic.twitter.com/zfvYml9hih
— Rekt Capital (@rektcapital) October 16, 2025
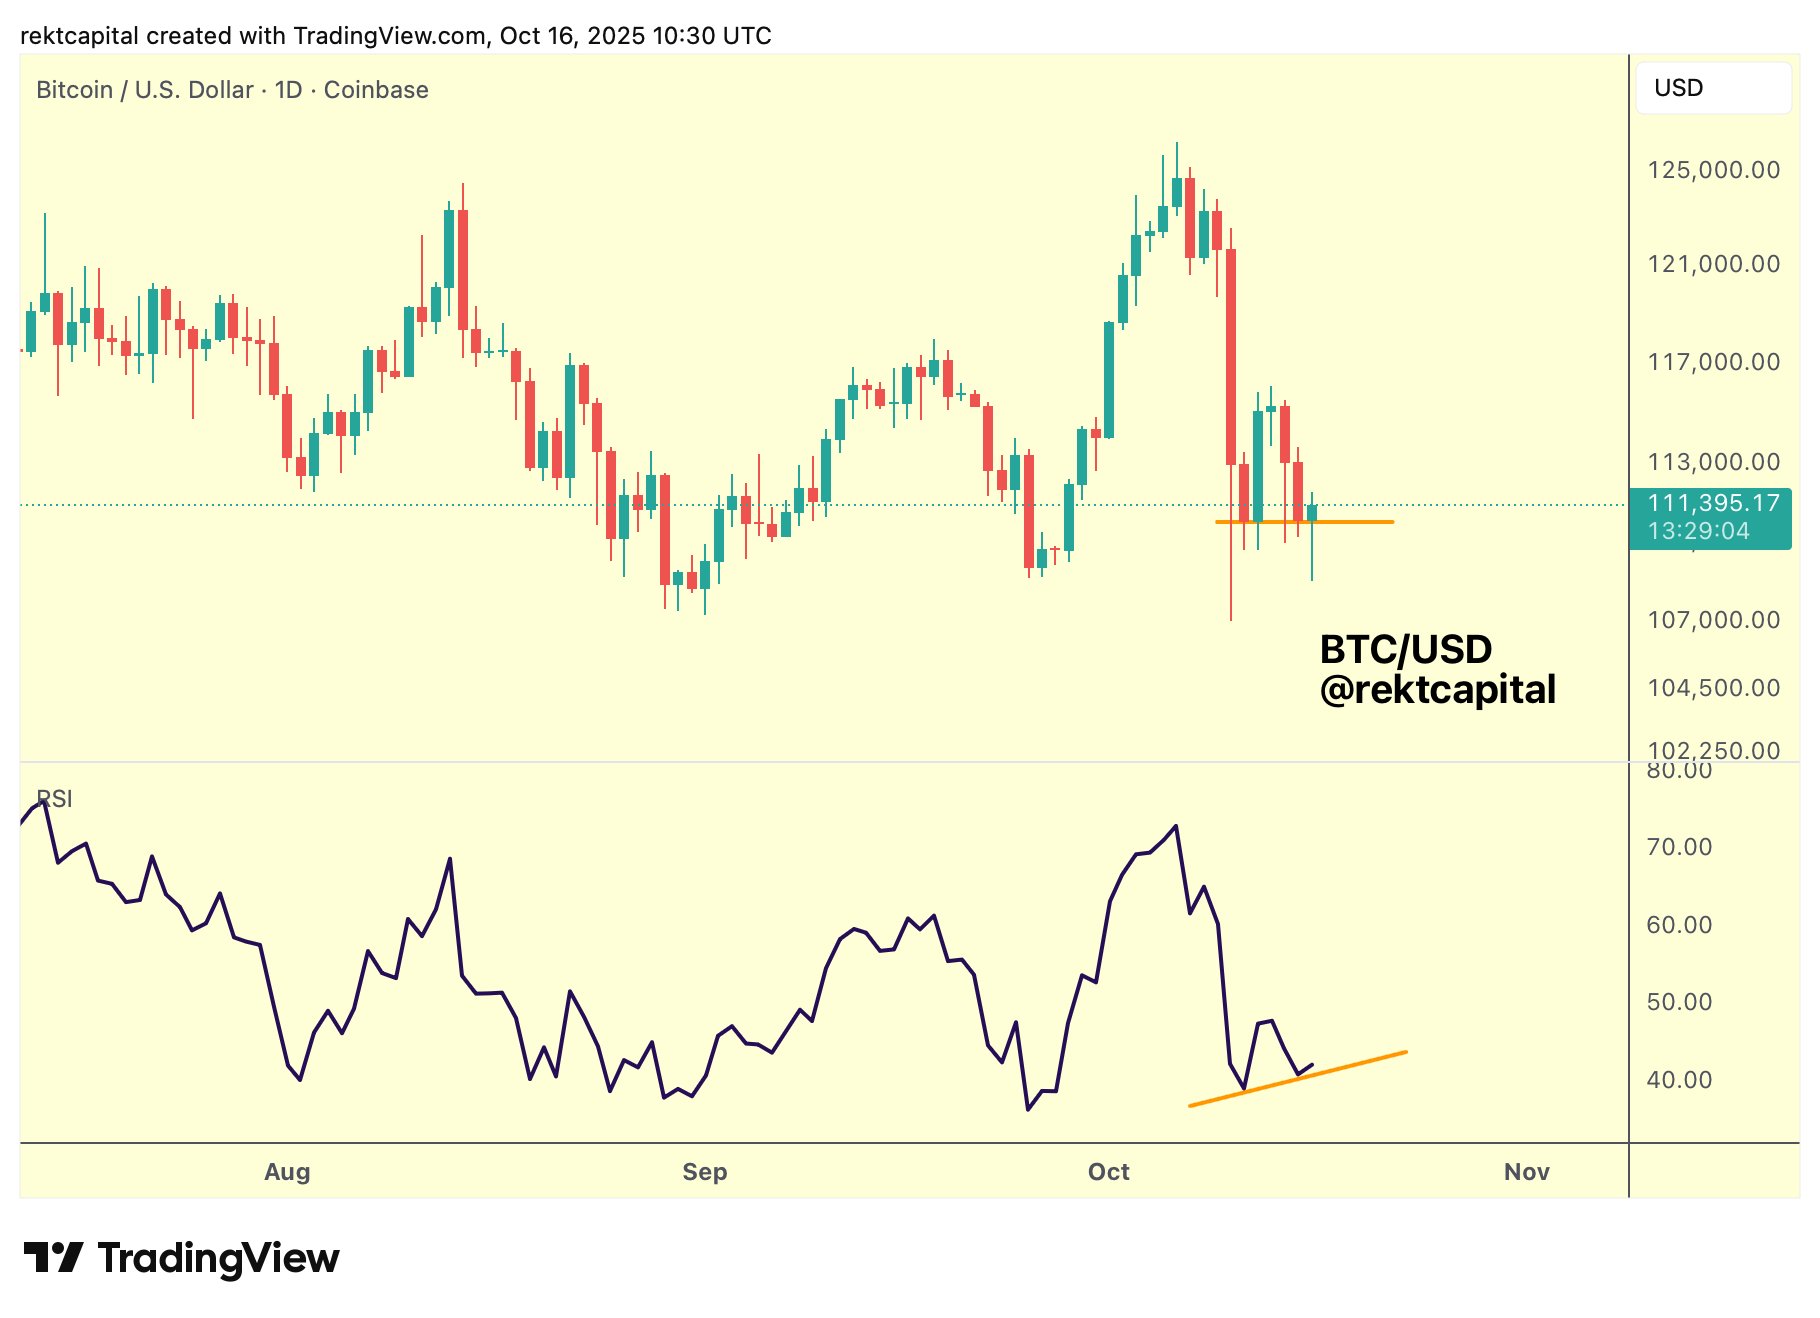
Addressing the relative strength index (RSI), Rekt Capital eyed an “emerging” bullish divergence with price — a potential sign of upside to come.
“Price needs to Daily Close just like this to crystallise it,” he added.
Crypto analyst and entrepreneur Ted Pillows used market sentiment as proof that the Bitcoin price was likely establishing a local floor.
“$BTC has been consolidating after last week’s crash,” he told X followers.
“Sentiment is at an all-time low, people are panic selling and ‘it’s all over’ is on the timeline. This doesn’t happen at the top, but rather at the bottom.”
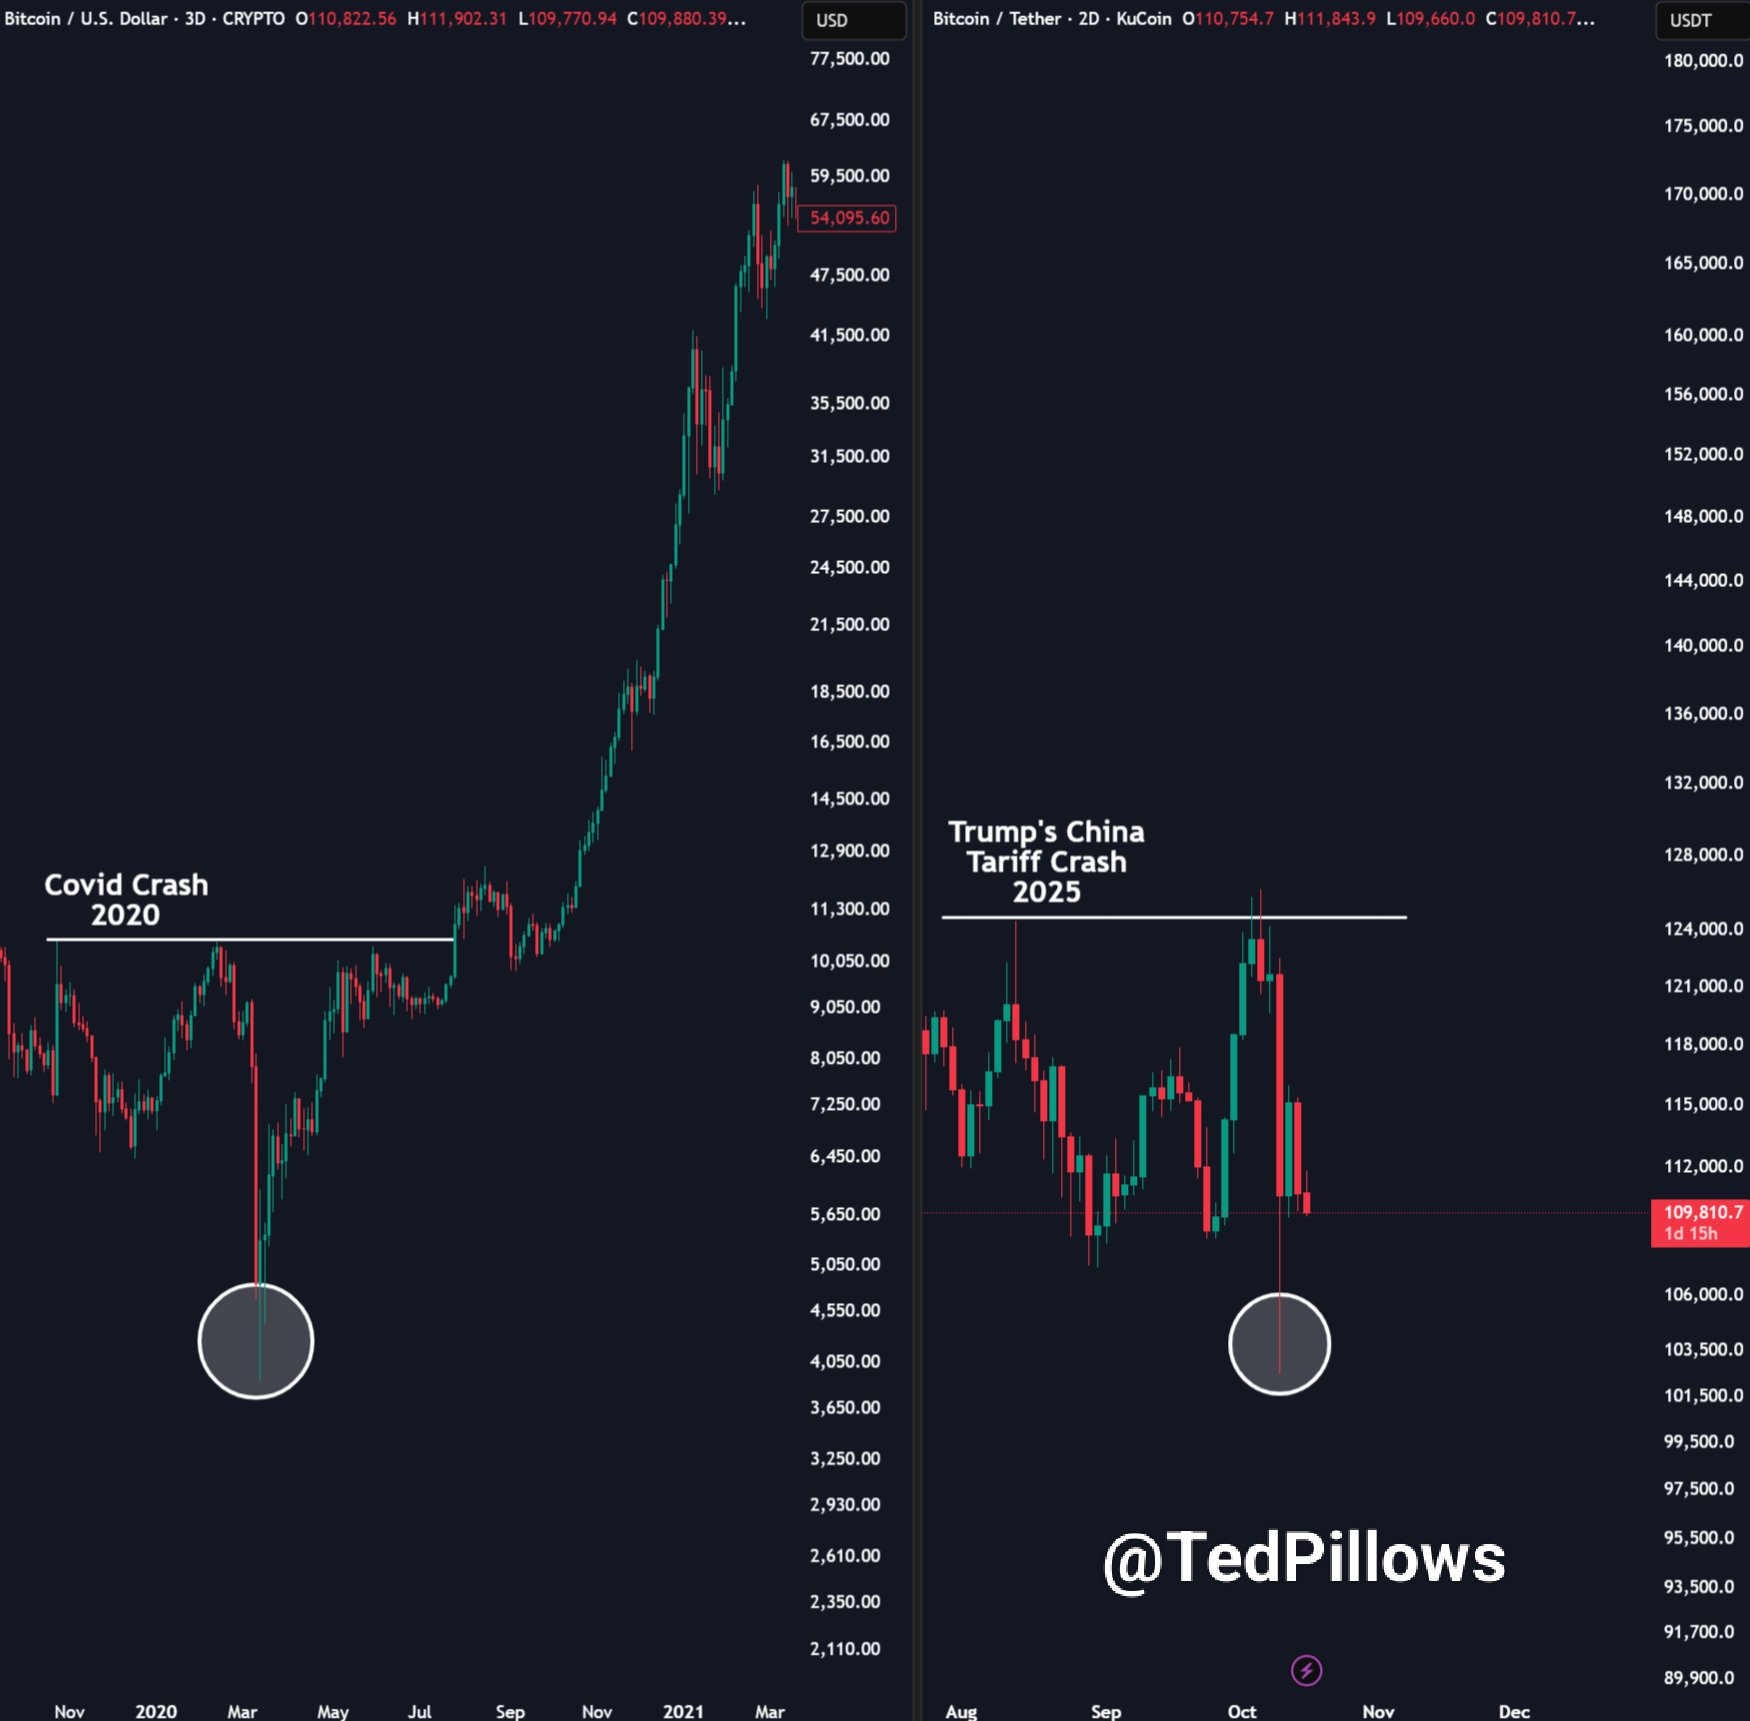
Pillows uploaded a chart comparing current BTC price action to that from the COVID-19 cross-market crash in March 2020.
As Cointelegraph reported, the Crypto Fear and Greed Index has flipped to “fear” this month, matching six-month lows.
Bitcoin dip-buyers finally emerge
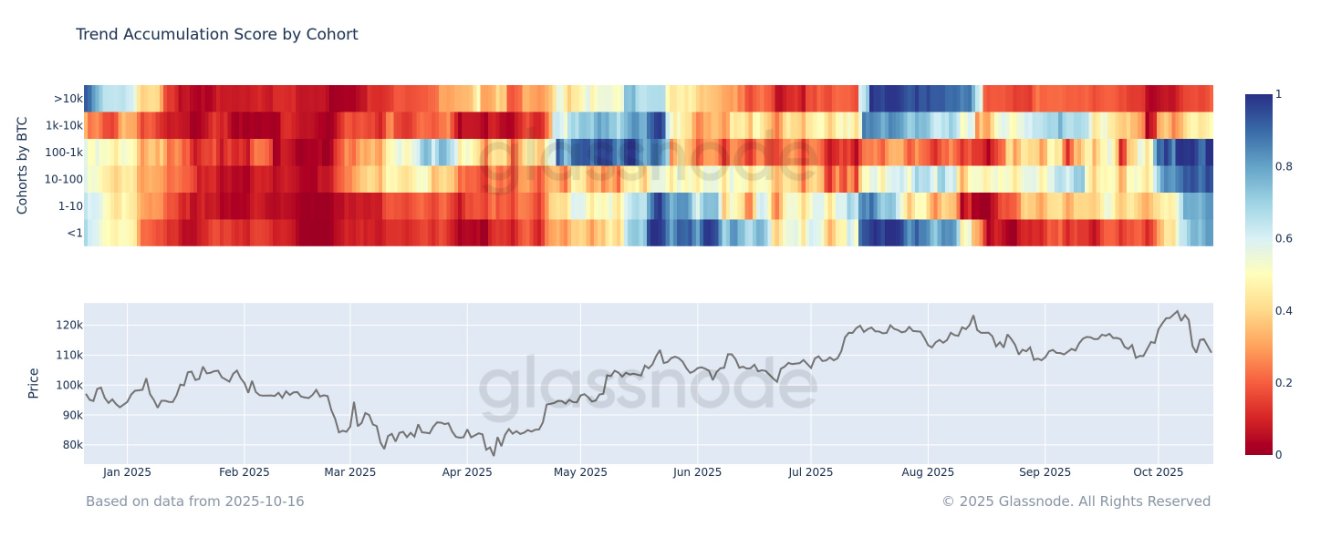
Researching investor trends, however, onchain analytics platform Glassnode had some good news for bulls.
Related: Bitcoin traders fear $102K BTC price dive next as gold sets new highs
Entities holding between 1 BTC and 1,000 BTC, it revealed on the day, were showing “strong accumulation.”
Even whales, who distributed large amounts of BTC to the market in recent weeks, were slowing their sales.
Glassnode said that this was “signaling renewed confidence in spite of the recent shakeout.”
This article does not contain investment advice or recommendations. Every investment and trading move involves risk, and readers should conduct their own research when making a decision.
