


Key point:
Bitcoin (BTC) is taking a breather, but a positive sign is that the bulls have not ceded much ground to the bears. That suggests the bulls are holding on to their positions as they anticipate the uptrend to resume.
US-based BTC exchange-traded funds recorded $799.4 million in inflows on Wednesday, the tenth successive day of inflows, according to Farside Investors data. Investors have ploughed in more than $5.2 billion into the BTC ETFs since July 2.
Could BTC’s uptrend resume? What are the target and support levels to watch out for? Let’s analyze the charts to find out.
BTC price prediction
Buyers tried to resume the up move on Wednesday, but the long wick on the candlestick shows that the bears defended the $120,000 level.
Repeated failures to cross above the $120,000 level could start a deeper pullback toward the 20-day exponential moving average ($113,528). If the price rebounds off the 20-day EMA, the bulls will again attempt to thrust the BTC/USDT pair above the $120,000 to $123,218 resistance zone. If they succeed, the pair could start the next leg of the uptrend to $135,729 and eventually to the pattern target of $150,000.
The bears will have to yank the price below the $110,530 support to seize control. The pair may then plummet to $105,000.
Related: Is FOMO back? Bitcoin first timers buy 140K BTC in 2 weeks
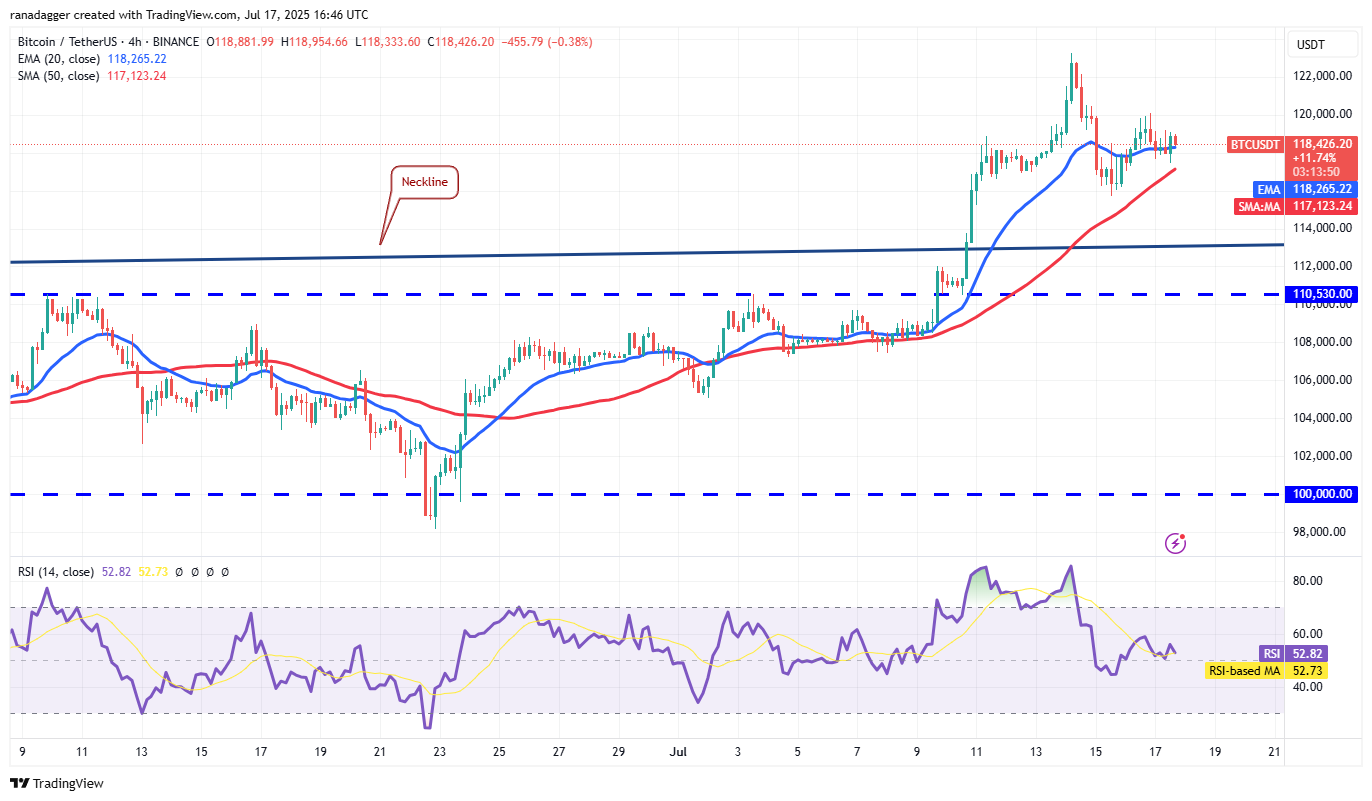
The 20-EMA has flattened out, and the relative strength index (RSI) is just above the midpoint on the 4-hour chart, signaling a possible range formation in the near term. The pair could trade between $115,000 and $123,218 for some time.
If the price turns down and breaks below $115,000, the pair could drop to the neckline and later to the solid support at $110,530. Buyers are expected to fiercely defend the $110,530 level because a break below it may tilt the short-term advantage in favor of the bears.
The first sign of strength on the upside will be a break above $120,064. The pair may then retest the all-time high at $123,218.
This article does not contain investment advice or recommendations. Every investment and trading move involves risk, and readers should conduct their own research when making a decision.
