


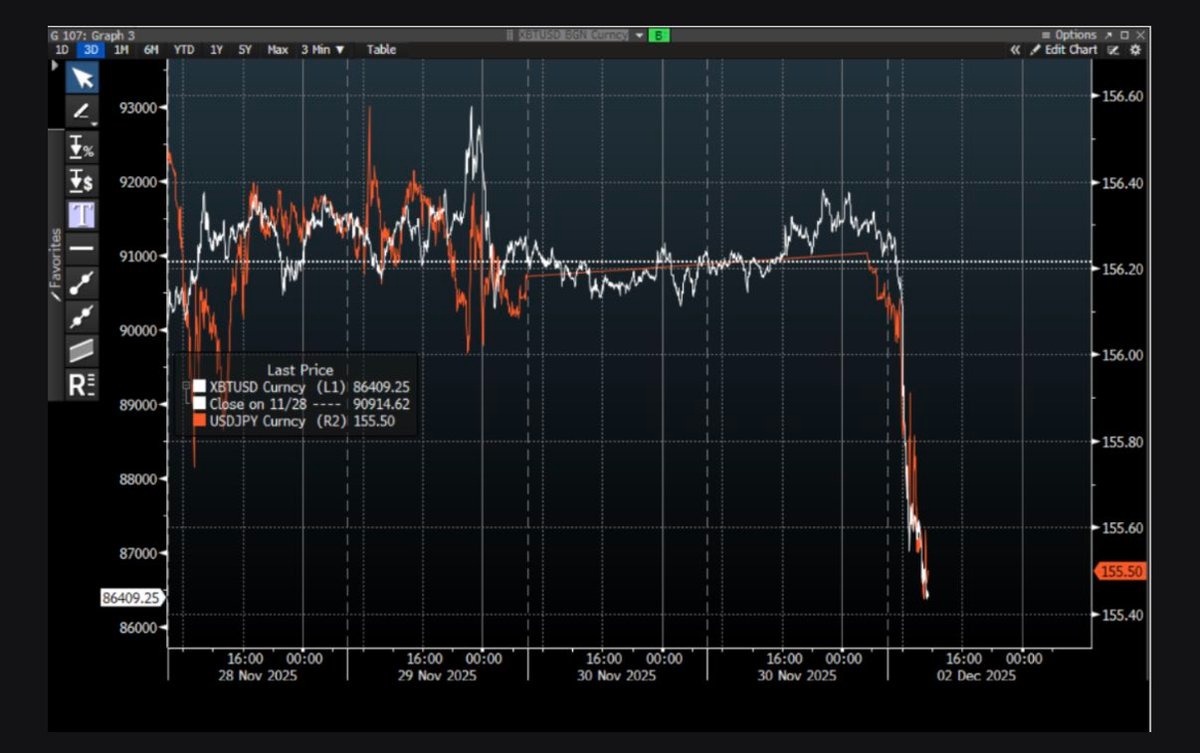
Bitcoin (BTC) experienced a sharp pullback in early Asian trading on Monday, dropping $85,500 amid increasing expectations of a December rate hike by the Bank of Japan (BoJ).
Key takeaways:
-
Bitcoin dropped 5% to $85,000 in a marketwide correction, liquidating $656 million in longs.
-
Mounting expectations for a BoJ rate hike at its Dec. 18-19 meeting weighed down on the BTC price.
-
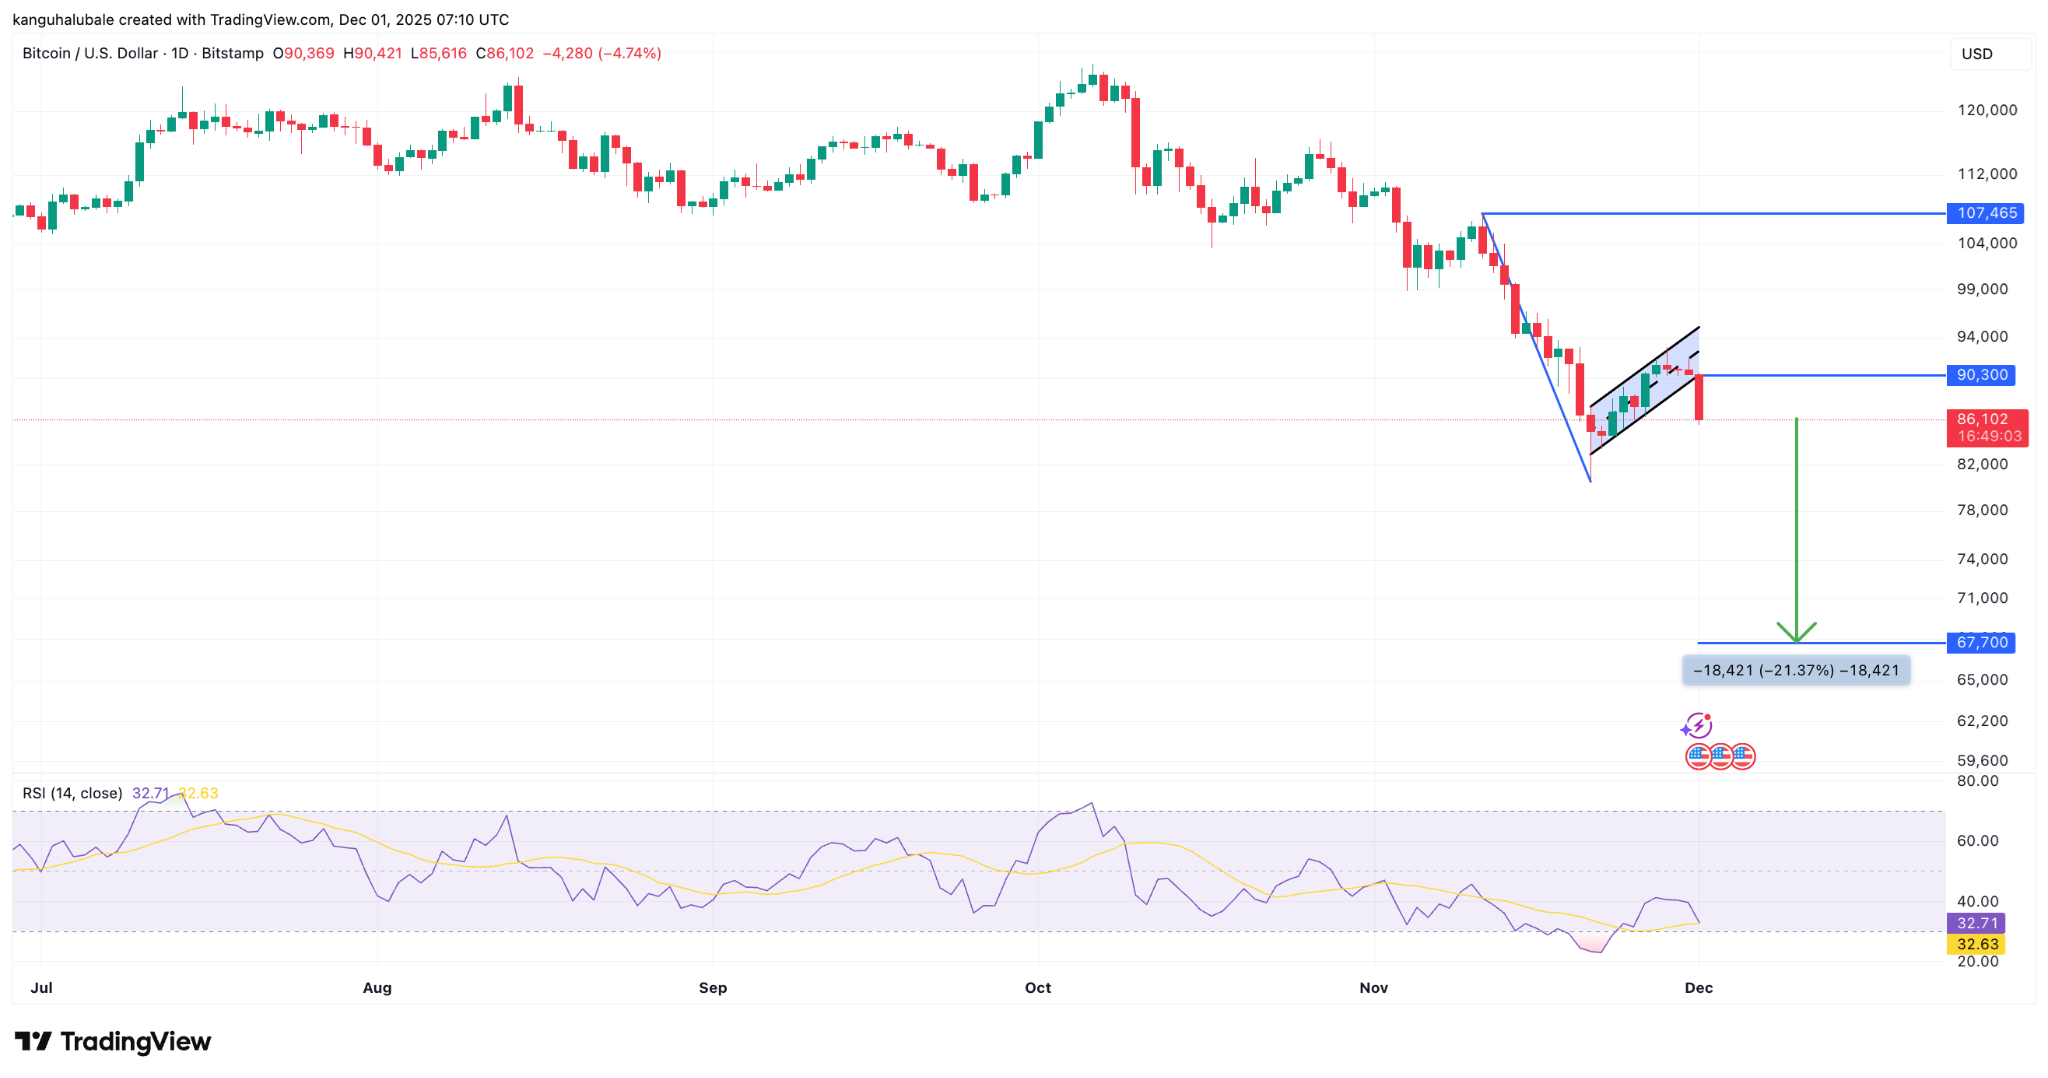
Bitcoin’s bear flag projects a potential drop to $67,700.
Bitcoin wipes out liquidity in tumble to $85,000
BTC price fell as low as $85,616 on Monday, down 5.5% in the past 24 hours, amid a broader market retreat.
This extended the drawdown from the Oct. 6 all-time high of $126,000 to 32% and was accompanied by massive liquidations across the derivatives market.
Related: Fed rate-cut bets surge: Can Bitcoin finally break $91K to go higher?
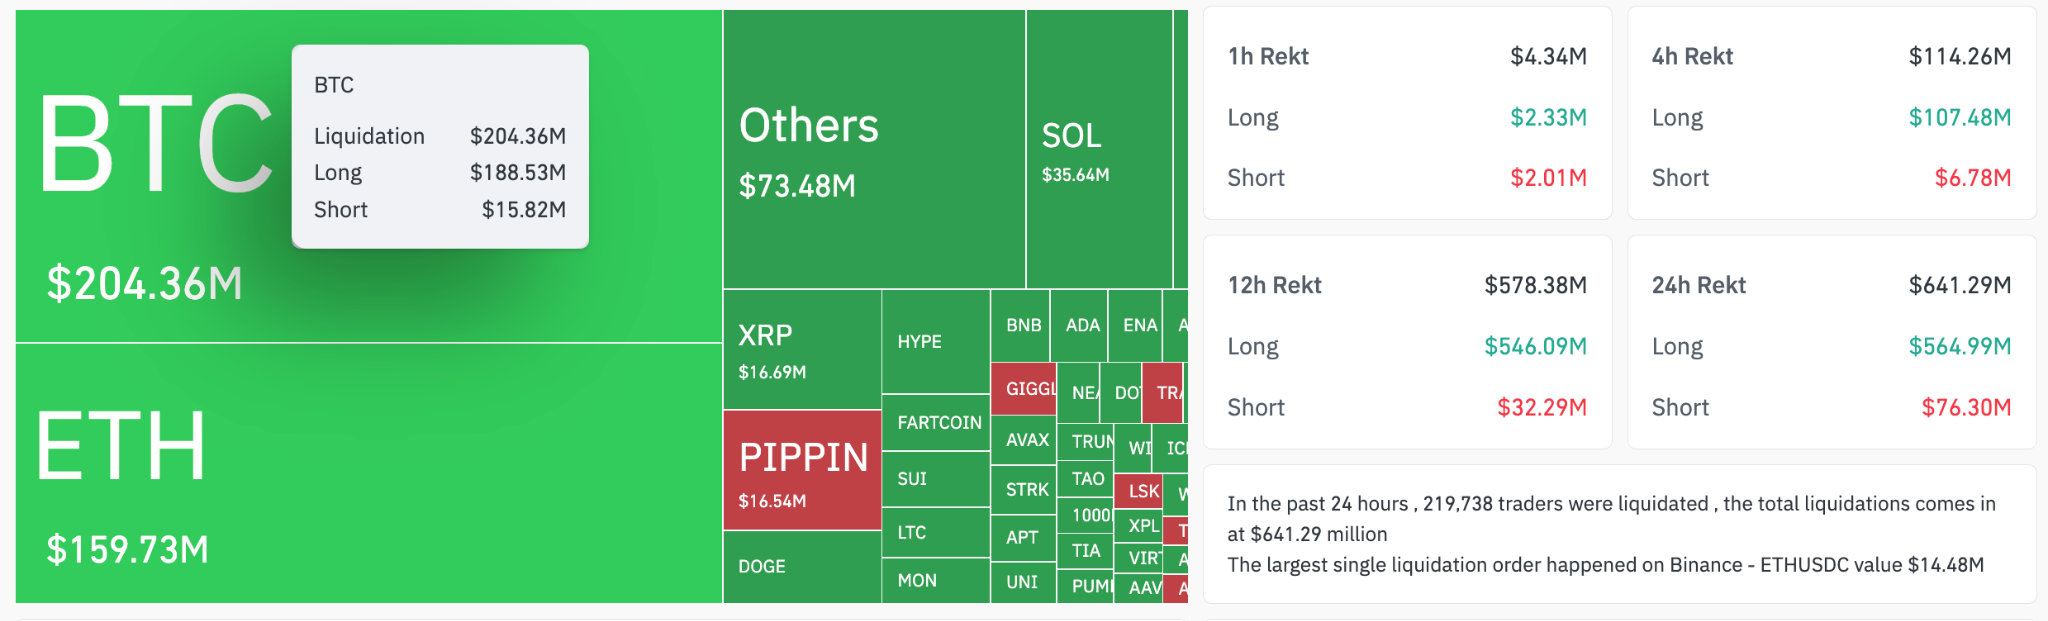
More than $564.3 million in long positions were liquidated, with Bitcoin accounting for $188.5 million of that total. Ether (ETH) followed with $139.6 million in long liquidations.
Across the board, a total of $641 million was wiped out of the market in short and long positions, as shown in the figure below.
Several analysts attribute the downside to surging expectations for a BoJ rate hike at its Dec. 18-19 meeting. This potential tightening — Japan’s first since January — has amplified concerns about unwinding the massive yen carry trade, pressuring risk assets such as cryptocurrencies.
“$BTC dumped cause BOJ put Dec rate hike in play,” said BitMEX co-founder Arthur Hayes in an X post on Monday, adding that a USD/JPY rate of between 155 and 160 “makes BOJ hawkish.”
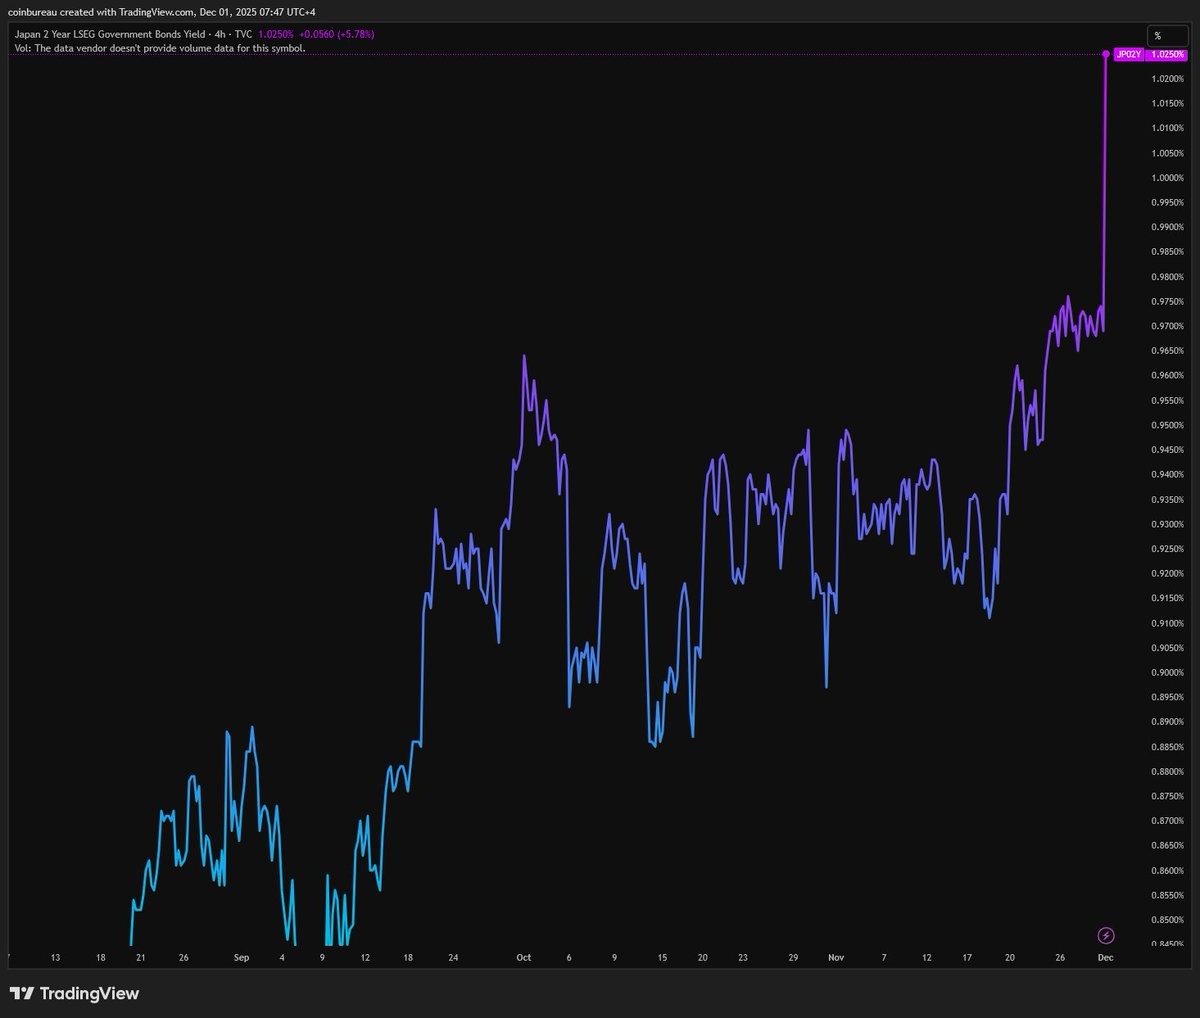
Japanese yields are spiking with the 2-year at its highest level since 2008. The Yen is also surging,” said co-founder and CEO Coinbureau Nic in his latest post on X.
As a result, “bond investors place a 76% chance of a BoJ rate hike on Dec. 19,” Nic wrote, adding:
“An increase in Japanese base rates and strengthening of Yen leads to an unwind of the carry trade (borrowing in Yen, buying risk assets). ”
A Reuters poll shows that 53% of economists expect a hike, up from prior months, driven by risks of imported inflation and fading political pressure for easing. Polymarket bettors now project a 52% chance of a 25 bps increase at the Dec. 19 meeting.
A stronger yen from higher rates makes carry trades costlier, prompting investors to unwind positions en masse. This forces the sale of risk assets, as seen in August 2024, when a surprise BOJ hike triggered a 20% BTC price crash to $49,000 and $1.7 billion in liquidations.
How low can Bitcoin price go?
The Bitcoin liquidation heatmap showed the price eating away liquidity around $86,000, with millions in bid orders still sitting between the spot price and $79,600
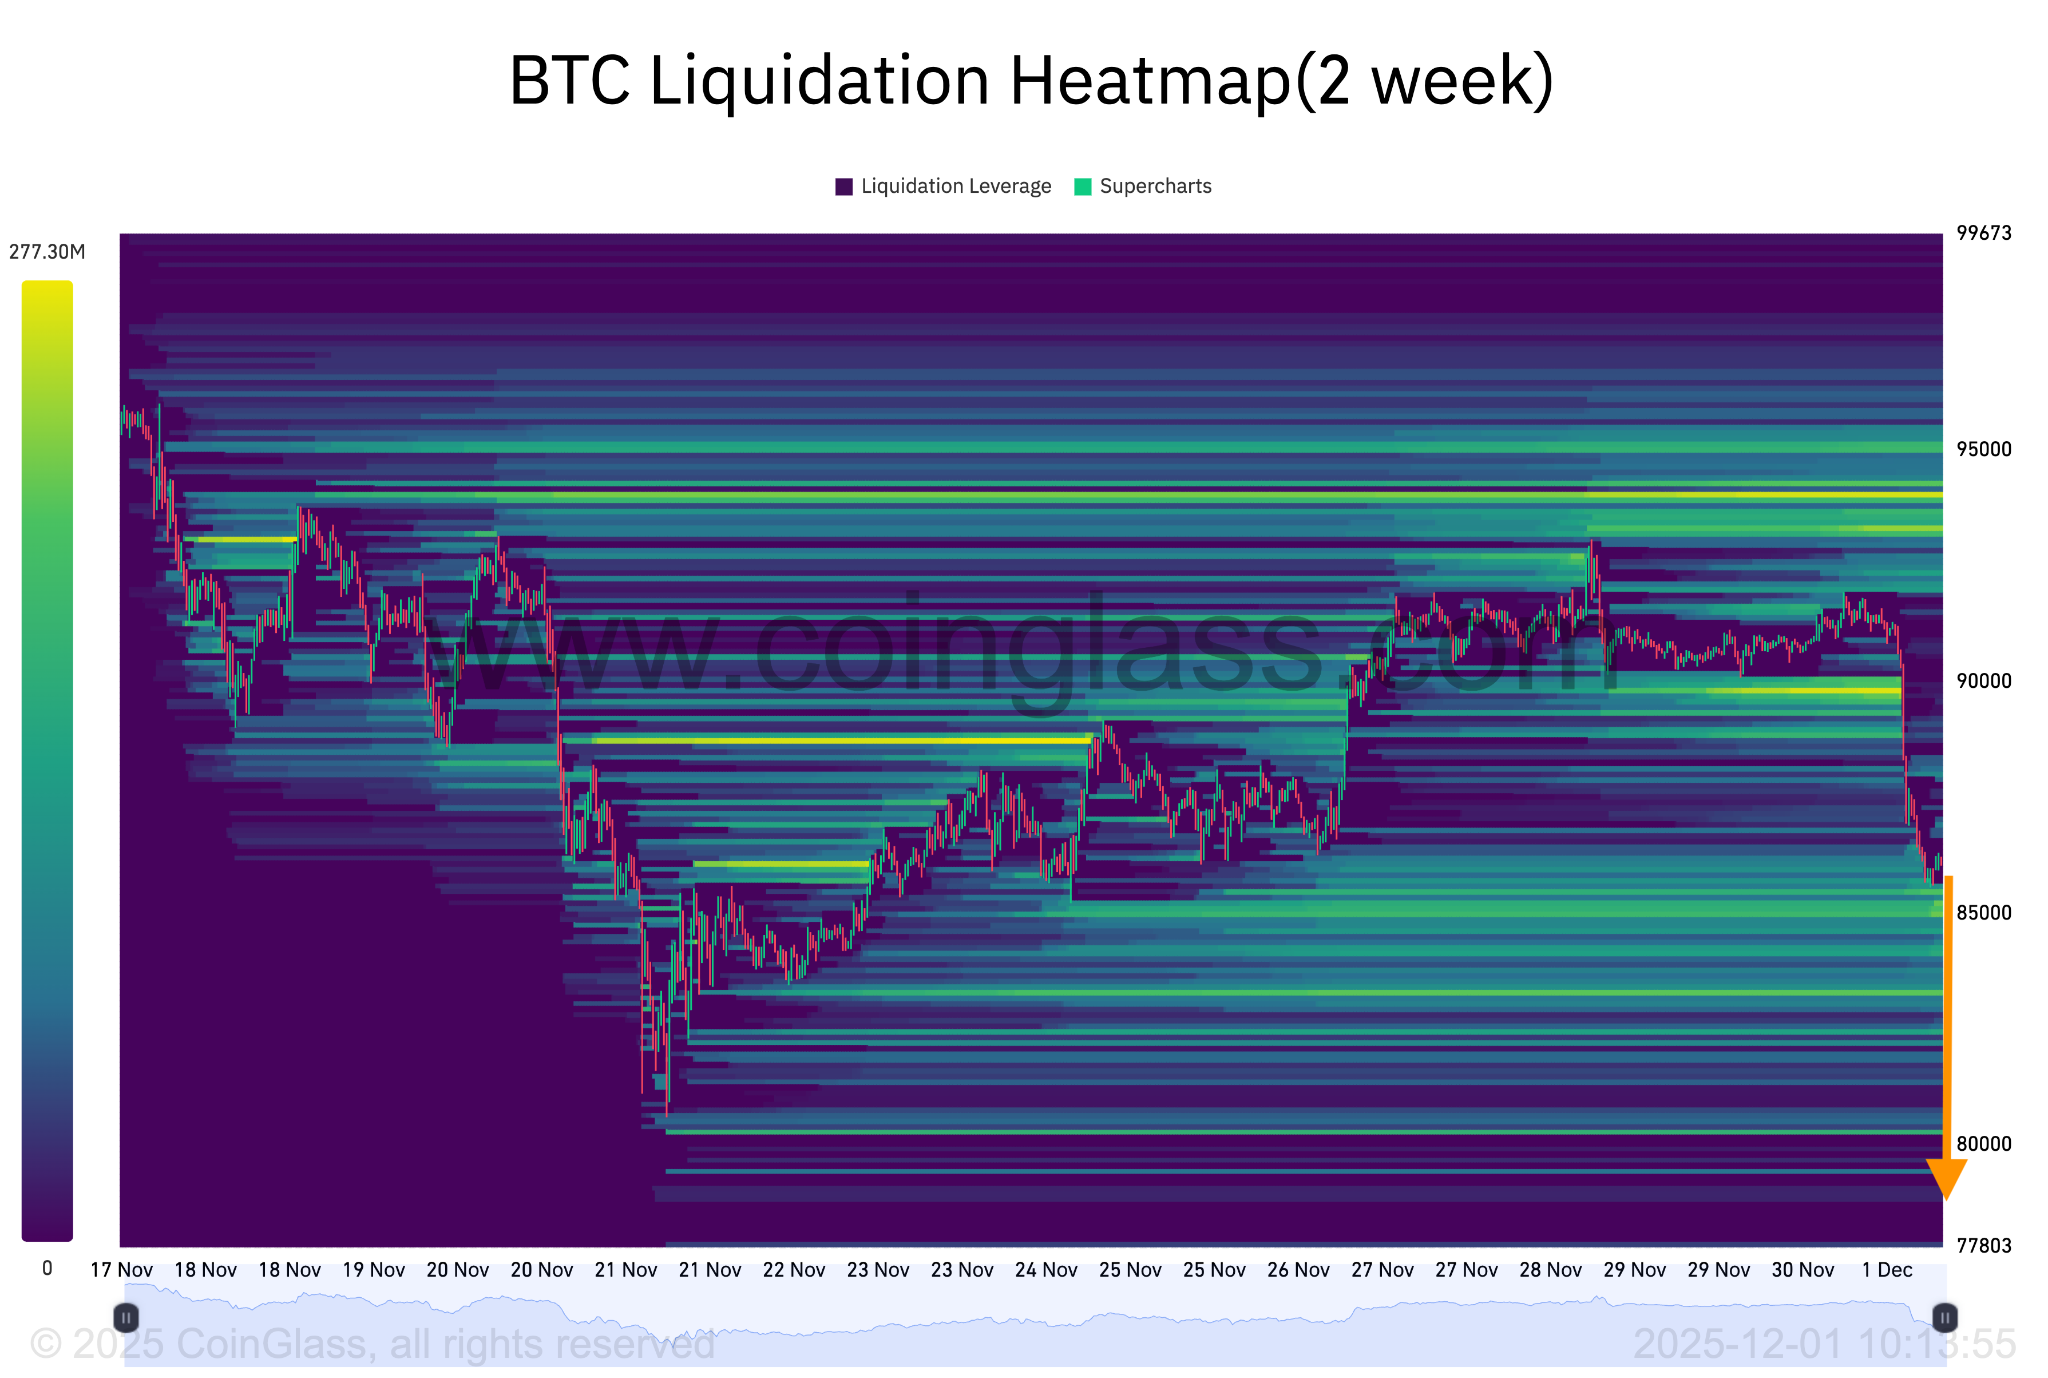
This suggests that Bitcoin’s price might drop further to sweep this liquidity before staging any recovery.
From a technical perspective, the price has validated a bear flag on the daily chart after dropping below the lower boundary of the flag at $90,300 on Monday.
A daily candlestick close below this level will confirm the continuation of the downtrend toward the measured target of the flag at $67,700 (near 2021 all-time highs). Such a move would bring the total losses to $21%.
Veteran trader Peter Brandit shared a chart showing that Bitcoin’s macro downtrend could find support within the lower green zone, which lies between $45,000 and $70,000.
Not to bust anyone’s banana, but the upper boundary of the lower green zone starts at sub $70s with lower boundary support in the mid $40s.
How soon before Saylor’s Shipmates ask about the life-boats? $BTC pic.twitter.com/YLfjSDdw9H— Peter Brandt (@PeterLBrandt) December 1, 2025
As Cointelegraph reported, Bitcoin is following the 2022 bear market trajectory so far, with a near 100% correlation in 2025. The true BTC price rebound may not occur until well into the first quarter of next year if this trend continues.
This article does not contain investment advice or recommendations. Every investment and trading move involves risk, and readers should conduct their own research when making a decision.
