


Bitcoin (BTC) stayed lower into Tuesday’s Wall Street open as traders saw further BTC price downside next.
Key points:
-
Bitcoin shorts pile in ahead of the Wall Street open as Bitcoin and precious metals continue to go separate ways.
-
Moving averages function as stiff resistance as $90,000 remains unbeaten.
-
Bitcoin begins printing bullish divergences against both the US dollar and gold.
BTC price action sees traders bet on buying the dip
Data from TradingView showed BTC/USD trading down around 1% on the day.
After rejecting at $90,000 the day prior, expectations were uninspiring for the pair, which languished while gold and silver hit new all-time highs.
“$BTC Keeps rejecting from its 4H 200MA/EMA Trend,” trader Daan Crypto Trades observed in his latest analysis on X.
“If this wants to get out of this choppy range, that would be the first level that needs to be broken on the upside.”
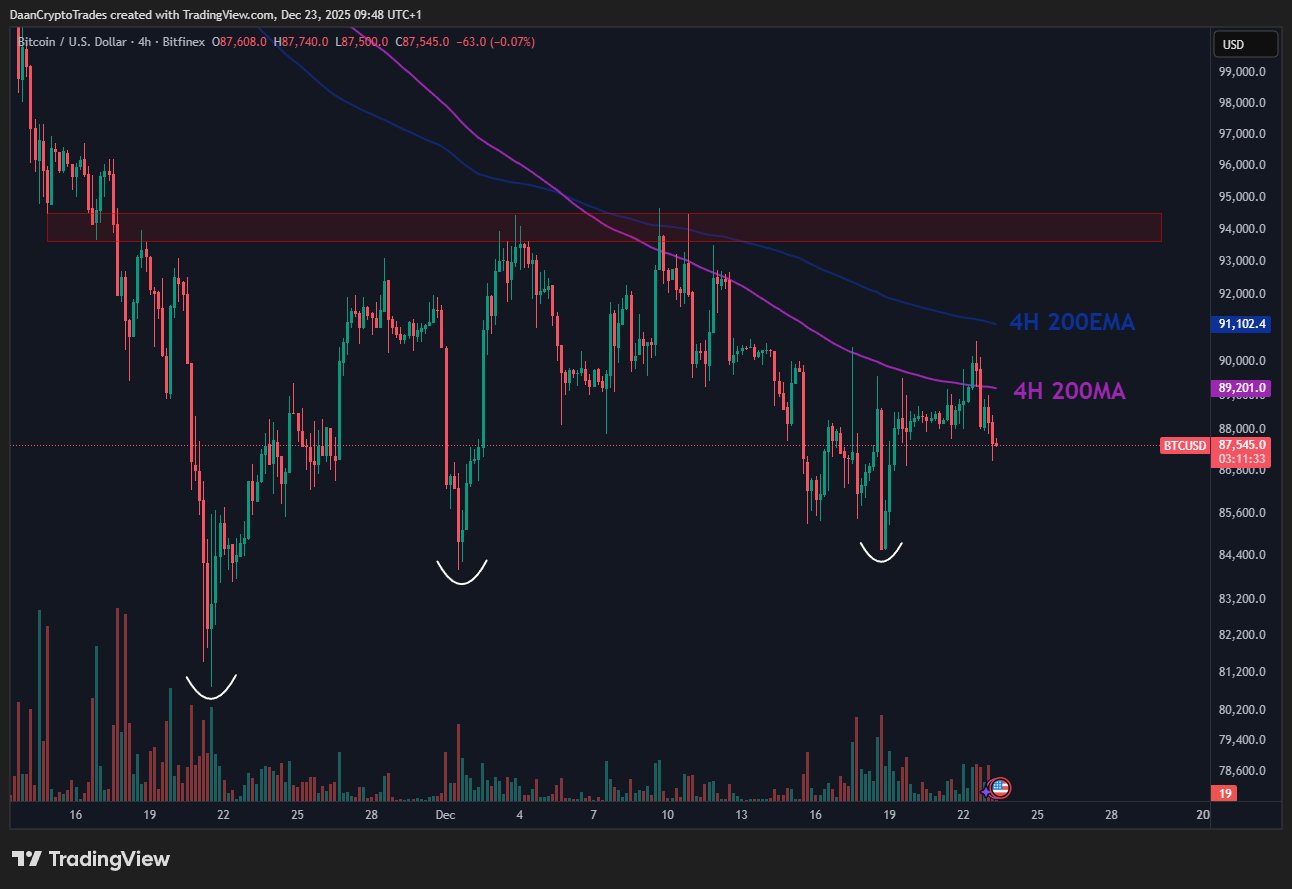
Daan Crypto Trades referred to the 200-period simple (SMA) and exponential (EMA) moving average “cloud” on four-hour timeframes.
Fellow trader Crypto Tony correspondingly decided to wait for new intraday lows for a long entry.
I am waiting today for that move down to $86,800 for a possible long entry upon holding.
Going to get wicky over next few days, but determined to catch the big moves like yesterday pic.twitter.com/vNuNkhEdpv
— Crypto Tony (@CryptoTony__) December 23, 2025
“$BTC is back around the $88,000 level. Any move towards the $90,000 level has faced a lot of selling,” crypto analyst and entrepreneur Ted Pillows agreed.
“Until Bitcoin reclaims that zone, the sideways chop will continue.”
A whale has opened a $166,822,000 $BTC short position.
He has also opened $54,856,000 $ETH and $18,790,000 $SOL short positions. pic.twitter.com/LPd7Iu3EmU
— Ted (@TedPillows) December 23, 2025
Pillows noted that a whale entity had opened short positions on Bitcoin, Ether (ETH) and Solana (SOL) on the day worth almost $250 million.
Bitcoin chart plots gold comeback move
Bullish market takes, meanwhile, focused on a bullish divergence playing out on the three-day chart.
Related: $90K BTC vs. record gold price: 5 things to know in Bitcoin this week
Here, Bitcoin’s relative strength index (RSI) was making higher lows while price made lower lows.
“Pretty sure the bottom is in – and $BTC will push back into six-figure territory soon enough,” trader Jelle commented on the topic.
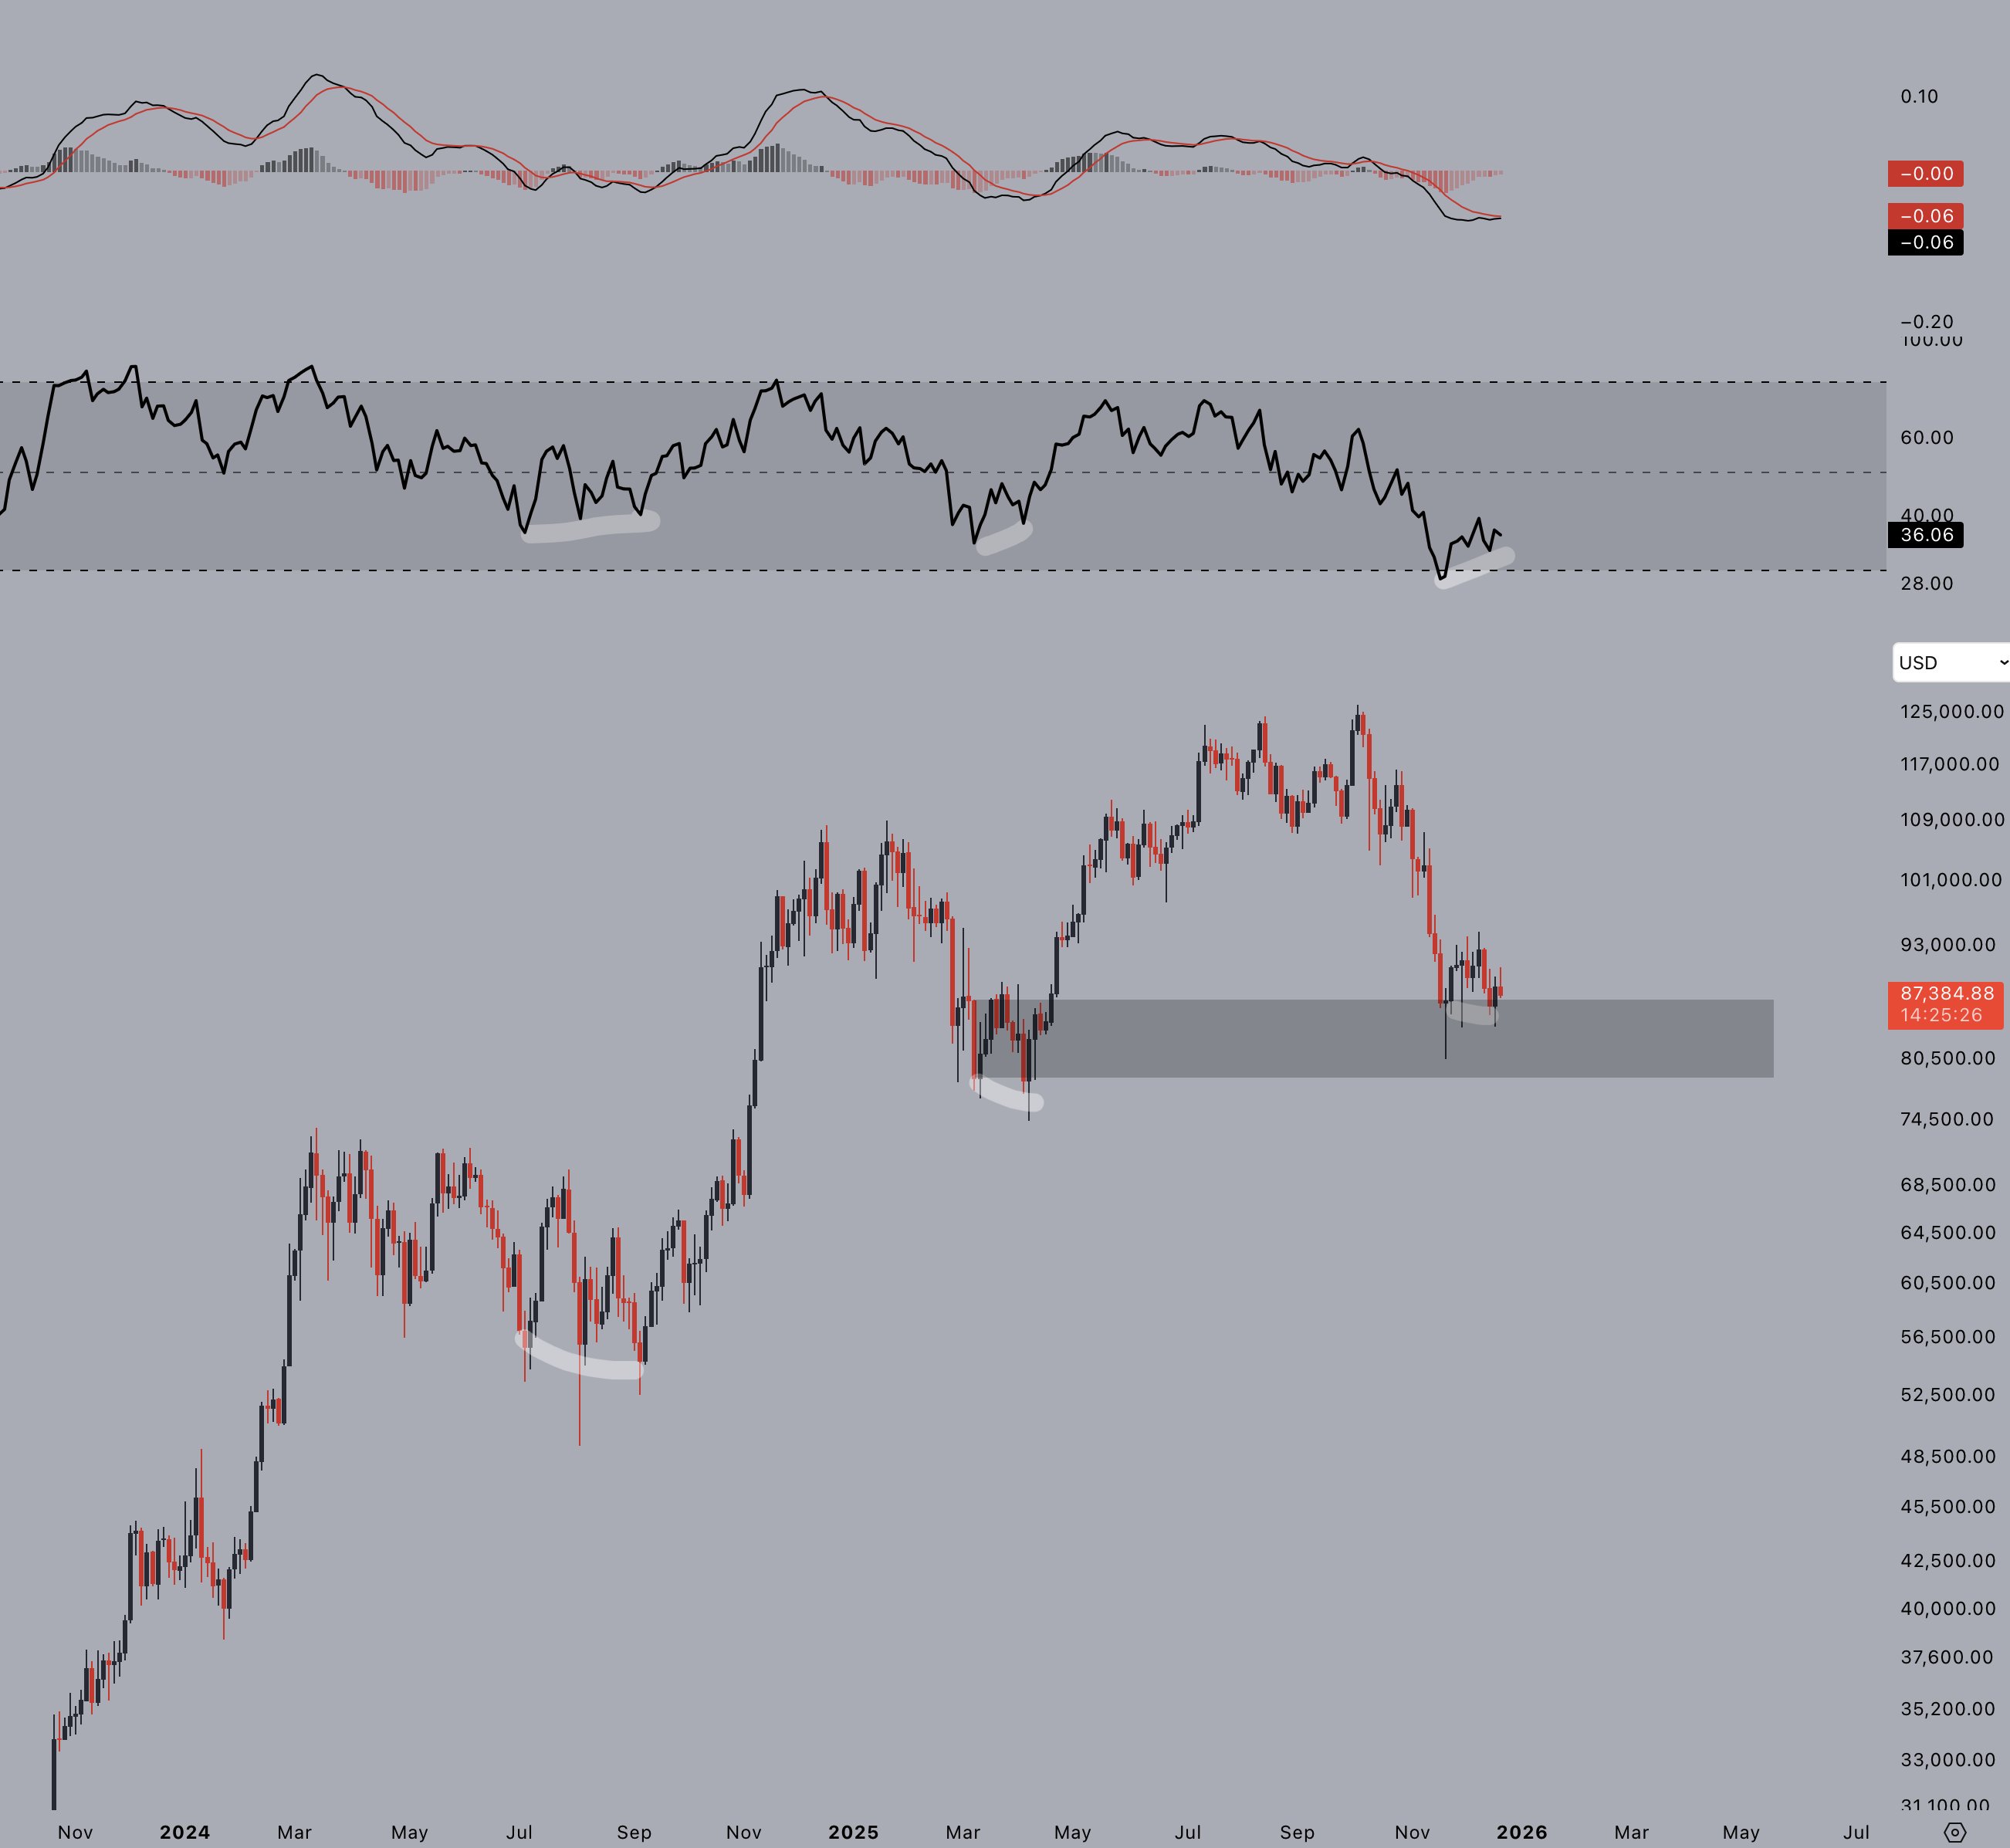
Pillows noted that the previous two three-day bullish divergences had resulted in BTC/USD forming a bottom.
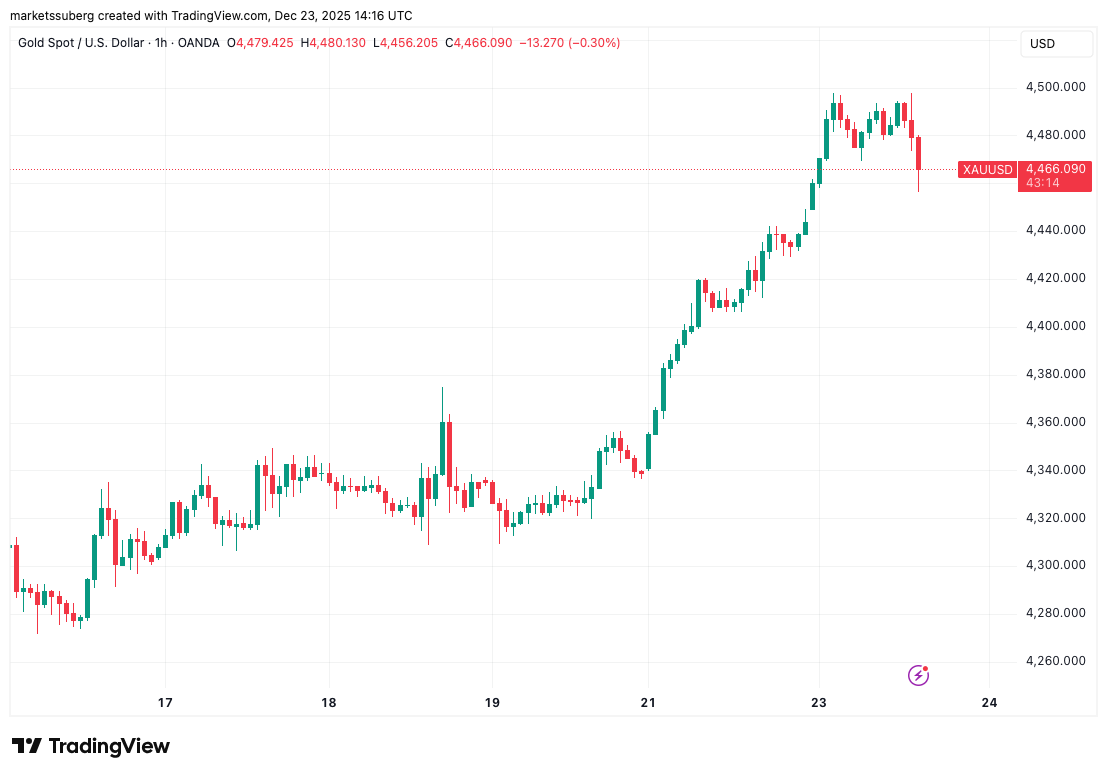
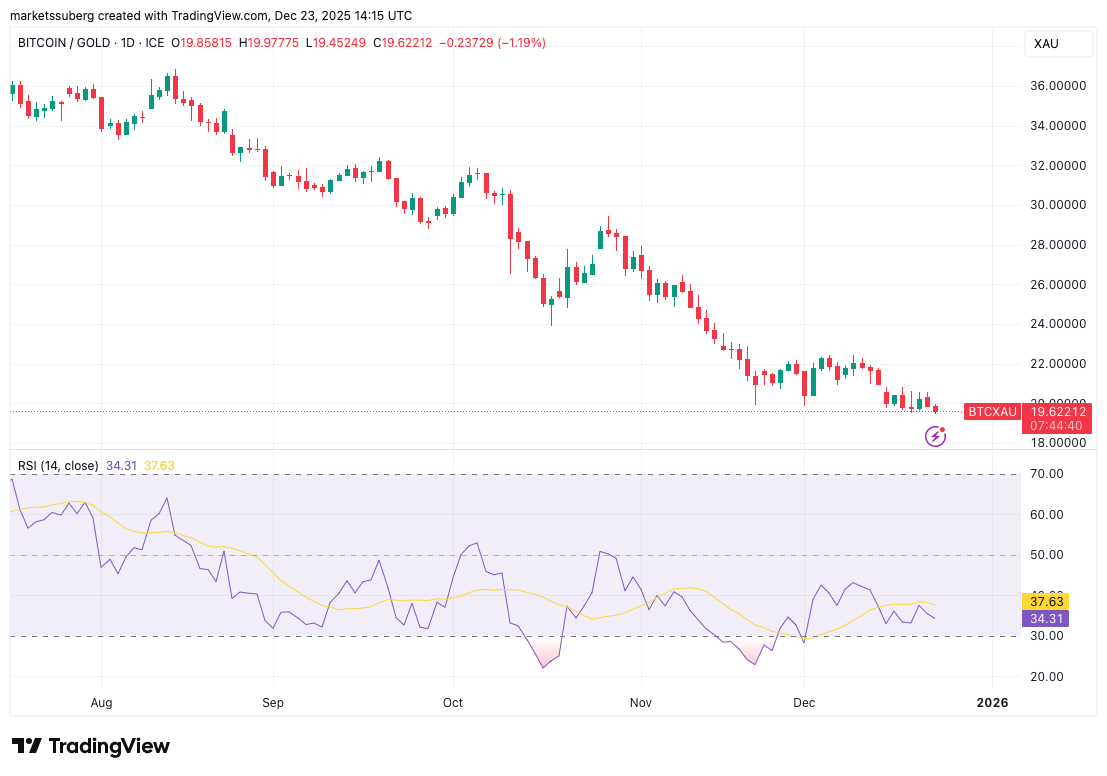
As gold approached $4,500 per ounce, the daily BTC/XAU chart also revealed a bullish divergence forming at key support.
“Gold has pushed to fresh all-time highs, while BTC has remained stubbornly range-bound heading into Christmas week,” trading resource QCP Capital summarized in its latest “US Color” market update on the day.
“Liquidity is thinning meaningfully as traders close out positions ahead of the holidays.”
This article does not contain investment advice or recommendations. Every investment and trading move involves risk, and readers should conduct their own research when making a decision. While we strive to provide accurate and timely information, Cointelegraph does not guarantee the accuracy, completeness, or reliability of any information in this article. This article may contain forward-looking statements that are subject to risks and uncertainties. Cointelegraph will not be liable for any loss or damage arising from your reliance on this information.
This article does not contain investment advice or recommendations. Every investment and trading move involves risk, and readers should conduct their own research when making a decision. While we strive to provide accurate and timely information, Cointelegraph does not guarantee the accuracy, completeness, or reliability of any information in this article. This article may contain forward-looking statements that are subject to risks and uncertainties. Cointelegraph will not be liable for any loss or damage arising from your reliance on this information.
