


Key takeaways:
-
Bitcoin’s weekly close above $115,000 signals bullish strength.
-
BTC’s bull flag breakout could trigger a rally to $120,000.
Bitcoin (BTC) may see further upside over the next few days after BTC/USD ended the second week in the green above $115,000, according to analysts.
Why Bitcoin is bullish above $115,000
Bitcoin price completed its second consecutive week of gains on Sunday, 8% above its Aug. 30 low of $107,270, per data from Cointelegraph Markets Pro and TradingView.
Bitcoin reclaimed the crucial level of $115,000, which has capped the price since Aug. 24.
Trader Titan of Crypto noted that $115,000 was the key level to watch on the weekly time frame.
Related: Bitcoin whale is dumping again as BTC flatlines at $116K
An accompanying chart revealed that this level aligned with the Tenkan, a line in the Ichimoku Cloud indicator that identifies short-term momentum and potential trend changes.
“A confirmed weekly close above it would strongly reinforce the bullish case for #BTC.”
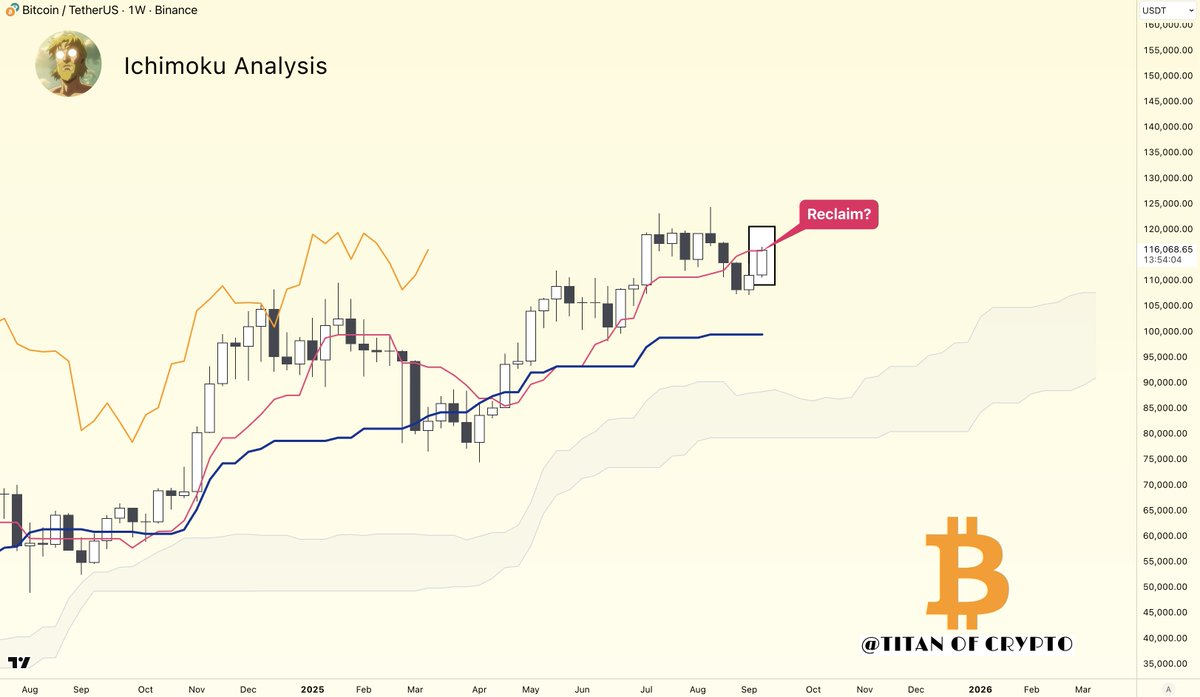
Historically, the price breaking above the Tekan often signals a short-term uptrend, especially when the Cloud itself is in the bullish territory and the price trades above it.
Most recently, the BTC/USD pair rallied 44% to the current all-time highs above $124,500 after the price crossed above the Tenkan in late April.
Analyst AlphaBTC said BTC/USD must hold above $115,000, particularly with volatility expected ahead of FOMC this week.
“A tap of $118K is likely at the start of the week.”
📈#Bitcoin LTF game plan 📈
With the #FOMC Rate decision looming, I would like to see #Bitcoin hold onto the channel and remain above 115K, with a tap of 118K likely at the start of the week.
The Key will be if the markets sell the news as a 25bp cut is announced and prices are… https://t.co/PjcVKnXmGf pic.twitter.com/eVocYnVYAQ
— AlphaBTC (@mark_cullen) September 15, 2025
As Cointelegraph reported, Bitcoin should pay close attention to the $115,000 psychological level going into a key macro week.
BTC price to $120,000 next?
The upcoming FOMC decision on Wednesday, with a 94% chance of a 25 bps rate cut, is a key driver of potential gains for Bitcoin. Lowering interest rates has historically boosted risk assets like BTC, and a dovish tone from Fed Chair Jerome Powell’s speech after the meeting could propel Bitcoin’s price toward $120,000.
From a technical perspective, the BTC/USD pair traded inside a bull flag on the four-hour chart, as shown below.
A four-hour candlestick close above the flag at $115,800 would confirm a bullish breakout, paving the way for a run-up to the technical target of the prevailing chart pattern at $122,000. Such a move would bring the total gains to 6% from the current levels.
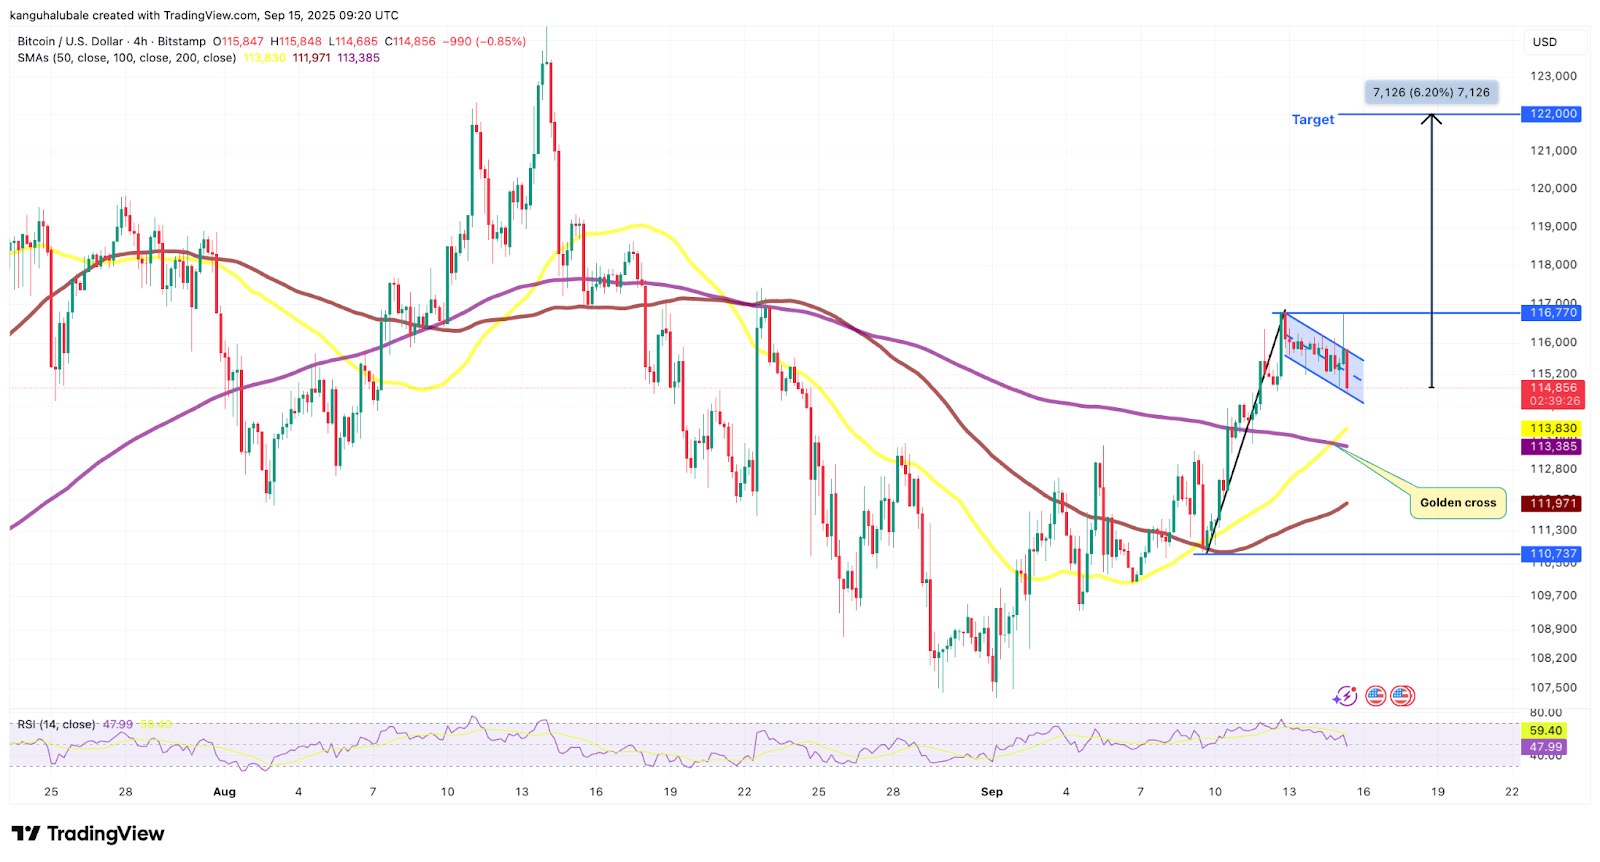
The 50-period and 200-period simple moving averages validated a “golden gross” on Sunday, further reinforcing BTC’s upside potential.
Several analysts project Bitcoin’s short-term rally to $120,000 based on bullish futures data and a potential breakout from an inverse head-and-shoulders pattern.
Analysts like Jelle project a 35% rally to $155,000, citing a bullish signal from the weekly Stochastic RSI.
#Bitcoin locked in a major bullish signal 👀
The weekly stochastic RSI has crossed bullish.
This signal printed 9 times in this cycle alone, leading to an average gain of 35%.
35% from here would mean $155k / BTC.
Send it. pic.twitter.com/gCSkb6E3ha
— Jelle (@CryptoJelleNL) September 15, 2025
This article does not contain investment advice or recommendations. Every investment and trading move involves risk, and readers should conduct their own research when making a decision.
