


Bitcoin (BTC) may form a bottom in the coming weeks as Tether’s USDt (USDT) dominance retests a key resistance level that preceded BTC’s 2022 cycle low.
Tether dominance tops have aligned with BTC bottoms
As of February, Tether dominance reached the 8.50%–9.00% range (the red area in the chart below), revisiting a historically significant zone that previously aligned with Bitcoin’s bear market lows.
When USDt’s market share rises, it usually means traders are playing it safe and parking money in stablecoins instead of riskier coins like Bitcoin. Likewise, a rotation back into crypto usually aligns with USDt dominance falling.
This inverse relationship was especially clear in November 2022, when USDt dominance peaked in the 8.50%–9.00% zone as Bitcoin formed a multimonth bottom near $15,700.
As USDT dominance rolled over from that peak, Bitcoin climbed to above $31,000 by March 2024, nearly doubling while stablecoin dominance trended lower.
A similar pattern repeated in 2023–2024, when Bitcoin price gained nearly 200% a year after USDt dominance topped out.
As a result, Bitcoin’s odds of bottoming in the coming weeks may rise if USDt dominance does not exceed the 8.50%–9.00% range.
Bitcoin chart fractal reinforces bullish scenario
Bitcoin is also showing a familiar combo on the weekly chart that has coincided with macro bottoms in the past.
Specifically, in February, BTC’s weekly relative strength index (RSI) slipped below the oversold threshold of 30. At the same time, its price bounced after testing the 200-week simple moving average (200-week SMA, the blue line).
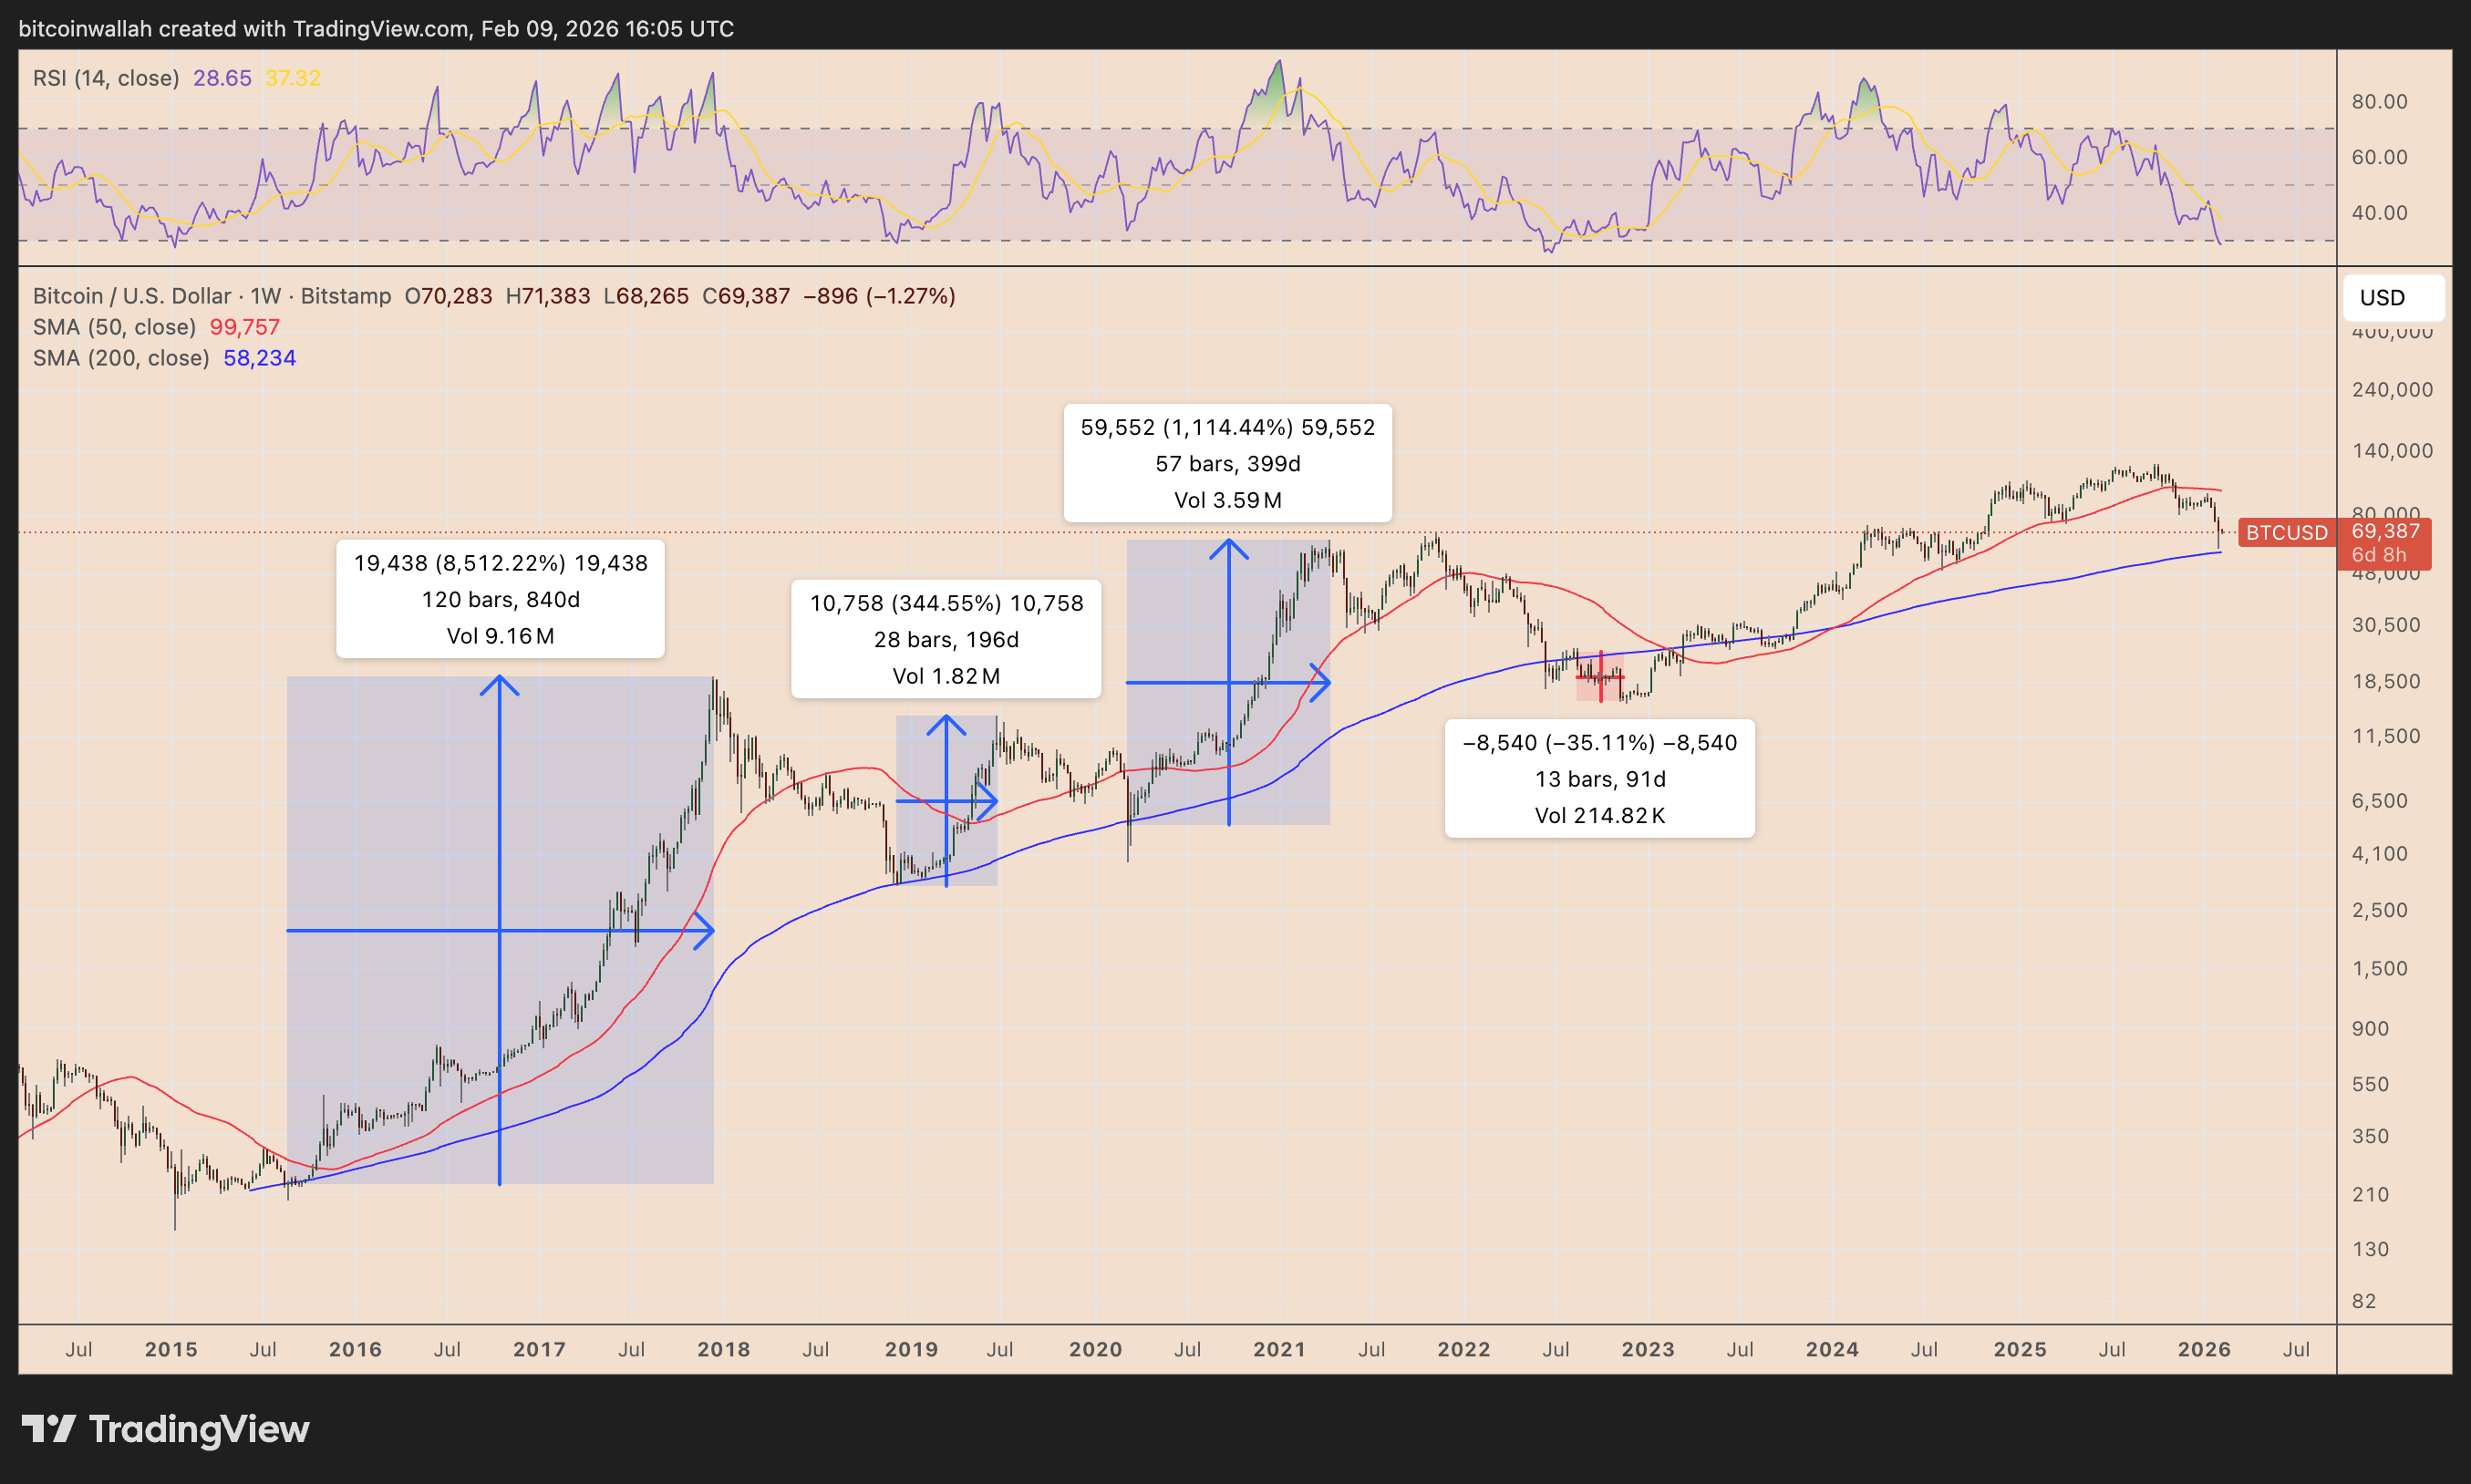
This combination, except for 2022, preceded multimonth price rebounds. That included a 1,115% BTC price rally in 2020-2021, approximately 350% gains in 2018-2019, and a roughly 8,500% price explosion in 2015-2017.
Related: Bitcoin Sharpe ratio slides to levels seen in previous market bottoms
As of February, the “buy-the-dip” sentiment is reflected in real flows. For instance, large Bitcoin holders, or “whales,” took advantage of the BTC price crash below $60,000 to accumulate about 40,000 BTCT.
Also, crypto exchange Binance added about $300 million worth of Bitcoin to its SAFU reserve during the downturn. Strategy also just disclosed a fresh $90 million BTC purchase.
In a Monday note to clients, Bernstein analysts led by Gautam Chhugani described the ongoing BTC price pullback as the “weakest” in history and reiterated a $150,000 BTC target by the end of 2026.
This article does not contain investment advice or recommendations. Every investment and trading move involves risk, and readers should conduct their own research when making a decision. While we strive to provide accurate and timely information, Cointelegraph does not guarantee the accuracy, completeness, or reliability of any information in this article. This article may contain forward-looking statements that are subject to risks and uncertainties. Cointelegraph will not be liable for any loss or damage arising from your reliance on this information.
