


Key points:
-
Bitcoin diverges from stocks and gold to see daily losses of 2% to start the week.
-
Analysis hopes that the upcoming Federal Reserve interest-rate decision will provide a BTC price boost.
-
Hidden bullish divergences strengthen the case for BTC price gains.
Bitcoin (BTC) struggled at $115,000 into Monday’s Wall Street open as analysis saw more BTC price downside.
BTC price sees “classic” downside into FOMC
Data from Cointelegraph Markets Pro and TradingView showed BTC/USD dropping up to 2% versus the day’s highs.
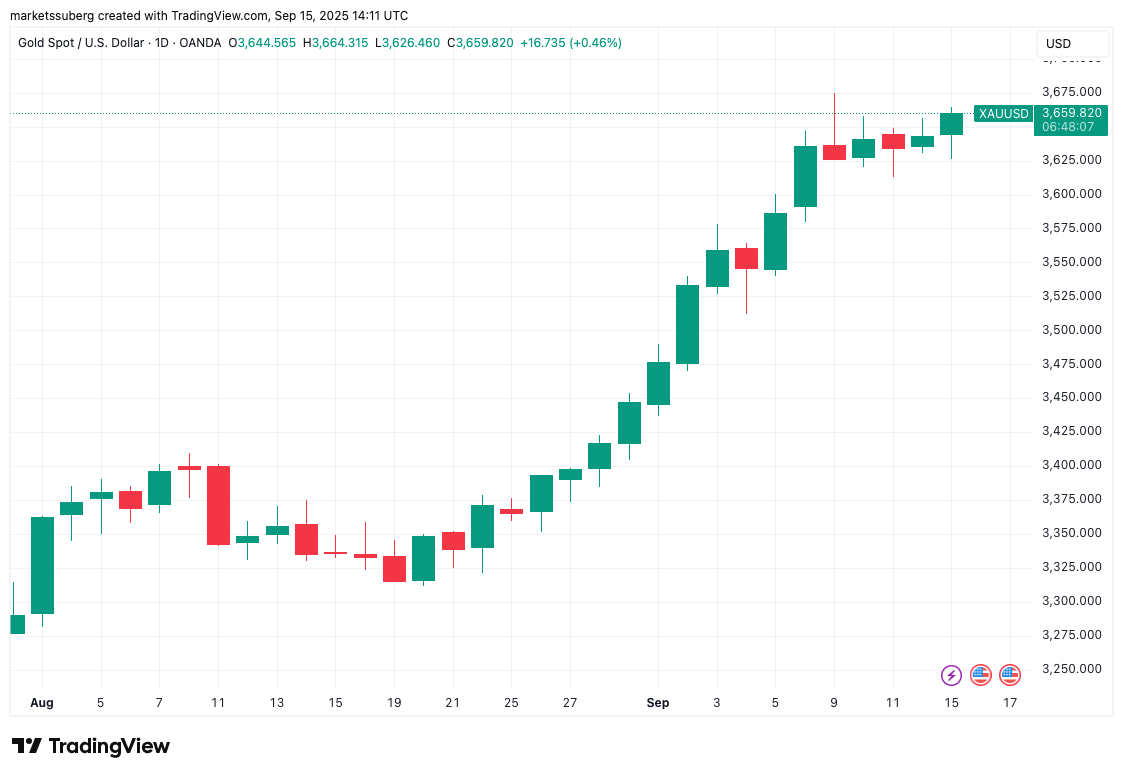
Bitcoin diverged from both gold and US stocks, with the S&P 500 and Nasdaq Composite Index both gaining at the open. Gold price passed $3,655, now under $20 from all-time highs.
Commenting, crypto trader, analyst and entrepreneur Michaël van de Poppe tied BTC price weakness to the week’s key macroeconomic event.
Bitcoin, he argued, traditionally trades down into US Federal Reserve interest-rate decisions.
“Very classic price action prior to the FOMC meeting,” he wrote in part of a post on X.
“Very likely we’ll continue to correct on $BTC & Altcoins until the FOMC meeting has passed.”
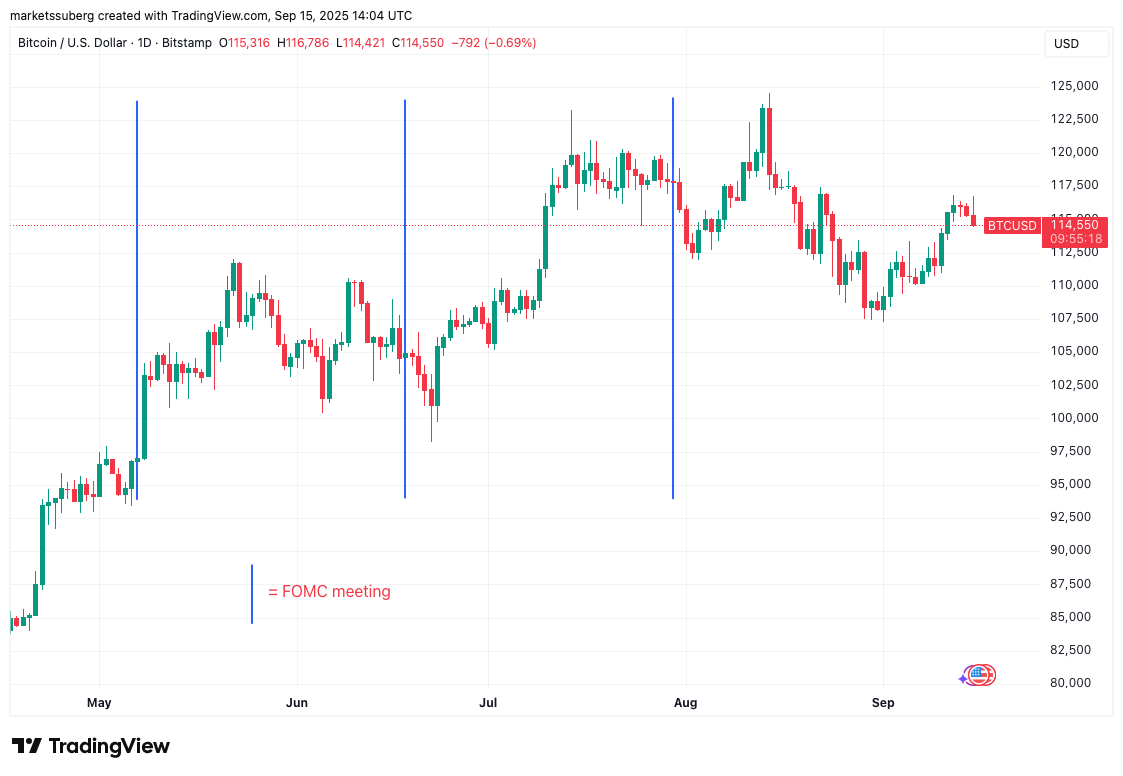
Van de Poppe referred to the Federal Open Market Committee, or FOMC, tipped by markets to deliver a 0.25% rate cut on Wednesday.
While some crypto market participants expressed dismay at Bitcoin’s inability to join risk assets in rallying at the start of the week, others eyed bullish chart cues.
Looks bullish… for Nasdaq pic.twitter.com/IsLUKXz8J8
— WhalePanda (@WhalePanda) September 15, 2025
Among these was a hidden bullish divergence for the relative strength index (RSI) on weekly timeframes.
“Bitcoin weekly hidden bullish divergence is now confirmed,” popular trader BitBull reported.
“Since 2023, every bullish or hidden bullish divergence has played out for $BTC and resulted in big gains.”
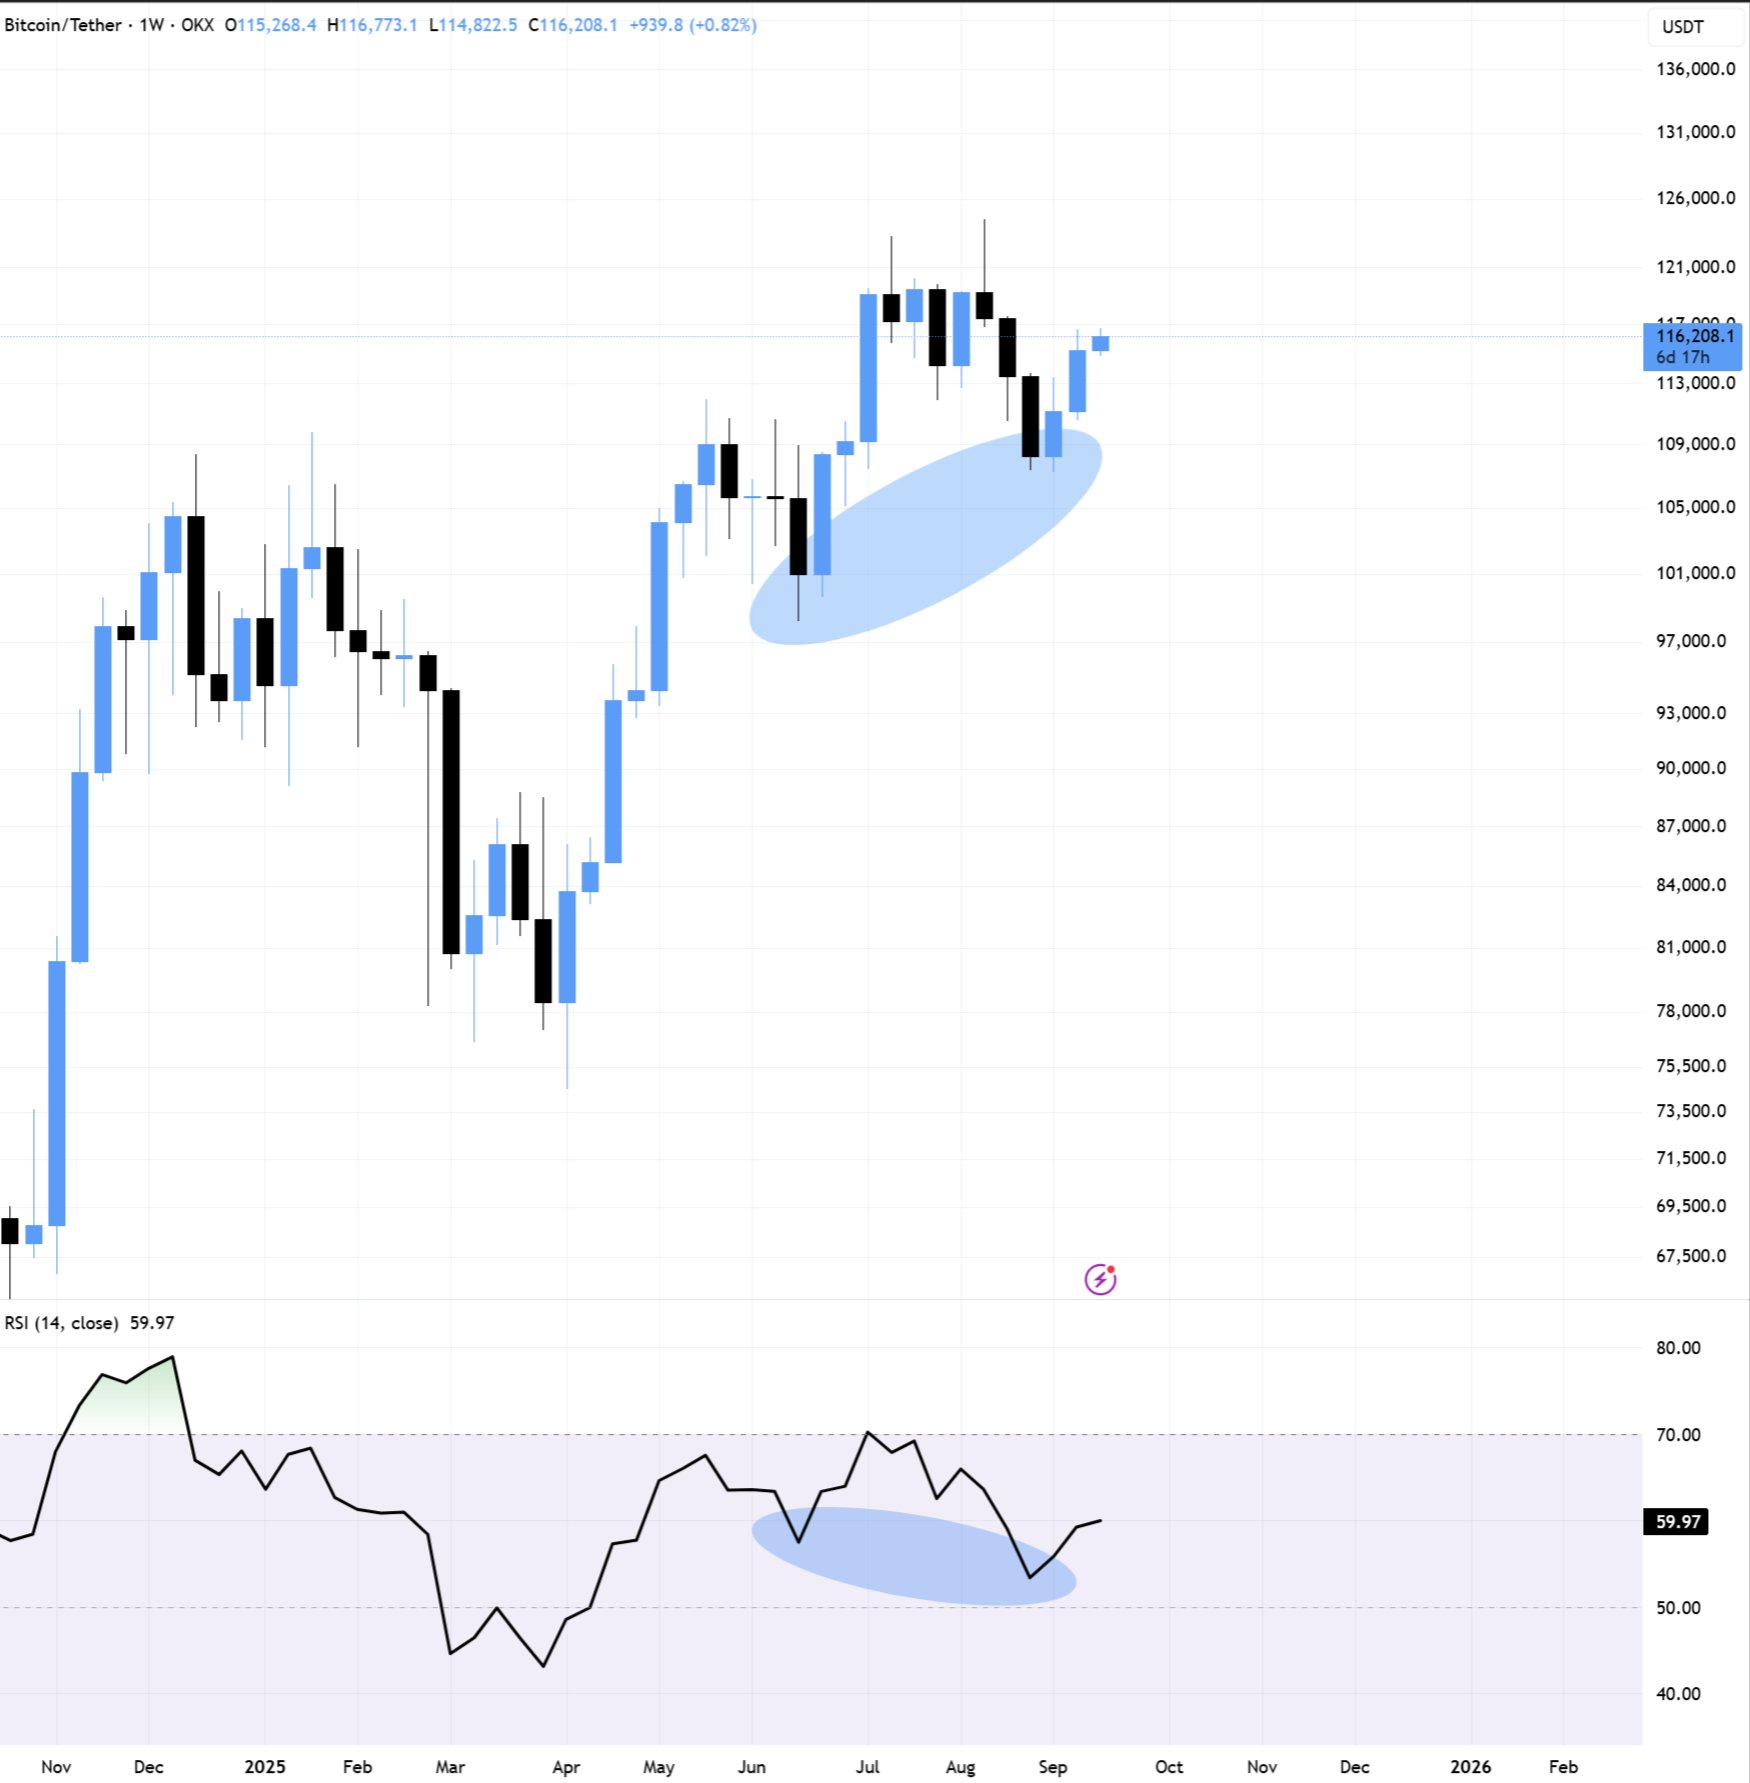
Fellow trader Merlijn argued that the RSI divergence meant that the macro picture was “screaming continuation” higher, calling BTC price upside “inevitable.”
Bitcoin sentiment neutral as stocks climb “wall of worry”
One similarity between Bitcoin and stocks came in the form of market sentiment as the week began.
Related: BTC ‘pricing in’ what’s coming: 5 things to know in Bitcoin this week
Despite the S&P 500 reaching new highs and Bitcoin being not far below price discovery, sentiment was “leaning bearish.”
“If anything, several measures of sentiment shows that fear is the prevailing emotion,” trading firm Mosaic Asset Company wrote in the latest edition of its regular newsletter, “The Market Mosaic.”
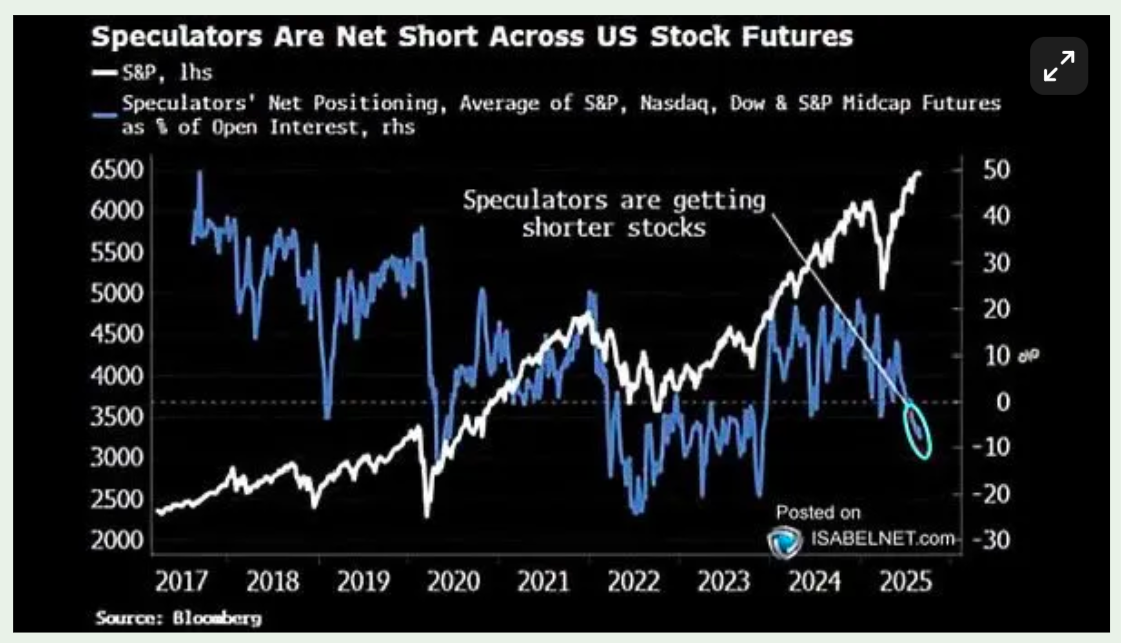
Mosaic observed that large investors were net short across various stocks futures, “where positioning in the group is seen as a contrarian signal.”
“Various measures of sentiment are a tailwind for stock prices as the market climbs a wall of worry,” it added.
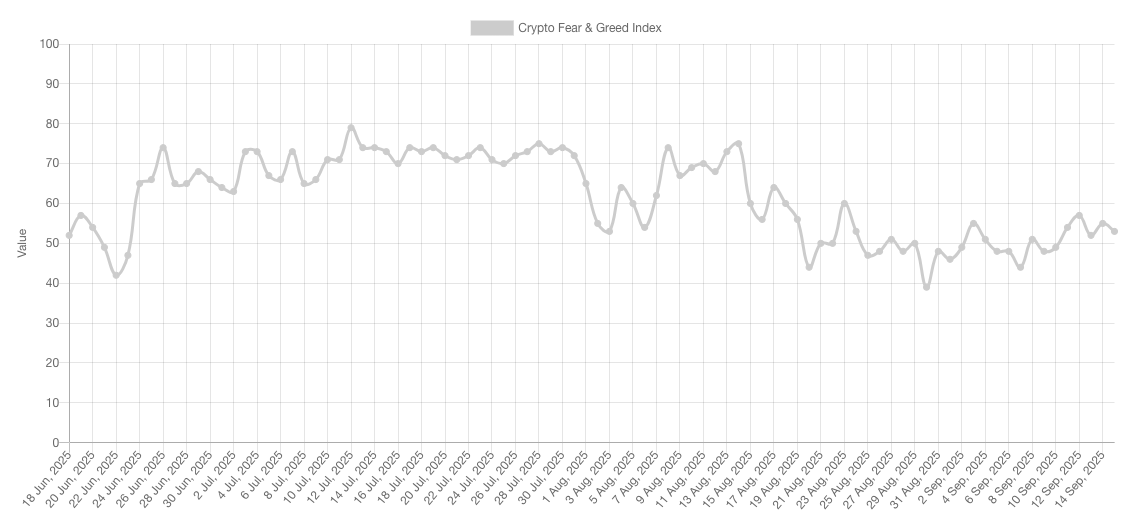
The Crypto Fear & Greed Index remained in neutral territory at 53/100 on the day, far from overheated levels above 95 which traditionally accompany price action near all-time highs.
This article does not contain investment advice or recommendations. Every investment and trading move involves risk, and readers should conduct their own research when making a decision.
