


Bitcoin (BTC) extended its weakness into the low-liquidity weekend trading session, with BTC slipping to a five-week low of $86,000 on Sunday. The cryptocurrency could potentially retest its macro low of $66,000 over the coming weeks, a key support level from November 2024.
Key takeaways:
-
Bitcoin dropped below $87,000 on Sunday as its momentum weakened.
-
The Coinbase Premium hit a 12-month low, reflecting strong US spot Bitcoin selling pressure.
-
Bitcoin’s bearish setup targets a $66,800 BTC price.
Bitcoin faces stronger selling pressure in the US
The Bitcoin Coinbase Premium Index, which tracks the price difference between BTC on Coinbase and Binance, flipped red in mid-December 2025, dropping as low as -0.17. The last time the index was this low was in December 2024.
Related: BTC price ‘bottoming phase’ ends: Five things to know in Bitcoin this week
Even during short-term rebounds, BTC trades at a steady discount on Coinbase versus other major exchanges. The index has stayed negative for more than five weeks now (see the chart below).
“The Coinbase Premium continues to drop sharply and widen, indicating significantly stronger BTC selling pressure on Coinbase compared to other exchanges,” derivatives data provider CoinGlass said in an X post on Monday.
The Coinbase Premium Index is “firmly below zero, showing continued sell pressure from U.S. spot flows,” CryptoQuant analyst TeddyVision said in a recent QuickTake analysis.
Historically, a prolonged negative Coinbase Premium has been associated with “capital moving away from US exchanges, and little evidence of aggressive dip-buying by long-term holders,” the analyst said, adding:
“Until the premium stabilizes and turns positive, the upside remains fragile.”
When the index stayed predominantly negative between Dec. 18, 2024 and Jan. 5, 2025, it was accompanied by an 18% price drop over the same period.
Similarly, the index stayed negative between February 2025 and April 2025, leading to a 32% BTC price drop to $74,500 on April 7, 2025, from its previous all-time high of $109,000.
If US spot demand continues to fade, market participants may see a similar drawdown in BTC price over the coming weeks or months.
Additionally, institutional demand has declined sharply, with US-based spot Bitcoin ETFs recording about $1.72 billion in outflows over the last five days.
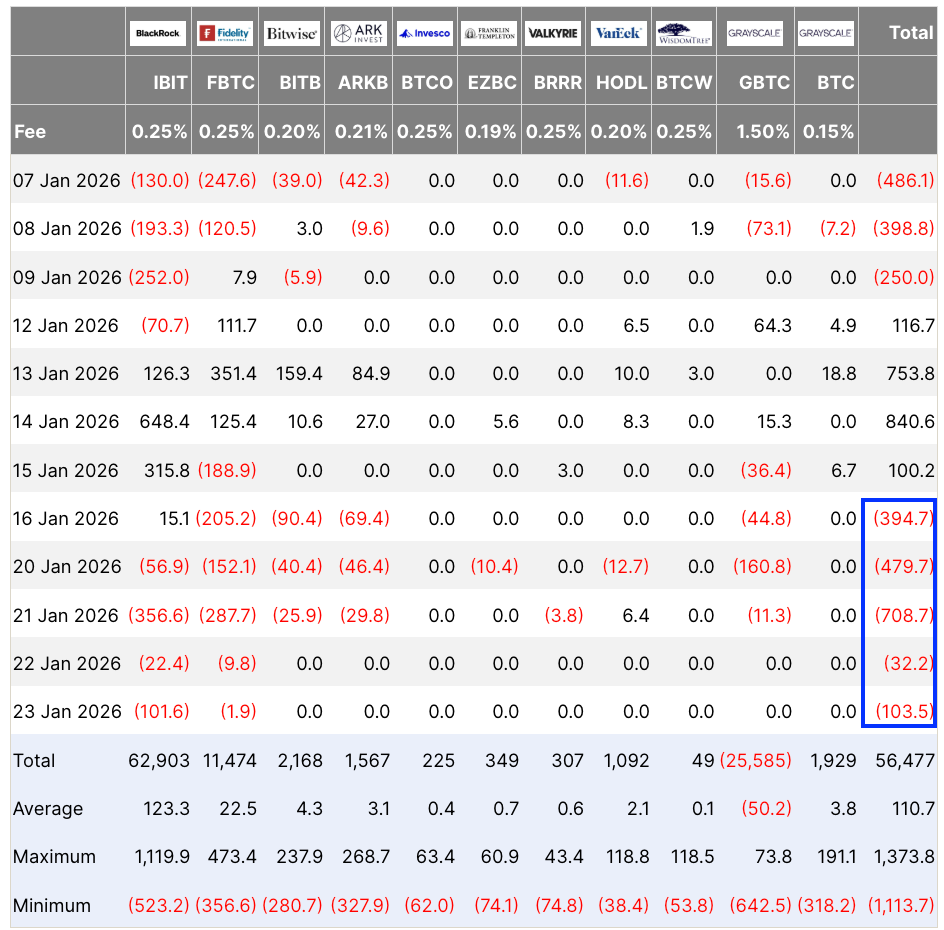
Coupled with more than $1.7 billion in outflows from crypto investment products last week, this points to a persistent bearish sentiment across the market.
How low can Bitcoin price go?
Veteran trader Peter Brandt flagged a “sell signal” after the BTC/USD pair confirmed a bearish technical pattern.
“Yet another sell signal in Bitcoin as a bear channel has been completed,” Brandt said in an X post on Monday.
Brandt’s chart points to more downside risk if the price does not reclaim the $93,000 level as support.
“The price needs to reclaim $93K to negate.”
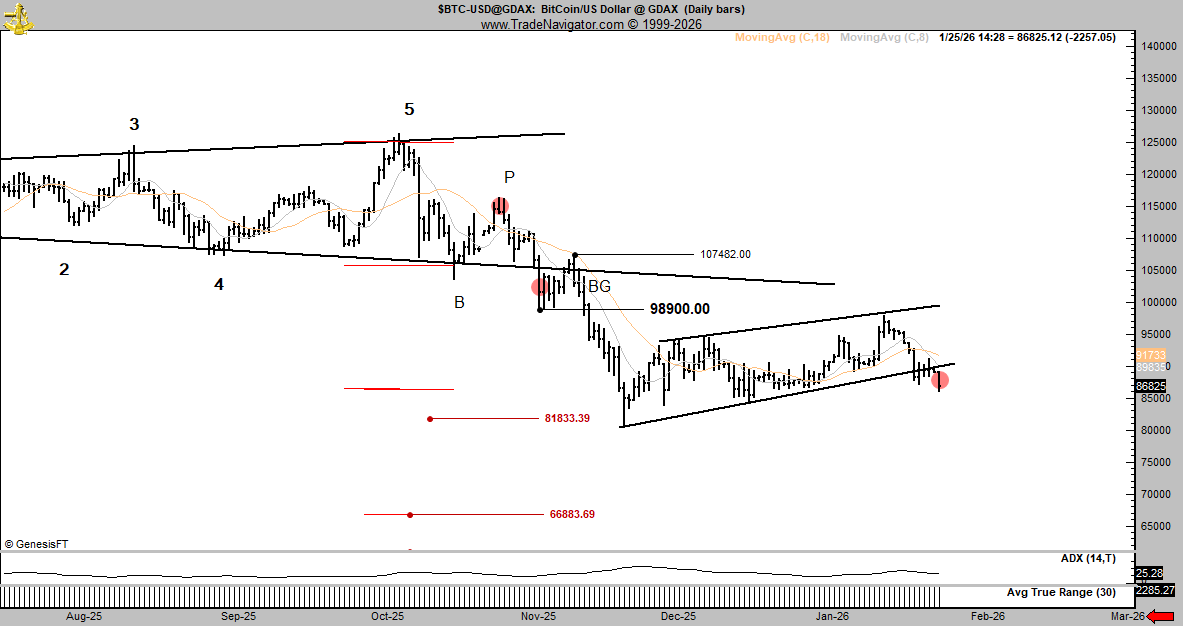
The measured target of the pattern, calculated by adding the height of the initial drop to the breakout point at $90,000, is $66,800, representing a 22% decline from the current price. This level also roughly aligns with previous BTC price highs from 2021 and 2024.
As Cointelegraph reported, the area between $80,000 and $84,000 remains a key support zone for Bitcoin, and holding it is crucial to avoiding further losses.
This article does not contain investment advice or recommendations. Every investment and trading move involves risk, and readers should conduct their own research when making a decision. While we strive to provide accurate and timely information, Cointelegraph does not guarantee the accuracy, completeness, or reliability of any information in this article. This article may contain forward-looking statements that are subject to risks and uncertainties. Cointelegraph will not be liable for any loss or damage arising from your reliance on this information.
