


Key points:
-
Bitcoin could reach the $94,789 level, where the bears are expected to step in.
-
Select major altcoins are showing strength, indicating that the recovery may continue for some more time.
Bitcoin (BTC) bulls have pushed the price above $92,000, but higher levels may attract sellers. The net outflows of $1.37 billion from BTC exchange-traded funds from Tuesday to Friday last week, according to SoSoValue data, show that institutional investors remain cautious.
Fidelity Investments director of global macro Jurrien Timmer said in a post on X that BTC is “following the internet S-curve a lot closer now than the power law curve.” He added that if BTC consolidates for the next year, then the $65,000 level “could become a do-or-die line in the sand” for BTC.
Irrespective of the near-term uncertainty, the world’s largest corporate BTC holder, Strategy, added 13,627 BTC to its balance sheet last week at an average price of $91,519 per coin. That boosts the company’s holdings to 687,410 BTC, acquired at an average price of $75,353 per coin.
Could BTC and the major altcoins break above their overhead resistance levels? Let’s analyze the charts of the top 10 cryptocurrencies to find out.
S&P 500 Index price prediction
The S&P 500 Index (SPX) rallied to a new all-time high on Friday, signaling the resumption of the uptrend.
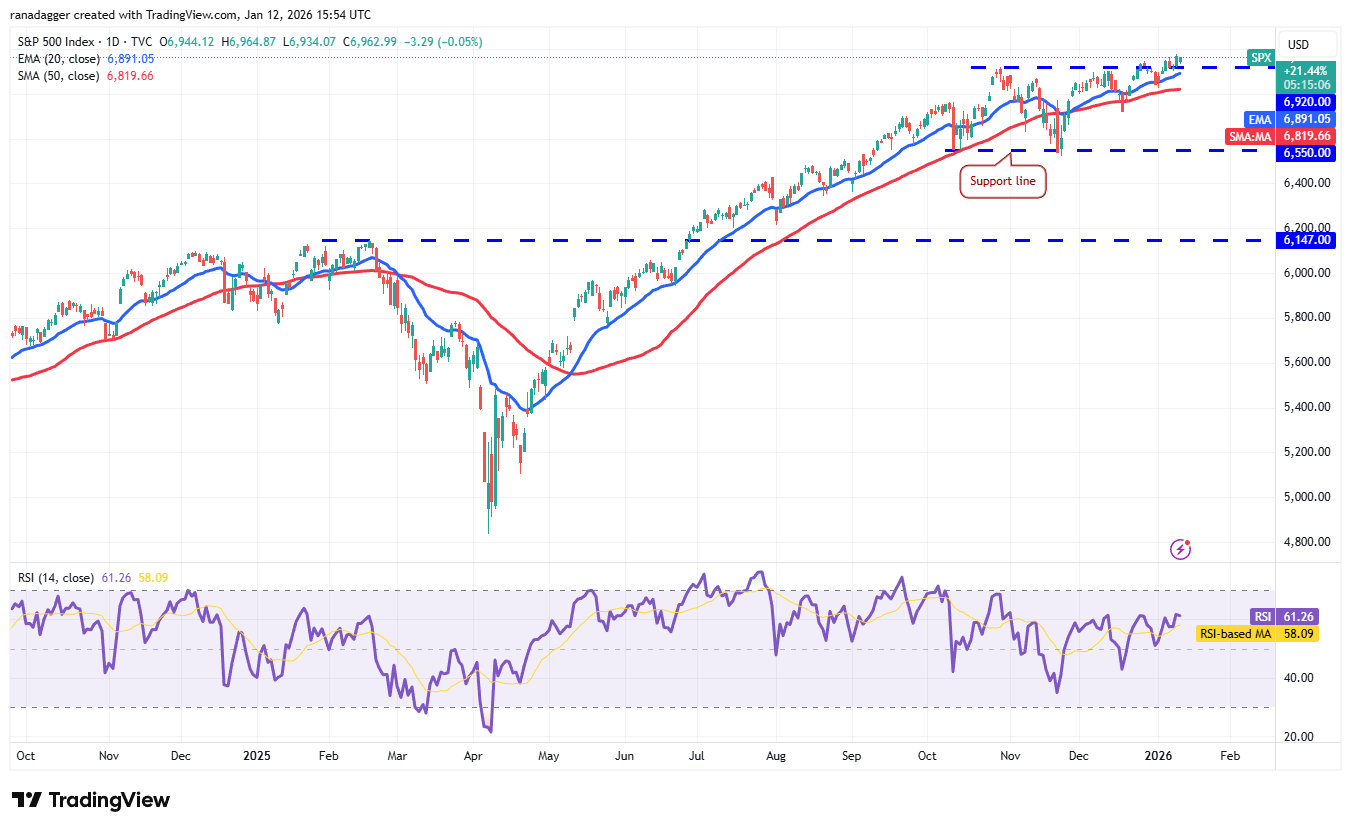
The upsloping moving averages and the relative strength index (RSI) in the positive territory indicate an advantage to buyers. There is resistance at the 7,000 level, but it is likely to be crossed. The index could then surge to 7,290.
Time is running out for the bears. They will have to yank the price below the 50-day simple moving average (6,819) to weaken the bullish momentum. The index could then drop to the 6,720 level.
US Dollar Index price prediction
The US Dollar Index (DXY) cleared the 50-day SMA (99.06) on Friday, but the bulls could not sustain the higher levels.
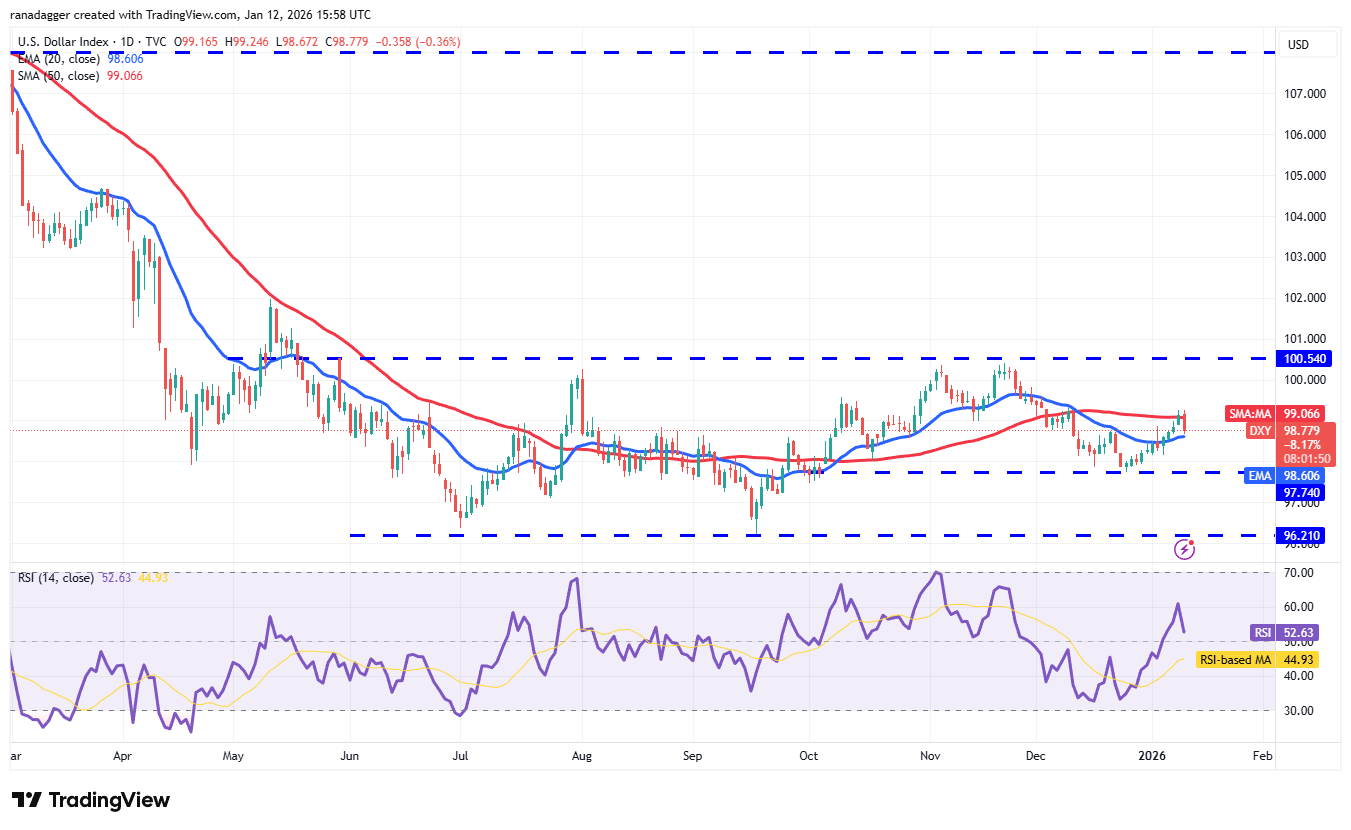
The index has slipped to the 20-day exponential moving average (98.60), which is likely to act as support. If the price rebounds off the 20-day EMA, it increases the possibility of a rally to the overhead resistance at 100.54. A close above the 100.54 level signals the start of a new up move.
Sellers are likely to have other plans. They will attempt to pull the price below the 20-day EMA. If they do that, the index could slide to the solid support at 97.74. That suggests the index may remain inside the 96.21 to 100.54 range for some more time.
Bitcoin price prediction
BTC’s pullback from the $94,789 resistance took support at the moving averages, indicating buying on dips.
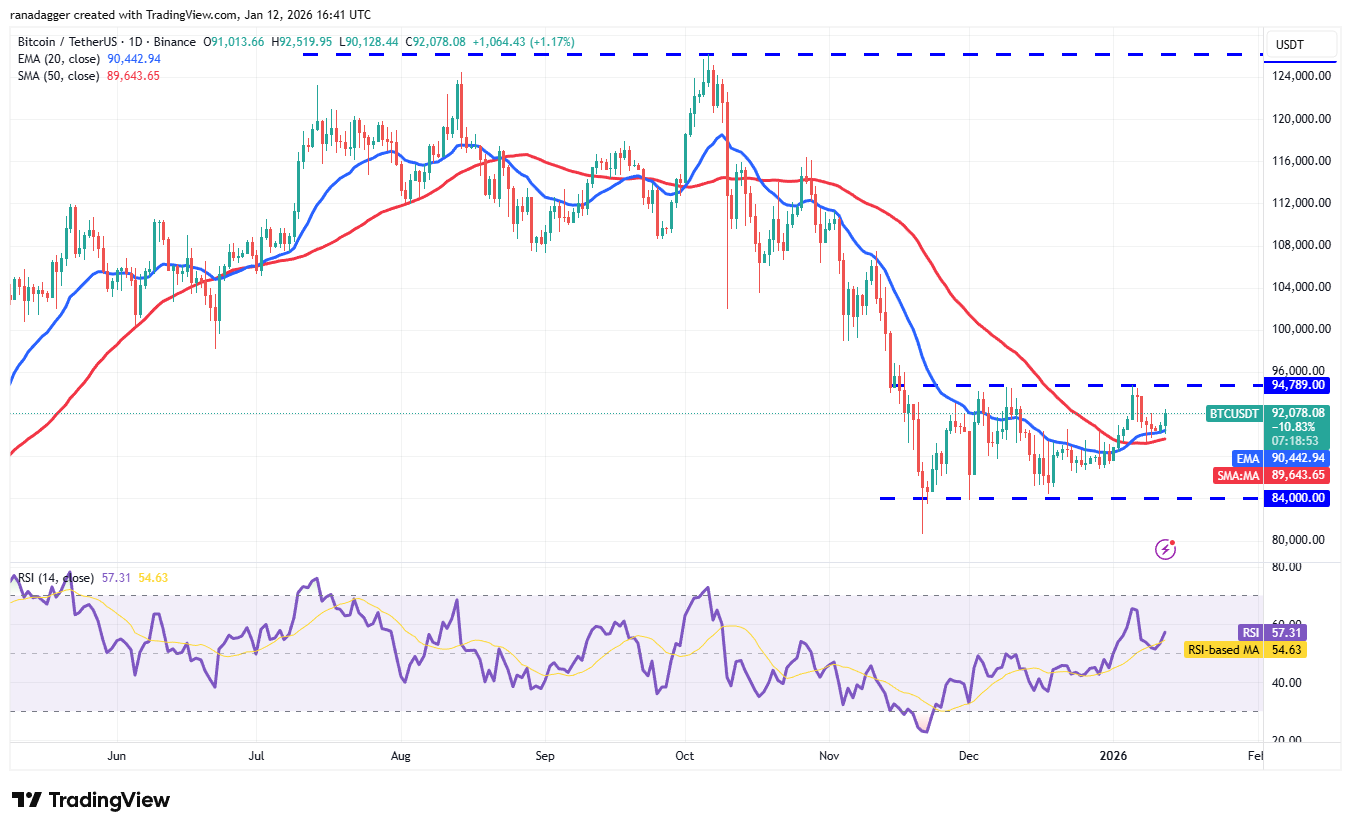
The bulls will try to strengthen their position by pushing the Bitcoin price above the $94,789 level. If they succeed, the BTC/USDT pair could surge to the $100,000 level and then to $107,500. Such a move suggests the corrective phase may be over.
On the contrary, if the price turns down from $94,789 and breaks below the moving averages, it signals that the bears remain active at higher levels. That could keep the pair stuck inside the $84,000 to $94,789 range for some more time.
Ether price prediction
Ether (ETH) has turned up from the 20-day EMA ($3,088), indicating that the bulls are attempting to seize control.
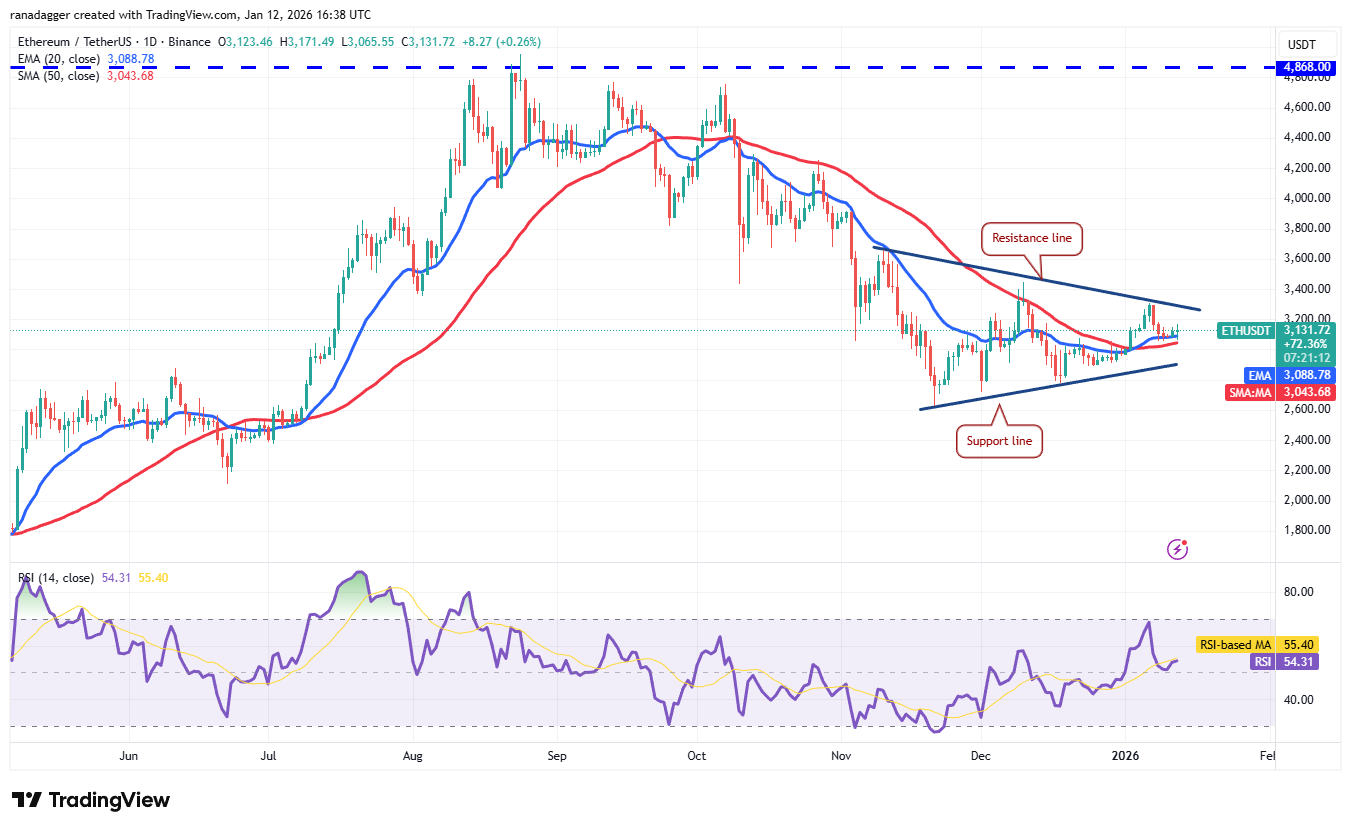
A close above the resistance line tilts the advantage in favor of the buyers. The ETH/USDT pair could rally to $3,569 and later to $4,000.
On the other hand, if the price turns down from the resistance line and breaks below the moving averages, it suggests that the pair may remain inside the triangle for a few more days. The bears will gain the upper hand on a break below the support line. The Ether price could then collapse to $2,623.
XRP price prediction
Buyers are attempting to maintain XRP (XRP) above the moving averages, but the bears have kept up the pressure.
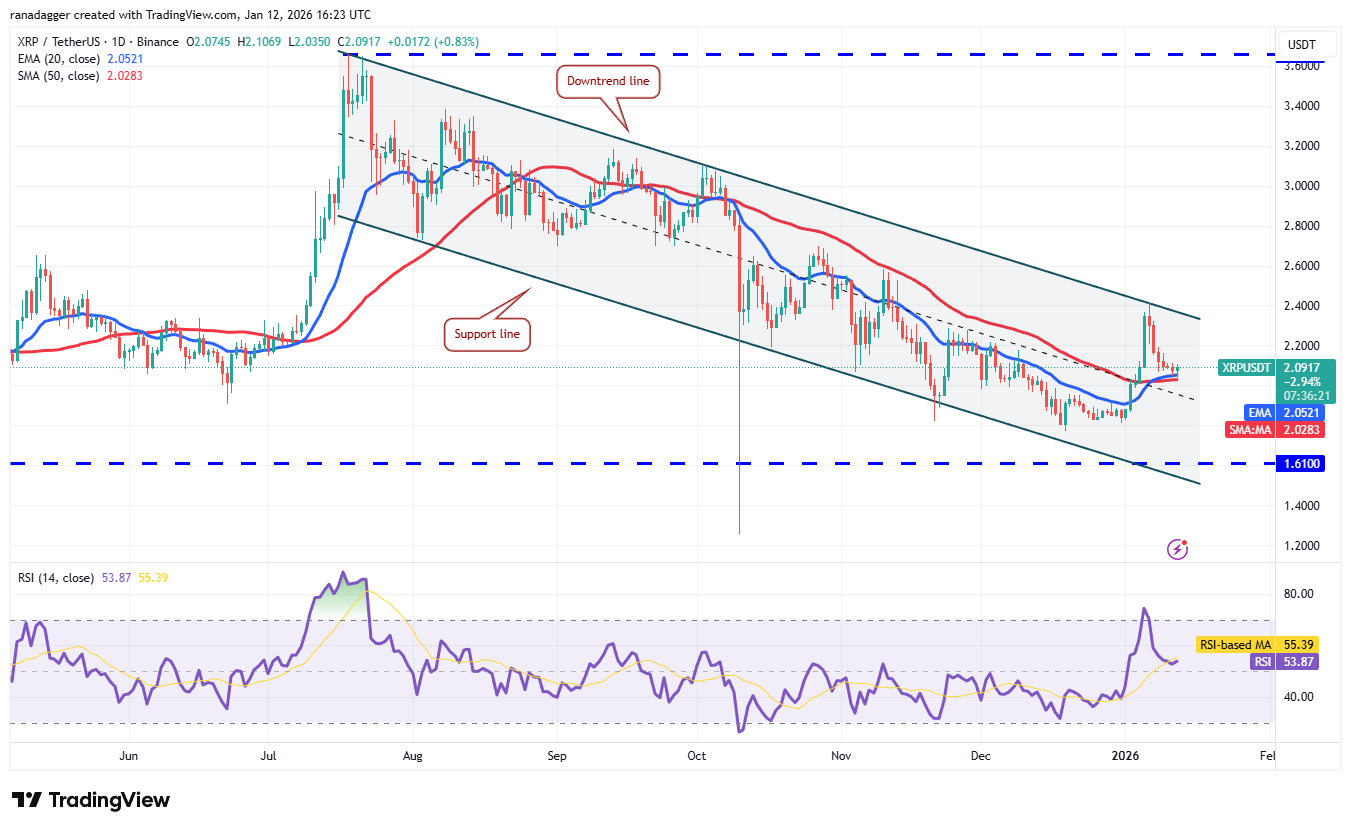
If the price dives below the moving averages, it suggests that the XRP/USDT pair may remain inside the descending channel pattern for a while longer. The $1.61 level is the crucial support to watch out for on the downside. A break and close below the $1.61 level increases the risk of a drop to the Oct. 10 low of $1.25.
Buyers will have to propel the XRP price above the downtrend line to signal a short-term trend change. The pair could soar to $2.70 and subsequently to $3.10.
BNB price prediction
BNB (BNB) has been trading inside a narrow range between the moving averages and the $928 overhead resistance.
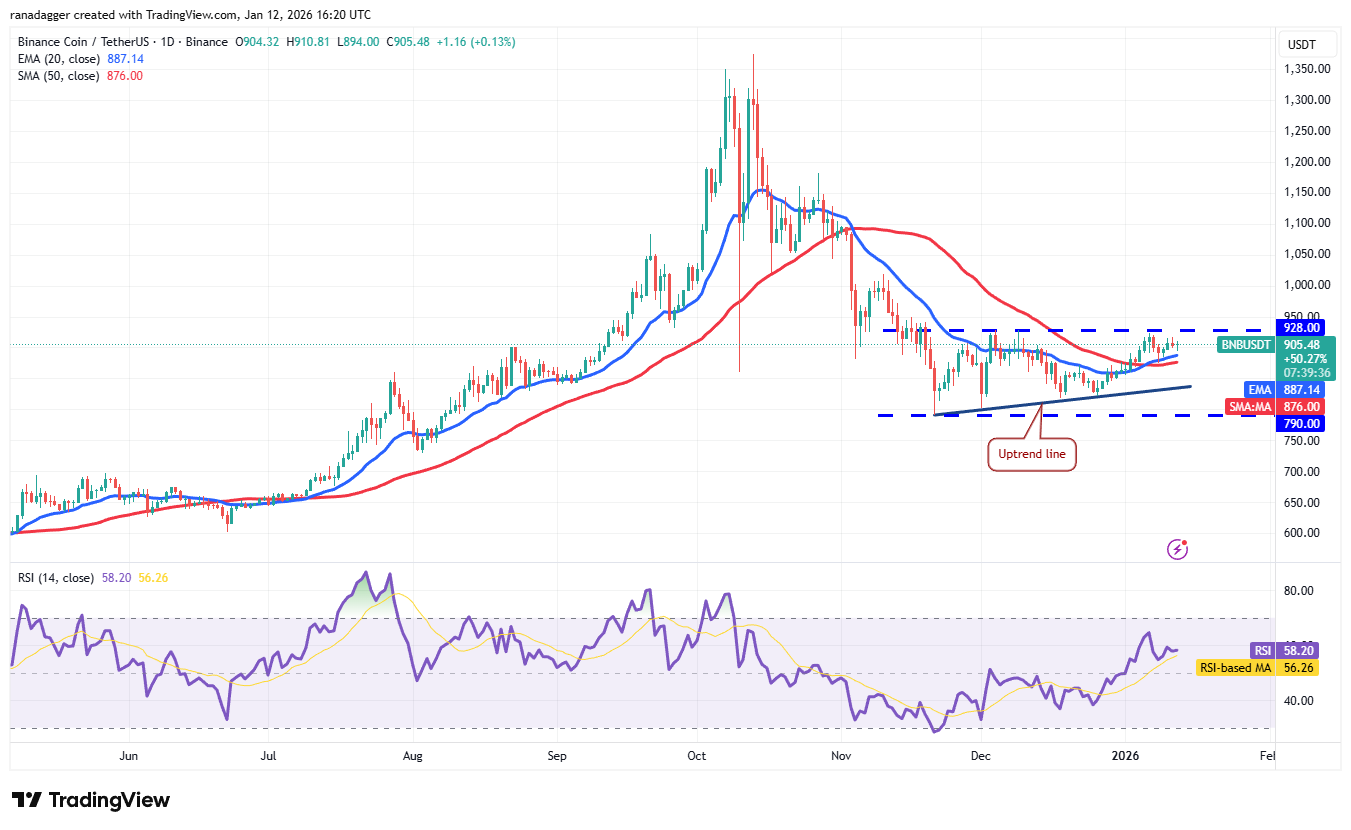
The upsloping 20-day EMA ($887) and the RSI in the positive zone increase the likelihood of an upside breakout. If that happens, the BNB/USDT pair will complete a bullish ascending triangle pattern. The BNB price could then rally to the target objective of $1,066.
On the contrary, if the price turns down and breaks below the moving averages, it suggests that the bears are fiercely defending the $928 level. That could pull the pair down to the uptrend line and then to the $790 support.
Solana price prediction
Solana (SOL) turned up from the moving averages and has reached the $147 level, where the bears are expected to step in.
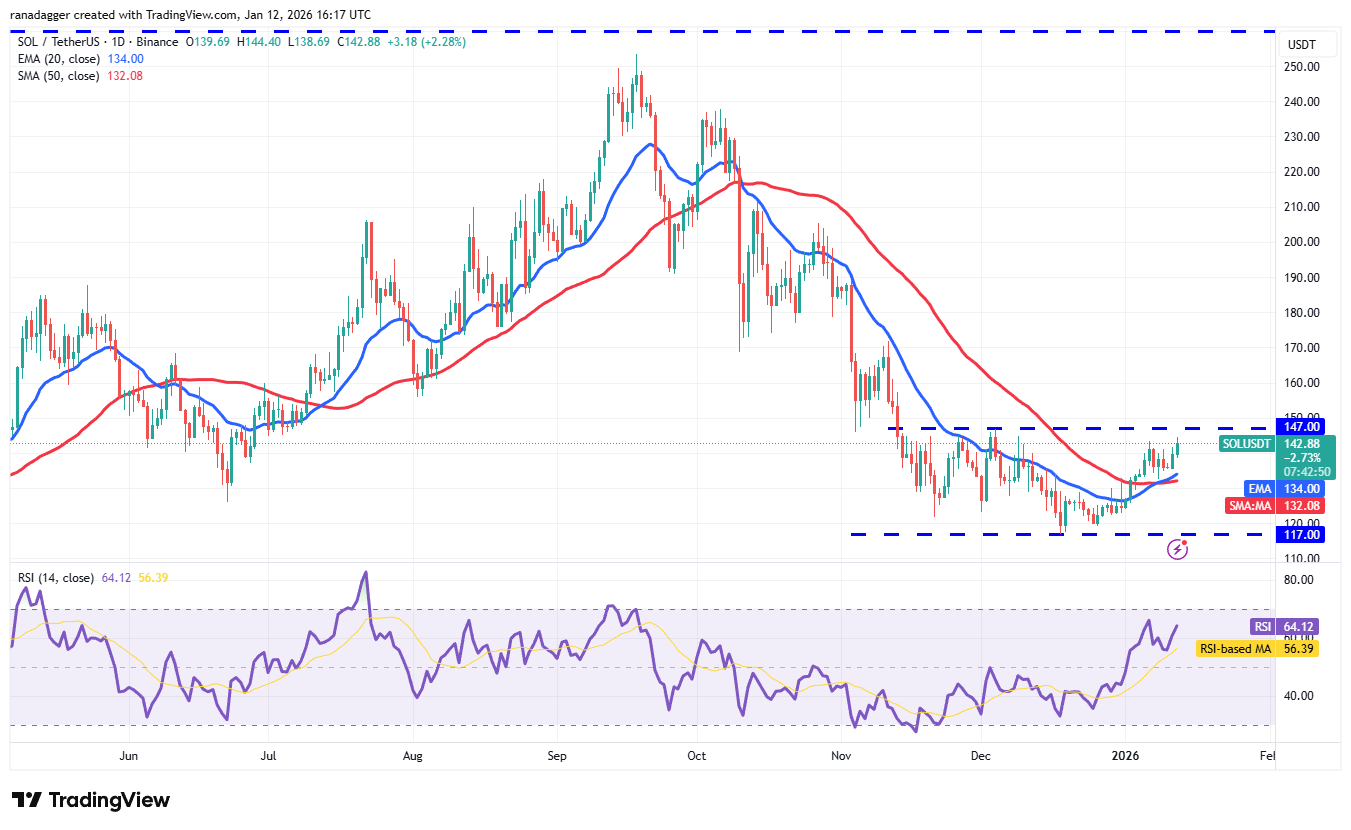
The upsloping 20-day EMA ($134) and the RSI above the 64 level suggest the path of least resistance is to the upside. A close above the $147 resistance could start a new up move to $172.
Instead, if the Solana price turns down and breaks below the moving averages, it indicates that the SOL/USDT pair could extend its stay inside the $117 to $147 range for a while longer.
Related: Ethereum set for 95% copycat rally against Bitcoin
Dogecoin price prediction
Dogecoin (DOGE) is witnessing a tough battle between the bulls and the bears at the moving averages.
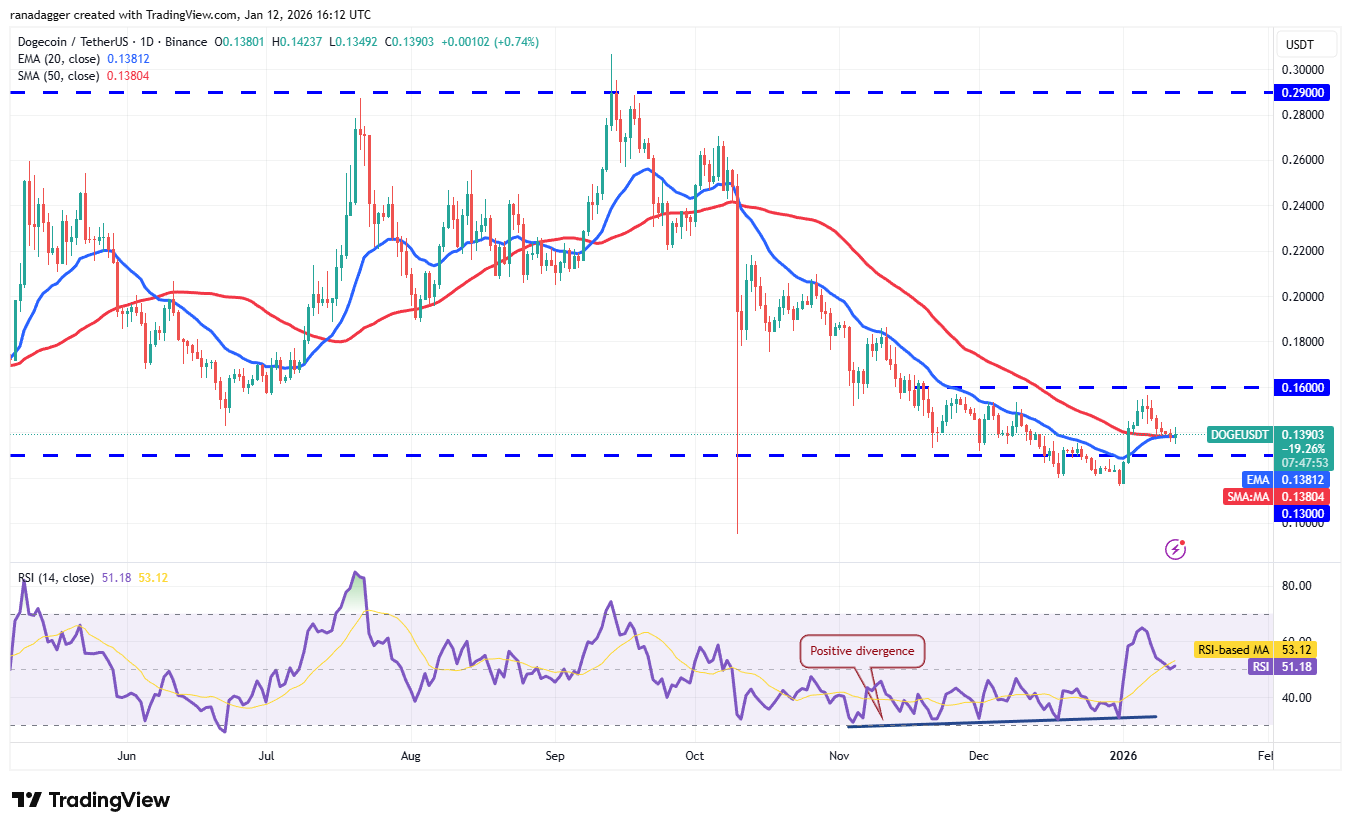
The flattish moving averages and the RSI near the midpoint do not give a clear advantage either to the bulls or the bears. If the price slumps below the moving averages, the DOGE/USDT pair could descend to $0.13 and then to $0.12.
On the upside, a break and close above the $0.16 resistance signals that the market has rejected the break below the $0.13 support. The Dogecoin price could rally to $0.19 and thereafter to $0.22.
Cardano price prediction
Buyers are attempting to maintain Cardano (ADA) above the moving averages, but the weak bounce heightens the risk of a breakdown.
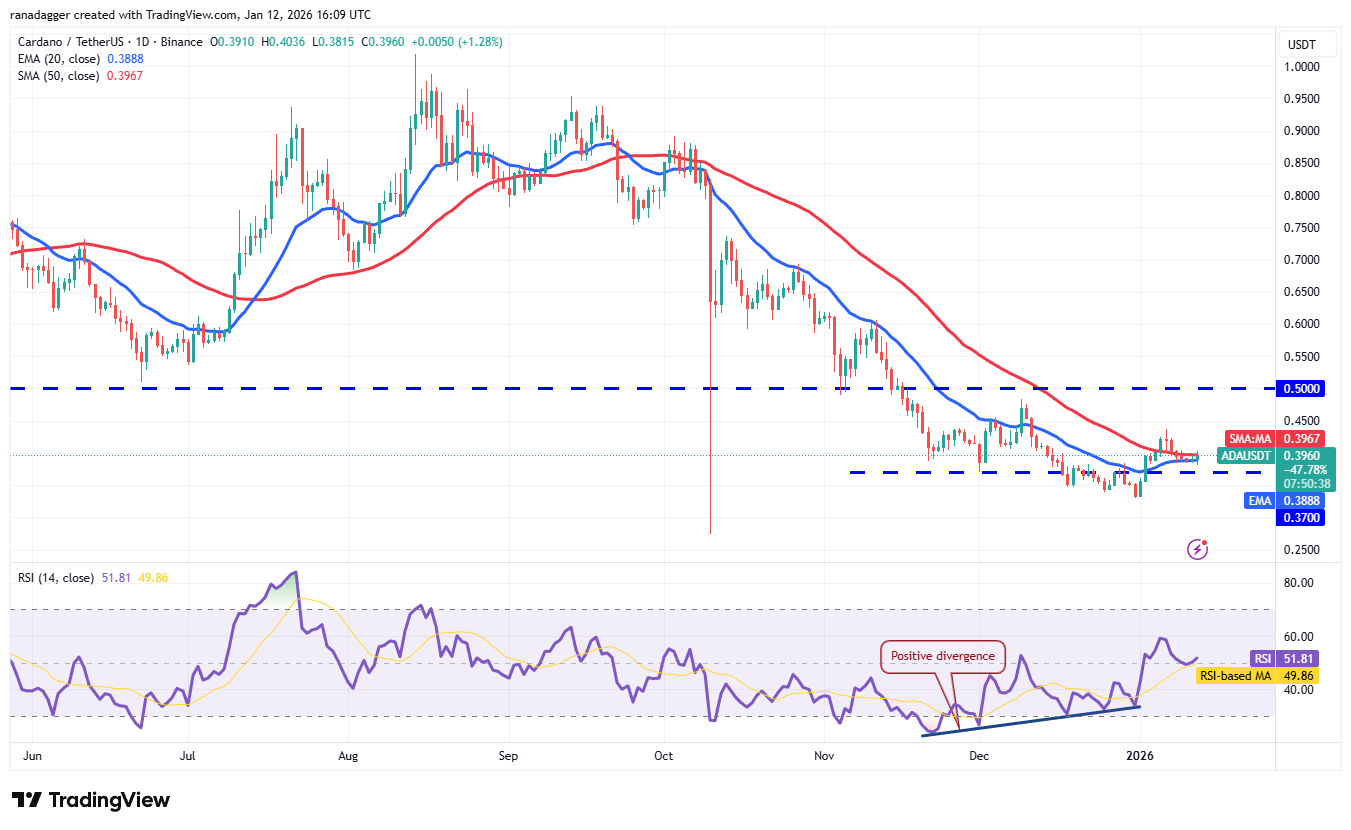
If the price skids below the moving averages, the ADA/USDT pair could drop to $0.37 and then to $0.33. Buyers are expected to aggressively defend the $0.33 level, as a break below it could sink the pair to the Oct. 10 low of $0.27.
The first sign of strength will be a break and close above $0.44. The Cardano price could then rally to the breakdown level of $0.50, which is a critical resistance to watch out for. Buyers will have to pierce the $0.50 level to signal a comeback.
Bitcoin Cash price prediction
Buyers attempted to push Bitcoin Cash (BCH) above the $670 resistance on Sunday, but the bears held their ground.
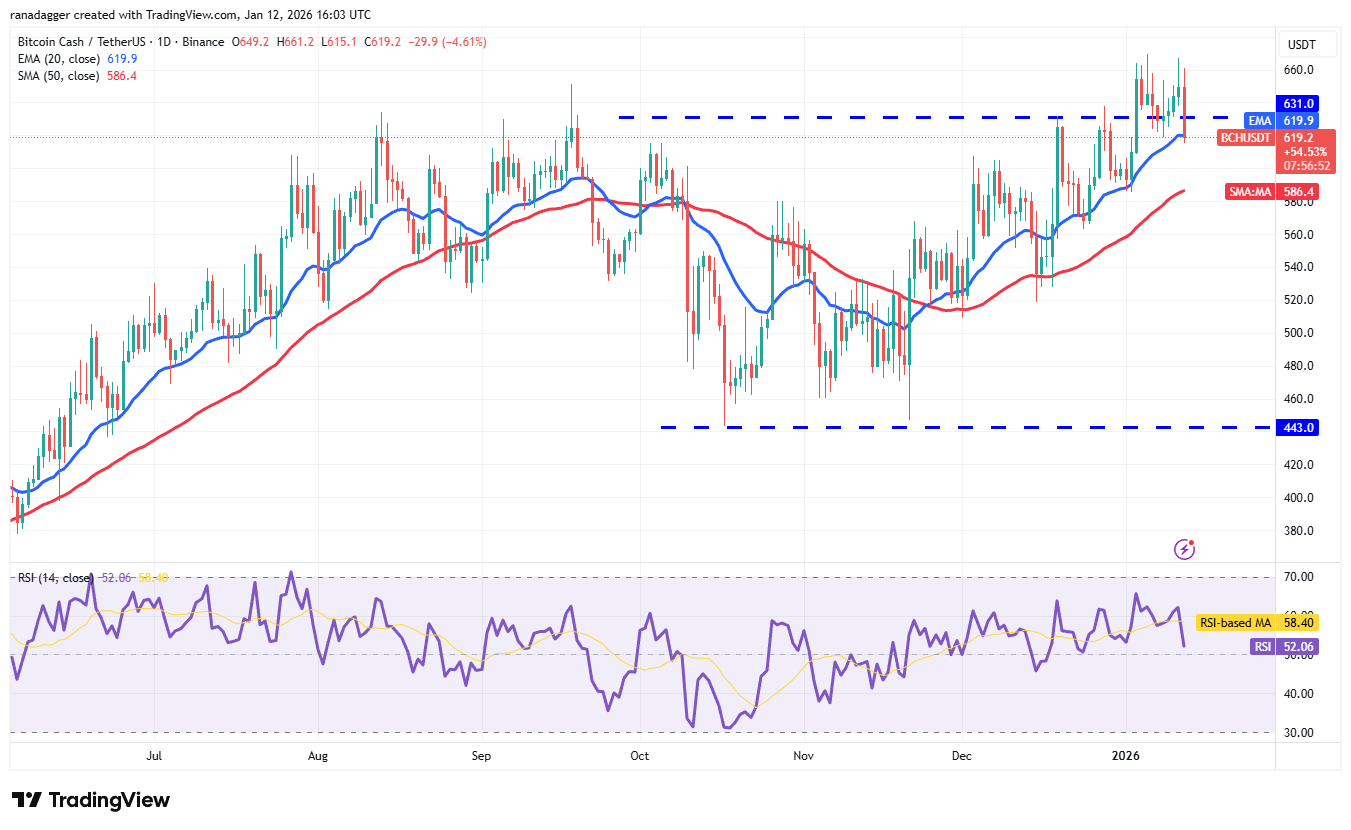
The bears are attempting to strengthen their position by pulling the Bitcoin Cash price below the 20-day EMA ($619). If they do that, the BCH/USDT pair could tumble to the 50-day SMA ($586). Buyers are expected to defend the 50-day SMA, as a close below it suggests that the breakout above $631 may have been a bull trap. The pair may then plummet to $518.
Contrarily, if the price turns up from the moving averages and breaks above $670, it signals that buyers remain in charge. The pair could then ascend to $720, which is expected to act as a solid resistance.
This article does not contain investment advice or recommendations. Every investment and trading move involves risk, and readers should conduct their own research when making a decision. While we strive to provide accurate and timely information, Cointelegraph does not guarantee the accuracy, completeness, or reliability of any information in this article. This article may contain forward-looking statements that are subject to risks and uncertainties. Cointelegraph will not be liable for any loss or damage arising from your reliance on this information.
