


Ether (ETH) dipped below $1,900 during Asian trading hours on Tuesday, extending 30-day losses to 38% as President Donald Trump’s tariffs soured investor sentiment.
Several market and technical indicators show that the ETH price may fall further before any recovery attempts by the bulls.
Key takeaways:
-
Ether trades below its realized price, which has historically marked bearish continuation phases.
-
ETH price may not find a bottom until its 50-week moving average crosses below the 100-week average.
-
The Coinbase Premium at a 3.5-year low and persistent ETF outflows reflect strong selling by US traders.
Ether falls below its realized price
Ether’s 38% drop over the last month has seen it fall below key support levels, including its realized price.
This is an onchain metric that recalculates the market value based on the price at which ETH was last moved.
Ether’s current market price of $1,830 is also below the average cost basis currently at $2,380, which is historically a bearish sign.
Related: Ethereum Foundation starts staking ETH as client diversity concerns persist
When the realized price is above the spot price, it usually acts as resistance, leaving a significant portion of holders underwater.
Under these conditions, panic selling becomes more likely given the current tariff-driven fear and uncertainty gripping the cryptocurrency market.
Additionally, drops below the realized price have historically marked full capitulation phases, where investors lose all confidence and begin selling in large numbers.
In June 2022, Ether’s spot price fell below its realized price, preceding a 45% drop in the ETH price following the Terra Luna market crash. A similar scenario was witnessed in August 2018 before Ether dropped 77%.
The current setup also resembles previous setups, putting the ETH price at risk of a deeper correction.
ETH price charts still favor the bears
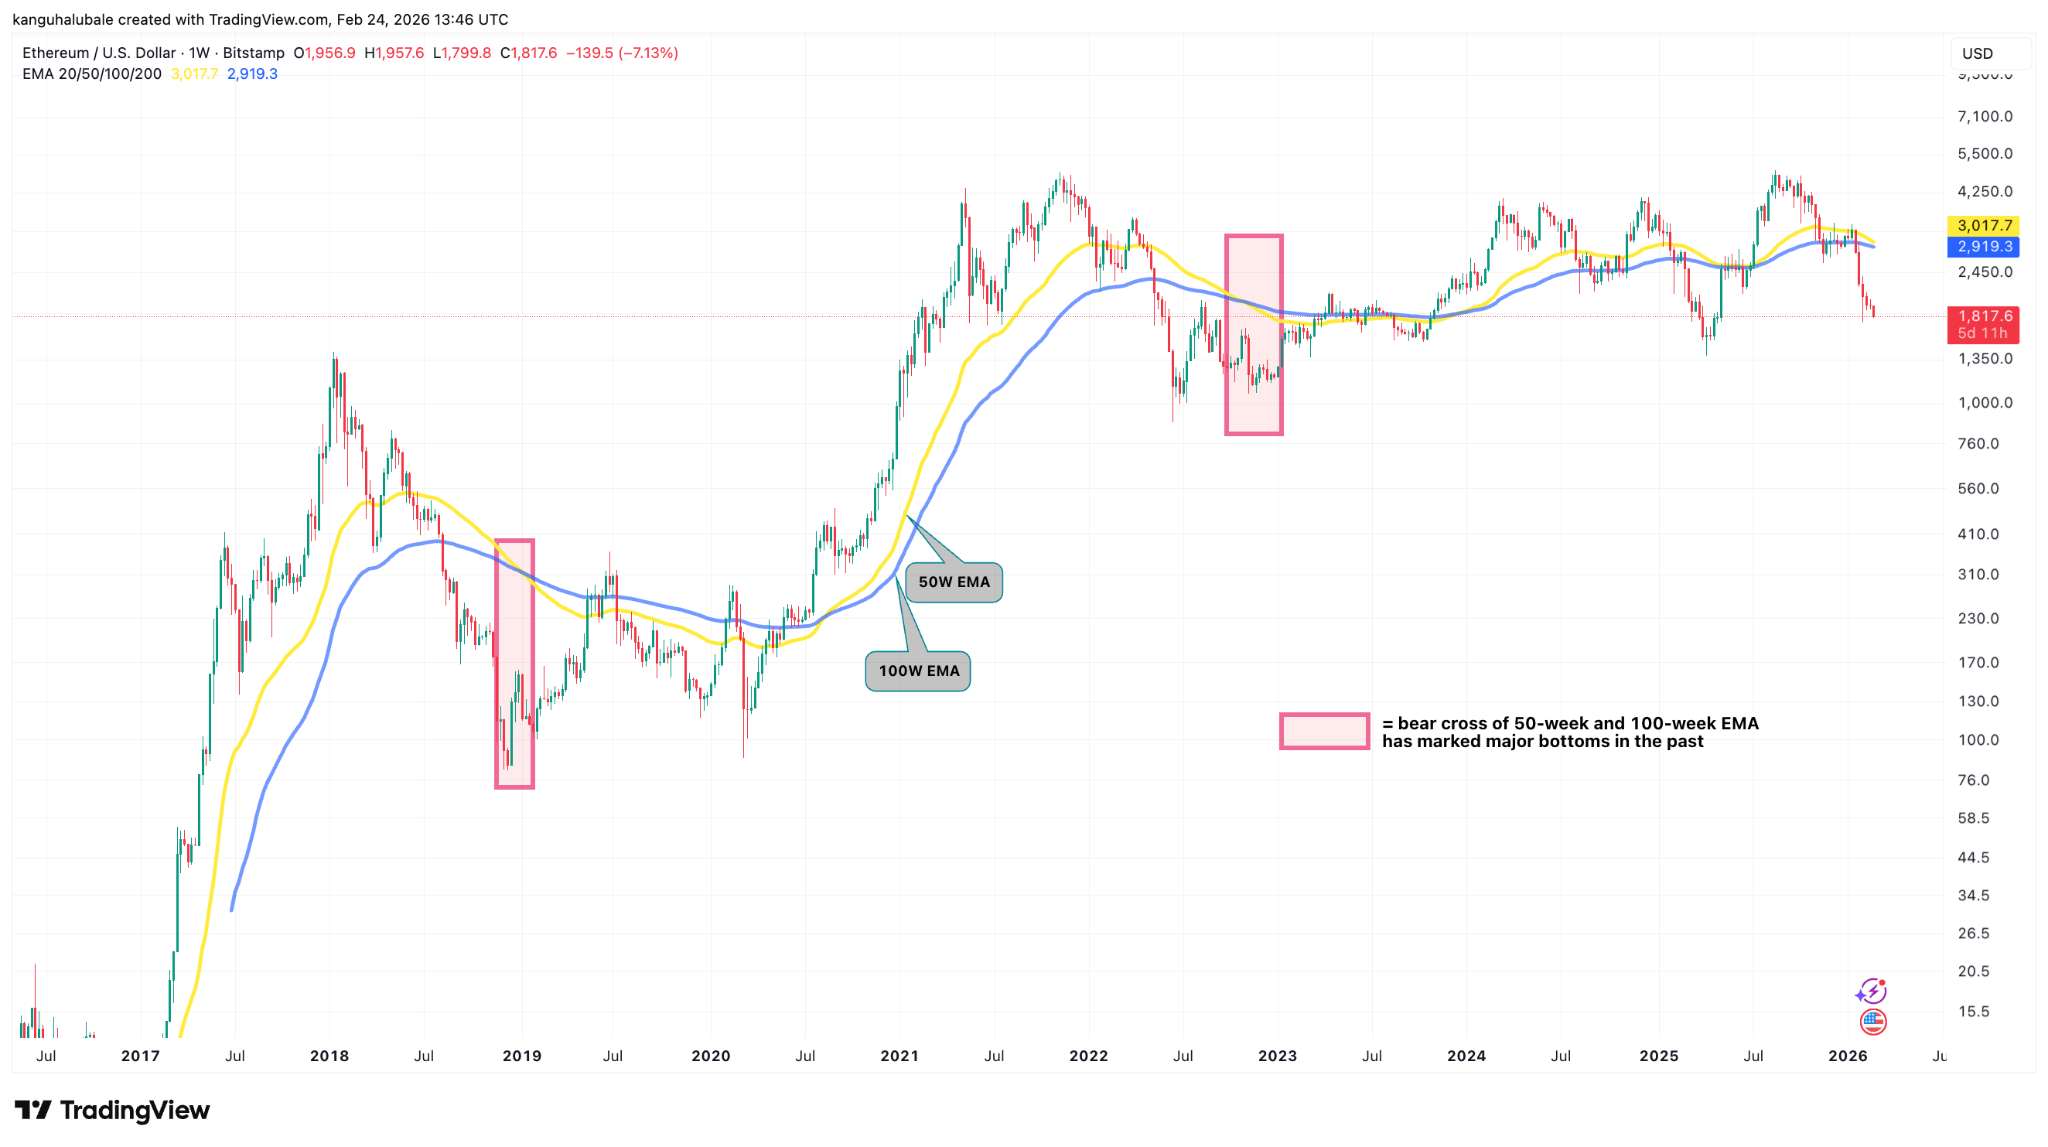
History shows that ETH did not find a bottom until the 50-week exponential moving average (EMA) crossed below the 100-week EMA. This type of cross has marked the end of every major bear market, including in 2022 and 2018, as shown in the chart below.
Currently at $3,017, the 50-week EMA is just above the 100-week EMA ($2,920), suggesting that the ETH/USD pair may fall further until these trendlines signal a potential bottom.
Traders also spotted a bear flag pattern on the daily price chart after key support levels were lost.
Ether’s “bear flag is playing out right now,” said trader BitBull in a Monday X post, adding:
“The final target is $1,400-$1,500.”
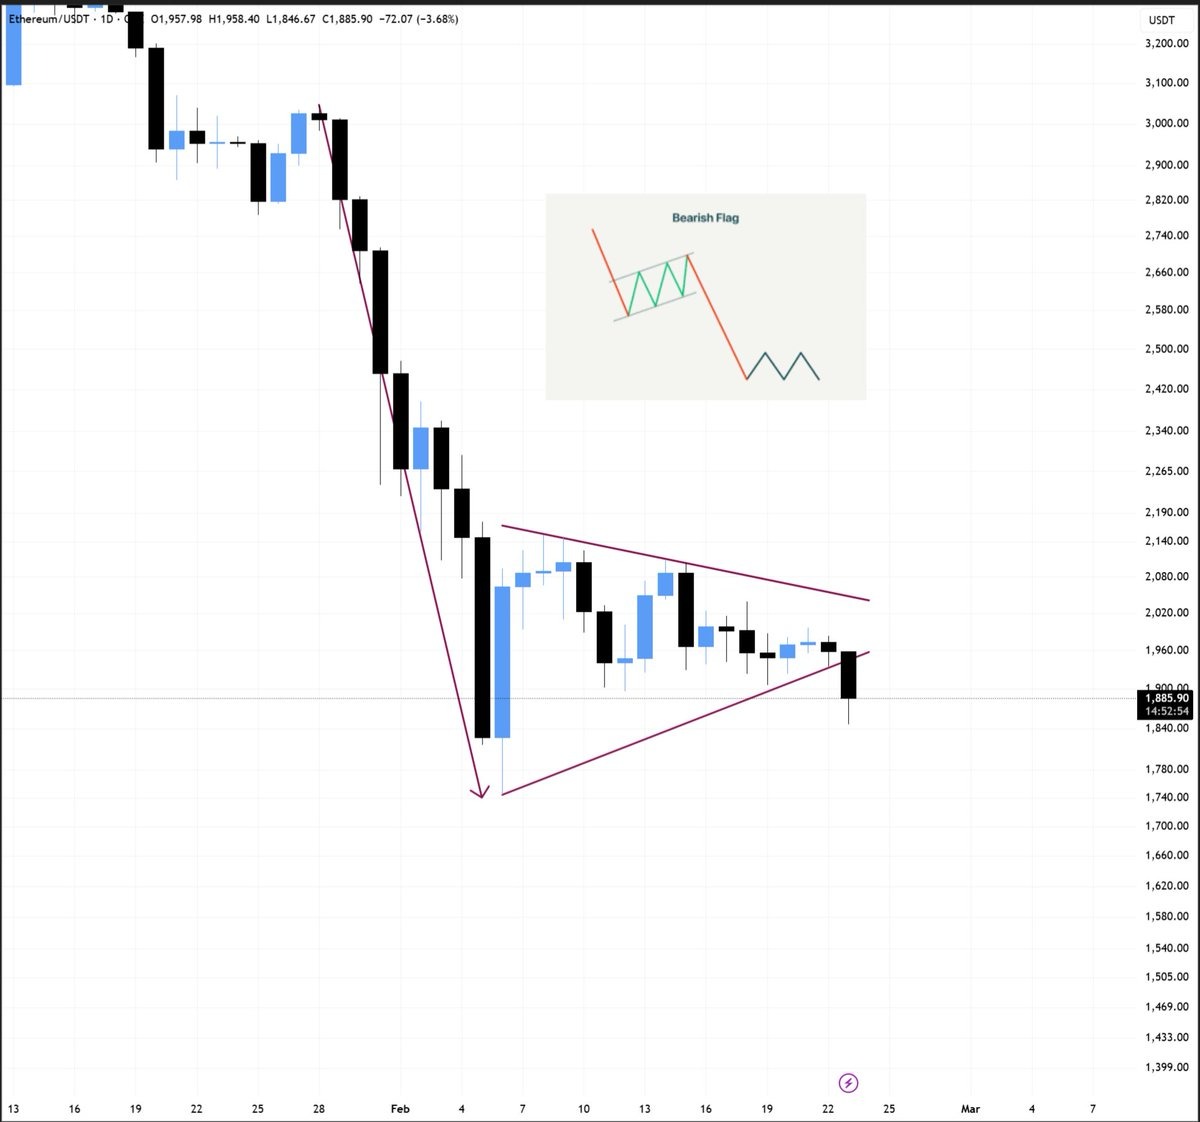
As Cointelegraph reported, the ETH/USD pair could drop to as low as $1,100, driven by declining network activity and waning institutional demand.
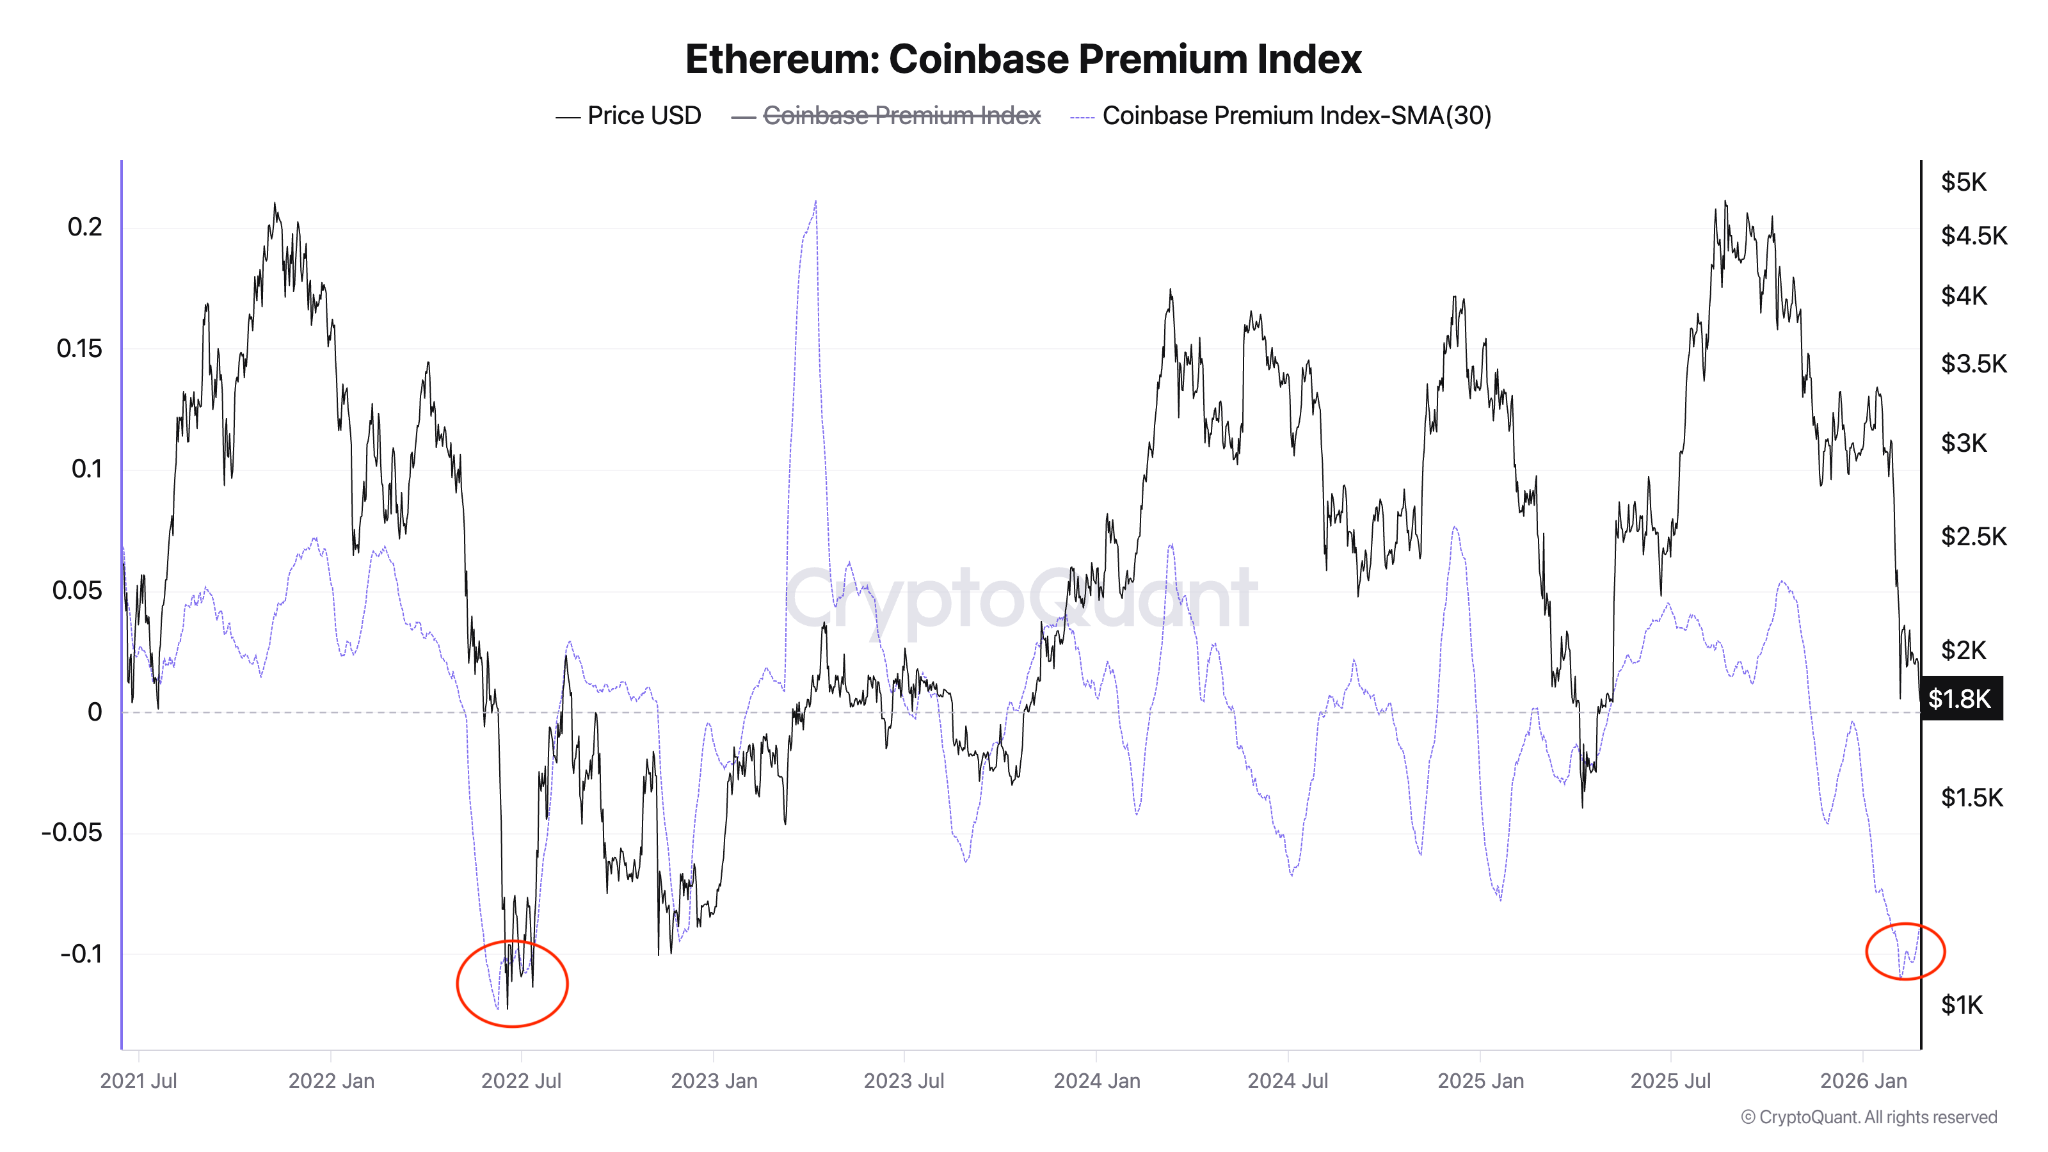
Ether’s Coinbase Premium returns to 2022 levels
The Ethereum Coinbase Premium Index, which tracks the price difference between ETH on Coinbase and Binance, dropped to -0.11 on Feb. 6 before recovering to the current value of -0.09.
A deeply negative premium suggests that much of the selling is coming from the US, particularly retail traders. The last time the 30-day SMA was this negative was during the depths of the 2022 bear market.
Historically, extreme negative premiums often coincided with capitulation phases, as seen in 2022. The downside momentum will remain in place as long as US investors sell at a discount.
Additionally, institutional demand has also declined sharply, with US-based spot Ethereum ETFs recording outflows for five straight weeks, the longest streak since April 2025.
Investors have withdrawn nearly $1.3 billion from these investment products over this period, with $123 million exiting the funds last week, according to data from SoSoValue.
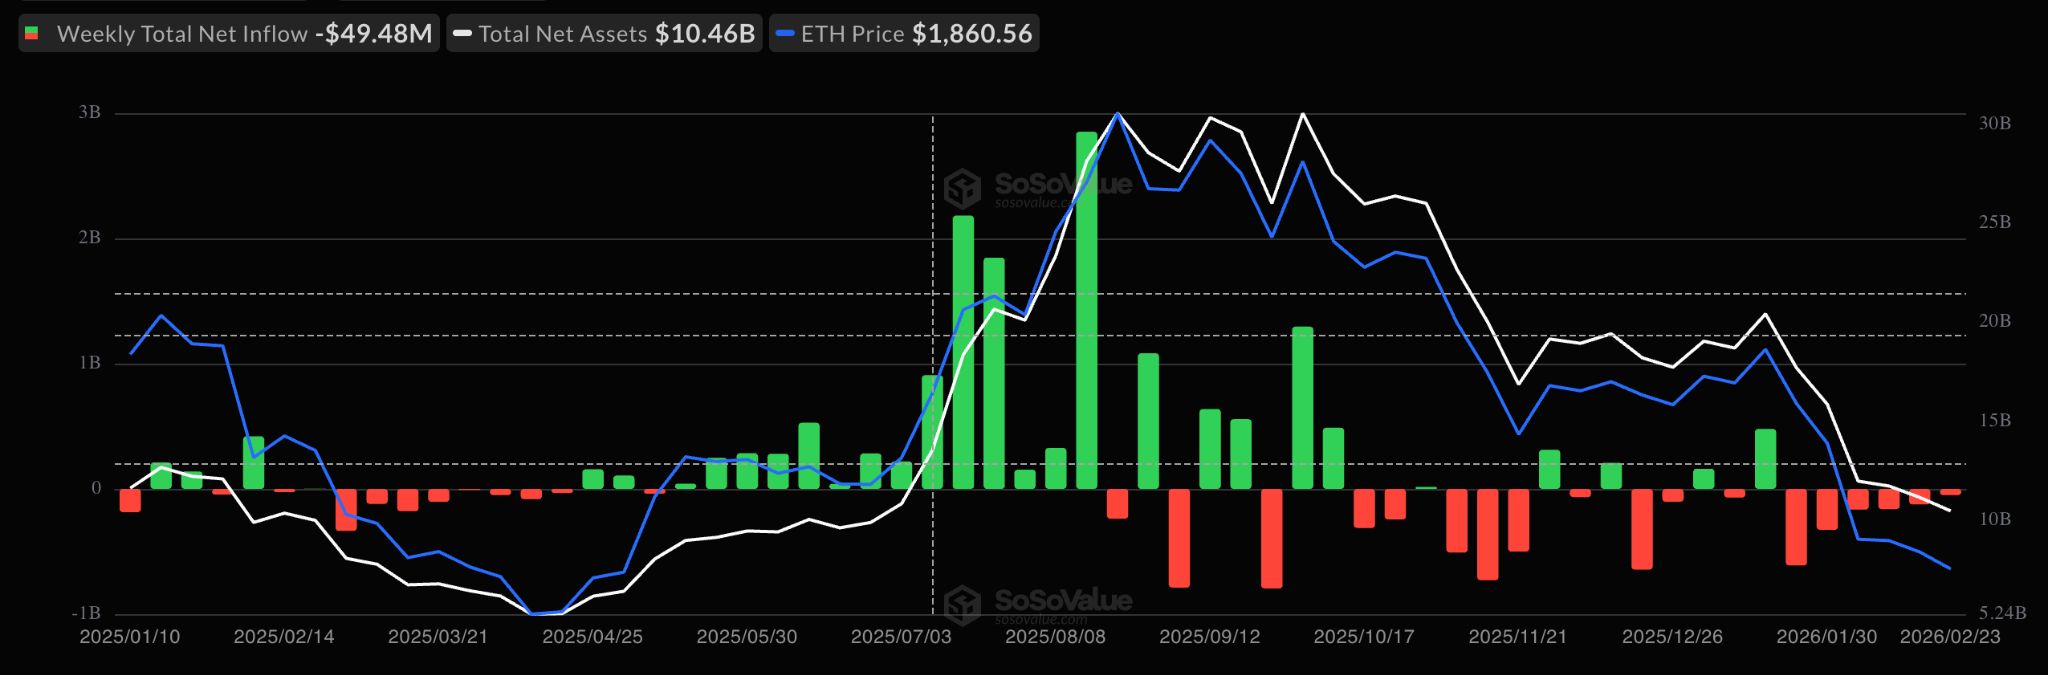
Therefore, institutions are also sellers under current conditions, with more than $36.5 million in outflows from global Ethereum investment products last week, adding to Ether’s headwinds.
This article does not contain investment advice or recommendations. Every investment and trading move involves risk, and readers should conduct their own research when making a decision. While we strive to provide accurate and timely information, Cointelegraph does not guarantee the accuracy, completeness, or reliability of any information in this article. This article may contain forward-looking statements that are subject to risks and uncertainties. Cointelegraph will not be liable for any loss or damage arising from your reliance on this information.
