


Bitcoin (BTC) heads into the end of February on new local lows as $50,000 BTC price targets stay in place.
-
Bitcoin sellers pile in at the weekly close, with consensus seeing rebounds ultimately failing.
-
Geopolitics and inflation woes pile up for global assets, with tariffs spoiling the mood.
-
Bitcoin whales dominate exchange inflows, leading to expectations of a $60,000 rematch.
-
BTC price behavior continues to copy the 2022 bear market, as viewed through onchain data.
-
Crypto market sentiment matches historic lows as the Crypto Fear & Greed Index hits just 5/100.
Bitcoin slumps below $65,000 on weekly close
Bitcoin saw instant sell-side pressure at Sunday’s weekly close, driving price below $65,000 before a modest recovery.
Data from TradingView puts the latest local low at $64,258 on Bitstamp, with BTC/USD still down nearly 3% at the time of writing.
Commenting, X trading account Castillo Trading was hopeful that those lows would form a suitable long entry. Bitcoin, it noted in a post on Monday, had revisited its naked point-of-control (nPOC) price — a recent high-volume area that had not previously been retested.
The nPOC at $64,979 formed one of several key price points, with an accompanying chart eyeing a rebound as high as $78,200.
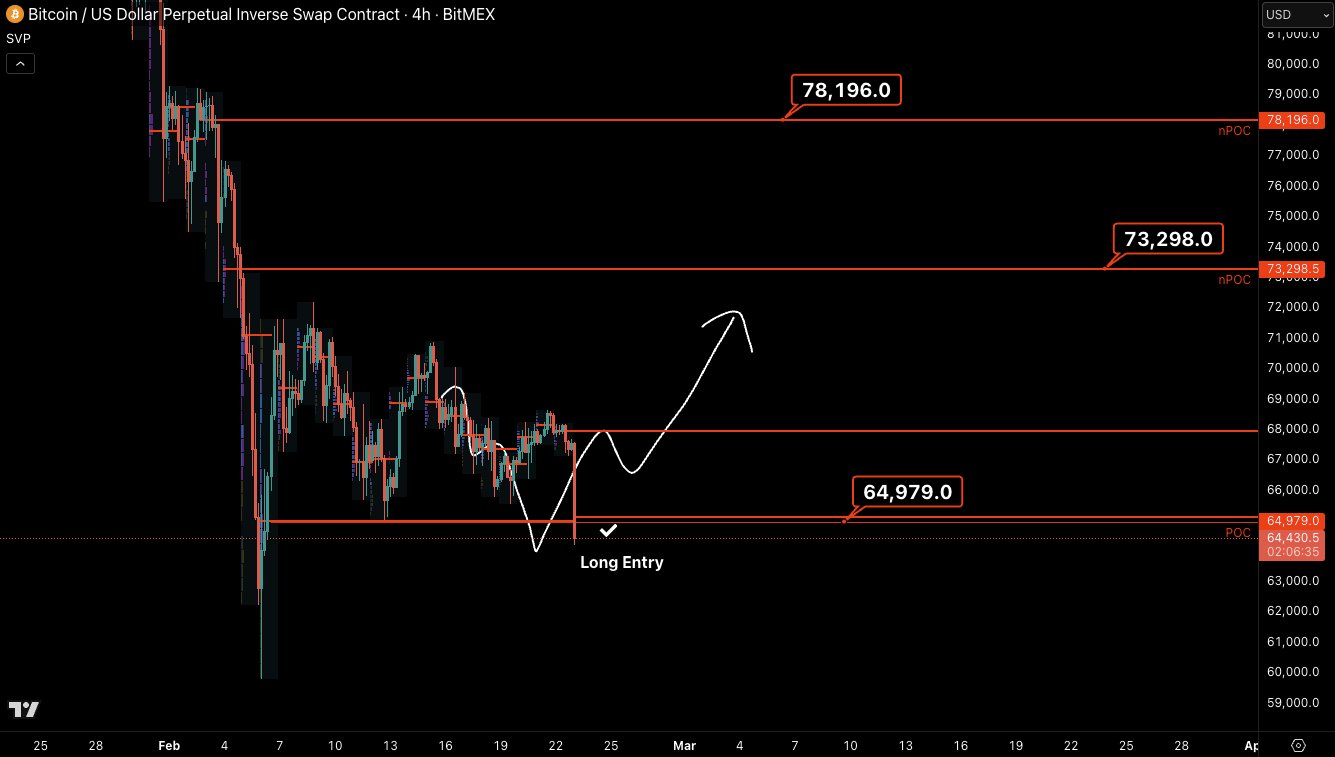
Continuing, fellow trader BitBull flagged $76,000 as a potential upside target before another BTC price dip.
$BTC is doing exactly the same thing which it did in Q4 2025.
This means, a pump towards $75K-$76K will happen before the next dump. pic.twitter.com/Ti1ieoHgb0
— BitBull (@AkaBull_) February 22, 2026
Still fully bearish, meanwhile, trader Roman maintained expectations of new macro lows, currently centered on $50,000.
“Volume increasing while price is going down is the definition of strong bearish price action,” he told X followers on Monday.
“We should expect trend to continue lower, especially to 50-52k area. Likely get a bounce there but ultimately I’m expecting lower after that.”
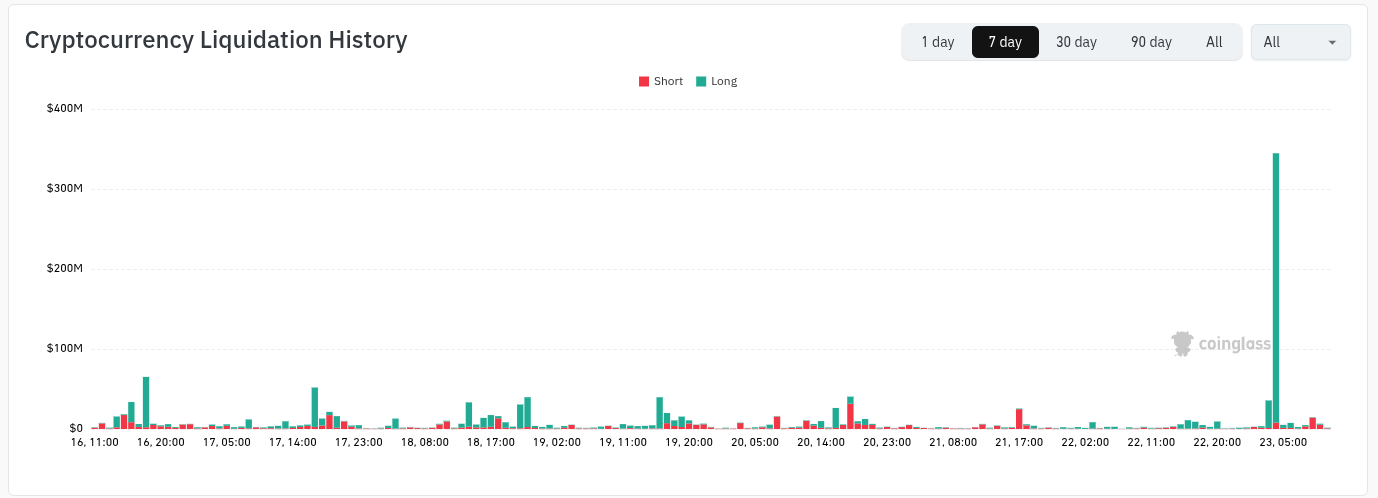
The latest data from monitoring resource CoinGlass confirmed cross-crypto liquidations staying elevated, continuing a pattern from recent weeks. These totaled nearly $500 million in the 24 hours to the time of writing.
Markets “on edge” from tariffs, geopolitics
A combination of geopolitics and inflation worries is set to create uncertain conditions for crypto and risk assets this week.
Tensions over Iran provide the backdrop as markets react to new global trade tariffs by US President Donald Trump.
After the Supreme Court ruled some tariff measures illegal last week, Trump vowed to fight back, with US stocks futures opening the week down on news of a 15% replacement.
“We have a busy week ahead,” trading resource The Kobeissi Letter told X followers, describing markets as “on edge.”
Bitcoin itself saw similar pressure, remaining so into Monday’s Wall Street open and leading to warnings of further lows.
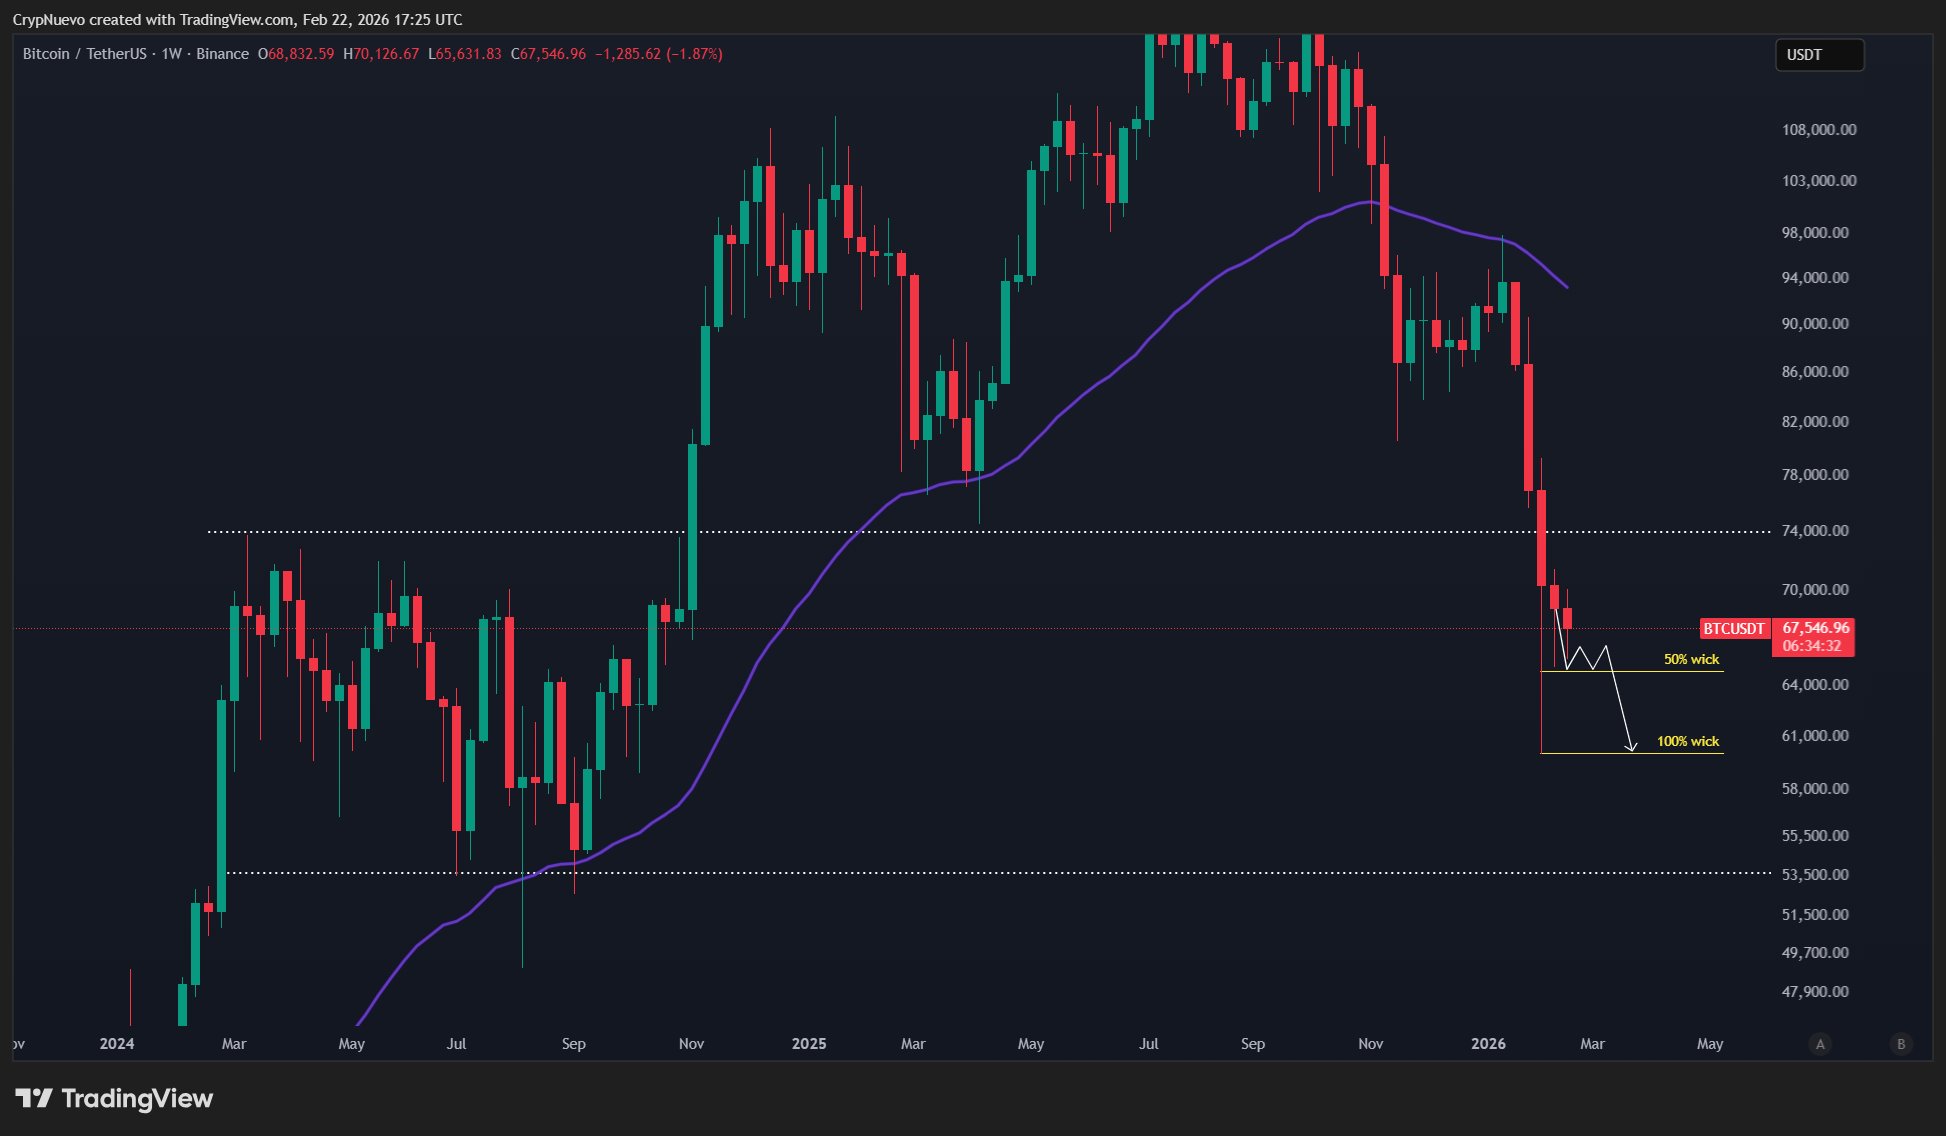
“It’s possible that over the next two weekends, the US-Iran conflict escalates, as a new way to divert attention from the Supreme Court ruling that declared the previous tariffs illegal. Bearish uncertainty,” trader CrypNuevo wrote in an X thread on BTC price action.
CrypNuevo argued that BTC/USD should attempt to “fill” its daily candle wick to sub-$60,000 from early February.
“I think price could reach $61k within 2-3 weeks (-10%),” the trader said.
Later this week, meanwhile, the January print of the Producer Price Index (PPI) is due, with the previous two months’ releases both coming in higher than expected.
As Cointelegraph reported, last week’s Personal Consumption Expenditures (PCE) result likewise showed inflation heating up.
“A key report on consumer inflation showed the Fed’s preferred gauge remaining well above target and accelerating the most since last February,” trading resource Mosaic Asset Company commented in the latest edition of its regular newsletter, “The Market Mosaic.”
“The rally in commodity indexes threatens further upside pressure on inflation.”
Whale inflows risk “significant selling” next
Bitcoin whales are still keen to sell at current levels, new analysis covering exchange flows warns.
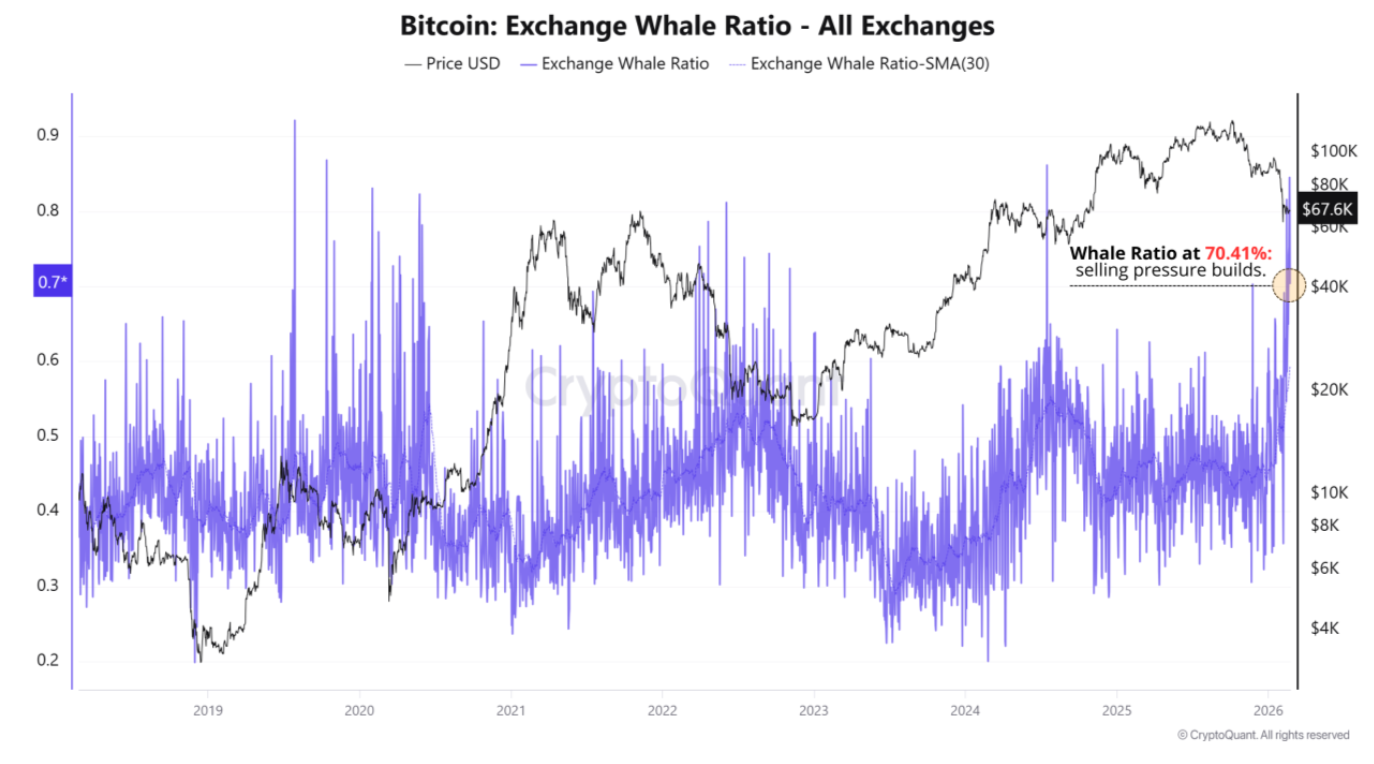
In a “Quicktake” blog post for onchain analytics platform CryptoQuant, contributor GugaOnChain revealed that whales continue to send large tranches of BTC to exchanges.
Inflows in particular are dominated by whales, with CryptoQuant’s Exchange Whale Ratio metric hitting 70%.
“Historically, levels above 70% have preceded significant selling movements, as whales use exchanges to realize profits,” GugaOnChain wrote.
“At the same time, an atypical movement is observed: old coins are returning to platforms in large volume, while short-term holders continue to realize losses, creating a hybrid supply scenario that tends to push Bitcoin’s price toward lower levels.”
The result is “strategic tension” — willing sellers and increasing BTC supply availability, with few buyers stepping in to absorb it.
GugaOnChain thus predicts an “imminent flush toward BTC’s immediate support in the $60K region.”
“With supply on the rise, caution is warranted,” he concluded.
2022 Bear market road map still in play
As 2022 bear-market comparisons multiply, a key BTC price metric is sounding the alarm.
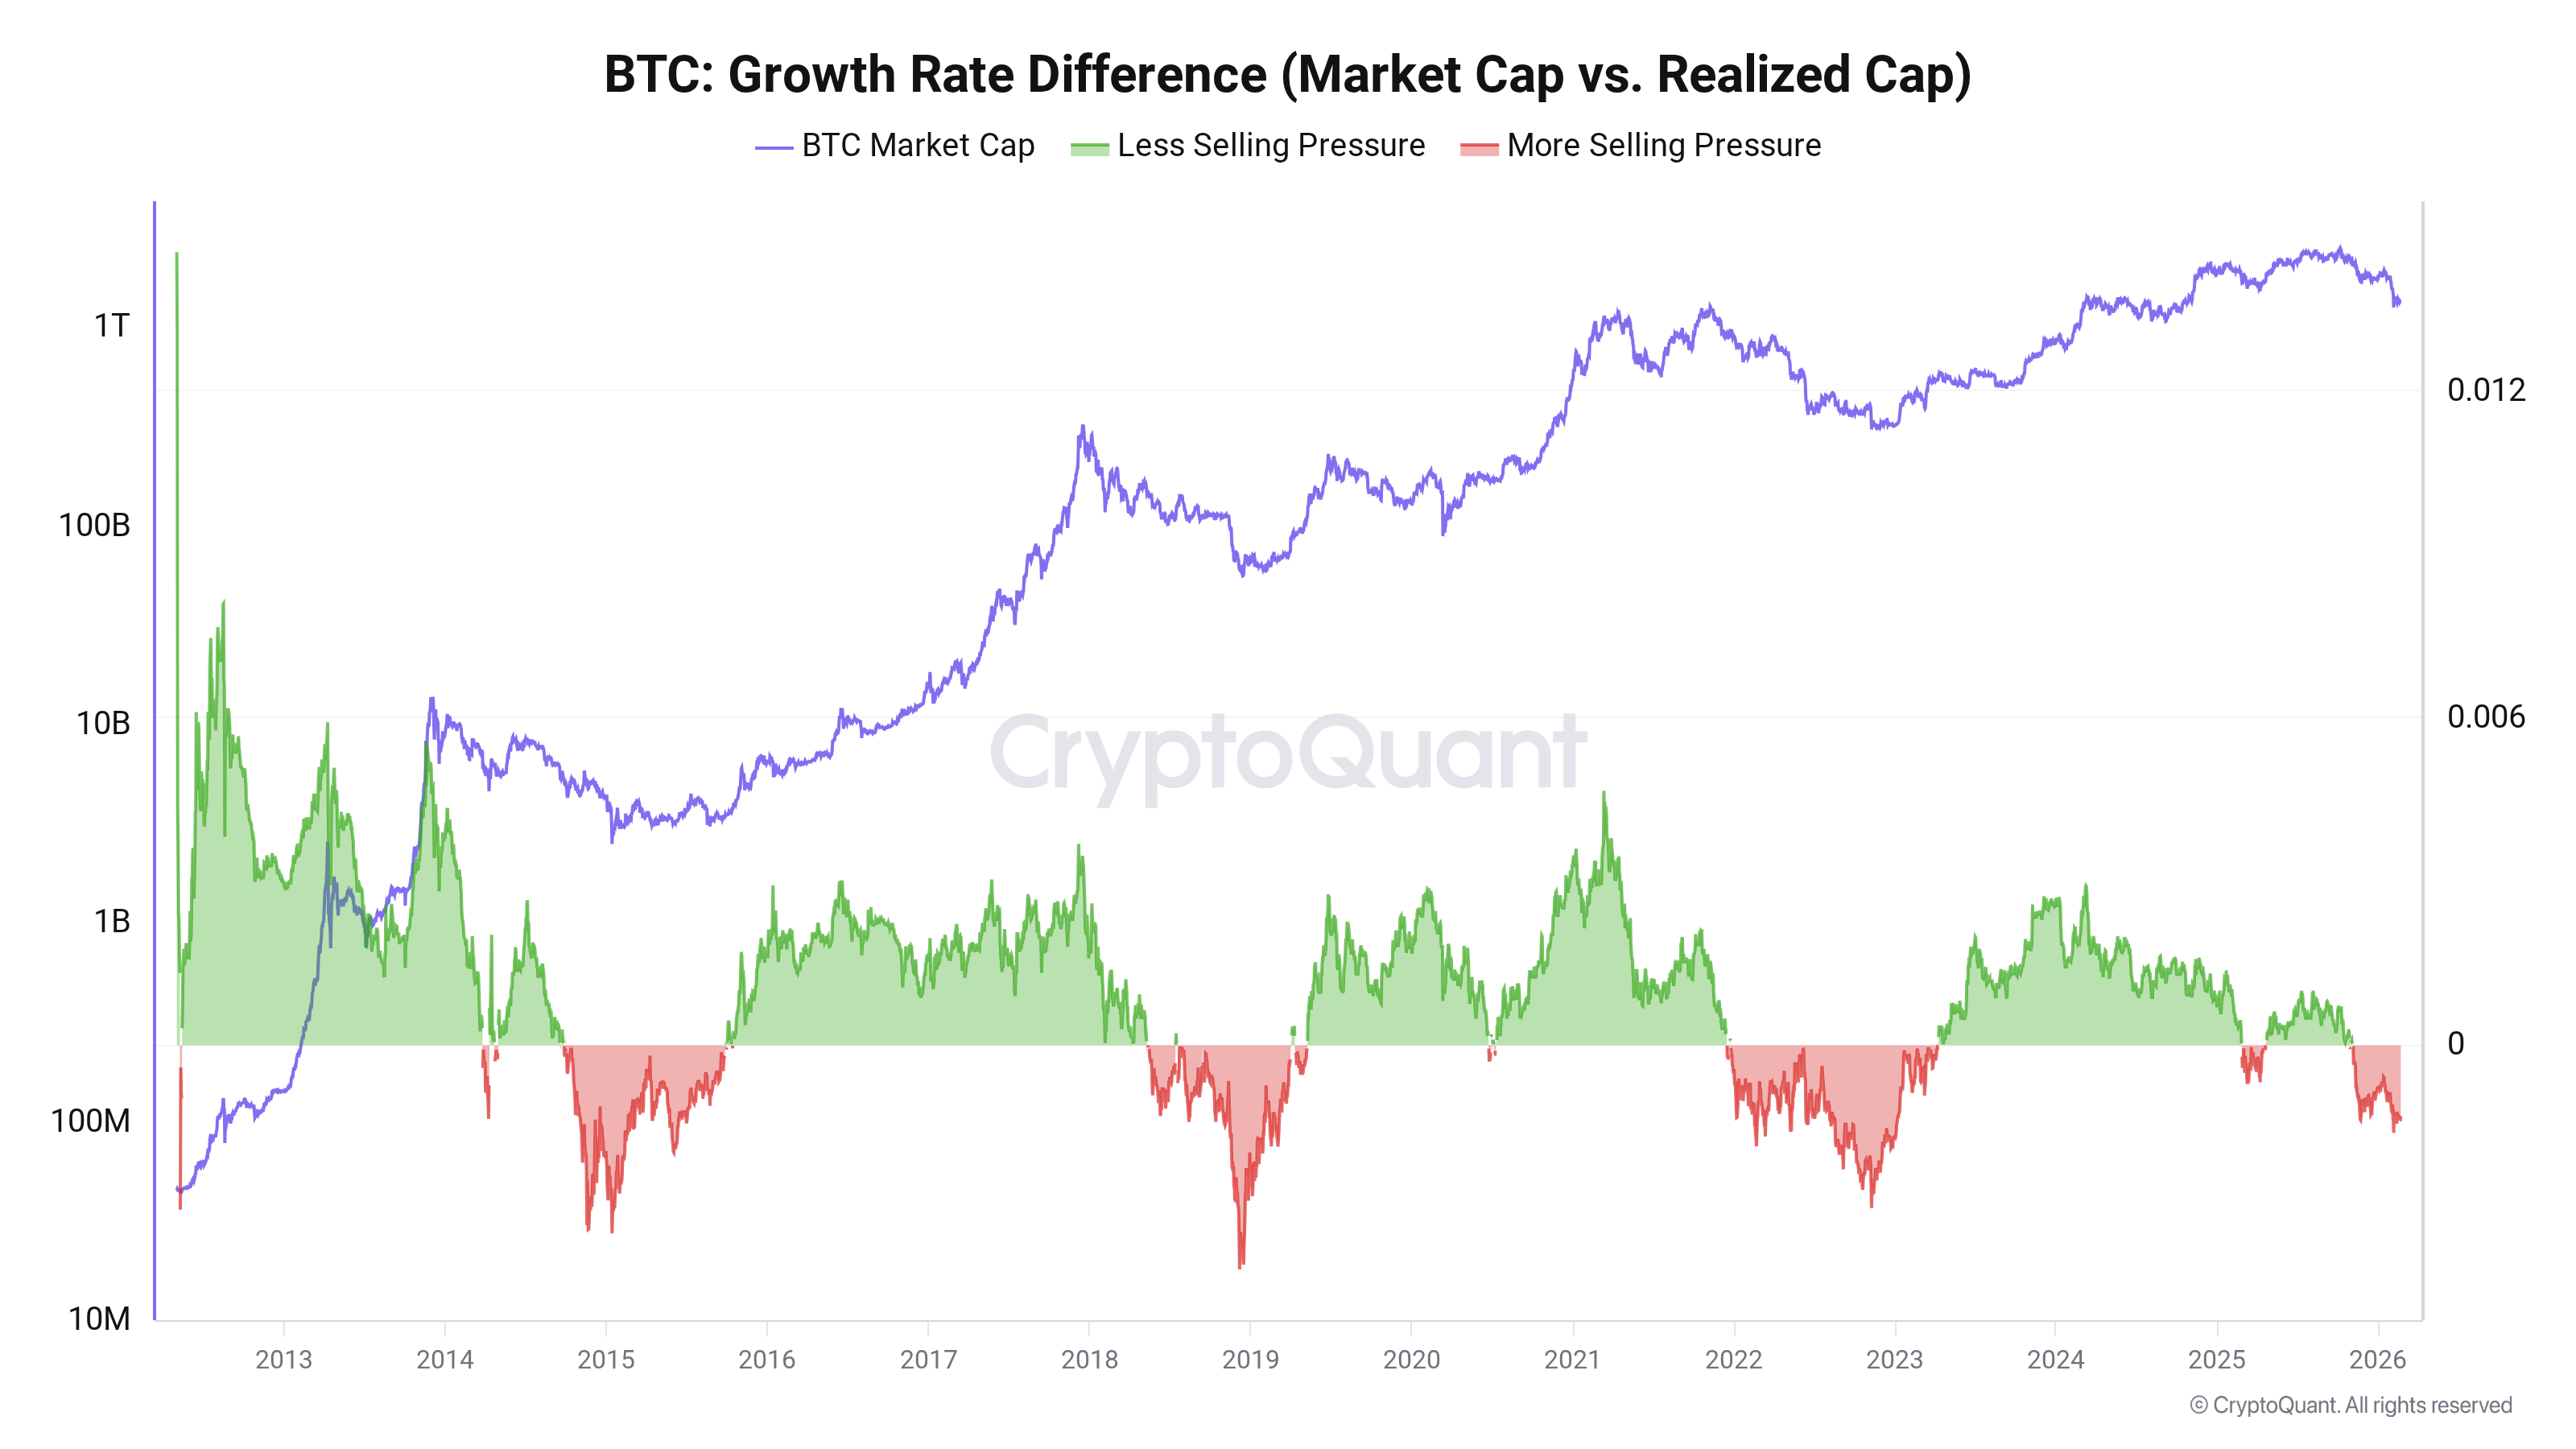
CryptoQuant coverage of Anchored Volume-Weighted Average Price (AVWAP) now warns of “bearish confluence” between price and onchain data.
During Bitcoin’s early February drop, it closed below its AVWAP — the price point with the largest average volume as measured from its latest block subsidy halving in 2024.
“The last time a similar bearish confluence was observed after an ATH was in May 2022,” contributor Facundo Fama noted.
An accompanying chart showed one of CryptoQuant’s proprietary indicators, measuring growth in Bitcoin’s market cap versus its realized cap. It is currently deep in “bear market” territory.
Earlier, Cointelegraph reported on various realized price levels now on the radar as BTC/USD attempts to find its next long-term floor.
Crypto sentiment matches record lows
Bitcoin price action may not yet be at its 15-month lows from the start of the month, but the feeling of doom and gloom is as strong as ever.
Related: Bitcoin historical price metric sees $122K ‘average return’ over 10 months
This is reflected in the latest readings from the Crypto Fear & Greed Index, a classic market sentiment gauge that continues to diverge from its TradFi equivalent.
Fear & Greed fell to just 5/100 on Monday, representing “extreme fear” and matching its lowest levels on record.
🚨 NOW: Crypto Fear and Greed Index has fallen back to 5, remaining deep in Extreme Fear territory. pic.twitter.com/5PmNwgbRMd
— Cointelegraph (@Cointelegraph) February 23, 2026
“People have given up,” independent analyst Cryptoinsightuk reacted on X.
“I had never seen a 5 on Fear and greed index before this past month. Now I’ve seen multiple.”
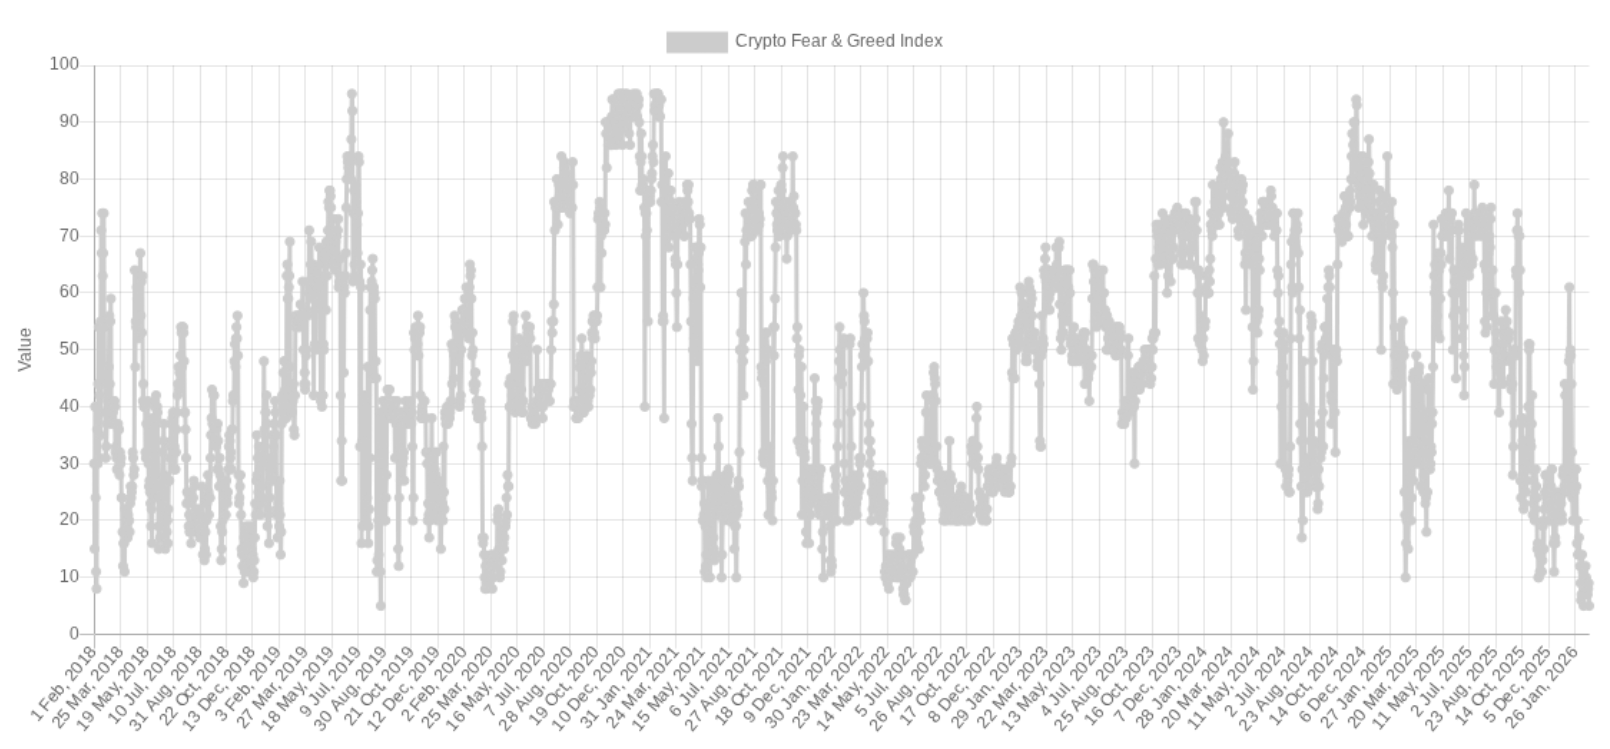
Pseudonymous trader and investor BitcoinHyper added that crypto has now spent longer in the “extreme fear” zone than at any point since the 2022 bear market.
Crypto Fear & Greed Index has been in extreme fear for nearly 3 weeks
It hasn’t stayed this low for this long since 2022 pic.twitter.com/JjRI8UEkZs
— BitcoinHyper (@BitcoinHypers) February 20, 2026
The standard Fear & Greed Index, which covers stocks, currently sits just inside “fear” territory at 43/100. When sentiment first hit 5/100, regular Fear & Greed bottomed out at 33/100 before rebounding.
This article does not contain investment advice or recommendations. Every investment and trading move involves risk, and readers should conduct their own research when making a decision. While we strive to provide accurate and timely information, Cointelegraph does not guarantee the accuracy, completeness, or reliability of any information in this article. This article may contain forward-looking statements that are subject to risks and uncertainties. Cointelegraph will not be liable for any loss or damage arising from your reliance on this information.
