


Key points:
-
Bitcoin remains under pressure, and the downside might accelerate if the $65,118 level is breached.
-
Several major altcoins are attempting a recovery, but the bears remain sellers on rallies.
Bitcoin (BTC) bulls are attempting to hold the price above $67,000, but the bears have continued to exert pressure. A positive sign for the bulls is that select analysts believe BTC may be bottoming out.
Analyst Jelle said in a post on X that all but one of BTC’s major bottoms had formed between the 200-week simple moving average ($58,371) and the 200-week exponential moving average ($68,065). BTC trading near the 200-week EMA suggests that the bottom formation process may have begun.
Similarly, Matrixport said in a post on X that BTC may be making a durable bottom. Matrixport said that when the 21-day moving average of its daily sentiment indicator dips below zero and starts to turn up, it suggests that the selling pressure is getting exhausted. Although that doesn’t rule out a decline in the near term, the readings indicate that BTC could be approaching another inflection point.
Another positive projection for BTC came from Wells Fargo analyst Ohsung Kwon. In a note seen by CNBC, Kwon said additional savings from tax refunds, mostly from high-income consumers, could flow into equities and BTC, bringing back the “YOLO” trade.
Could BTC and the major altcoins overcome the overhead resistance levels? Let’s analyze the charts of the top 10 cryptocurrencies to find out.
Bitcoin price prediction
BTC has been making higher lows in the short term, but the bulls have failed to push the price above the breakdown level of $74,508.
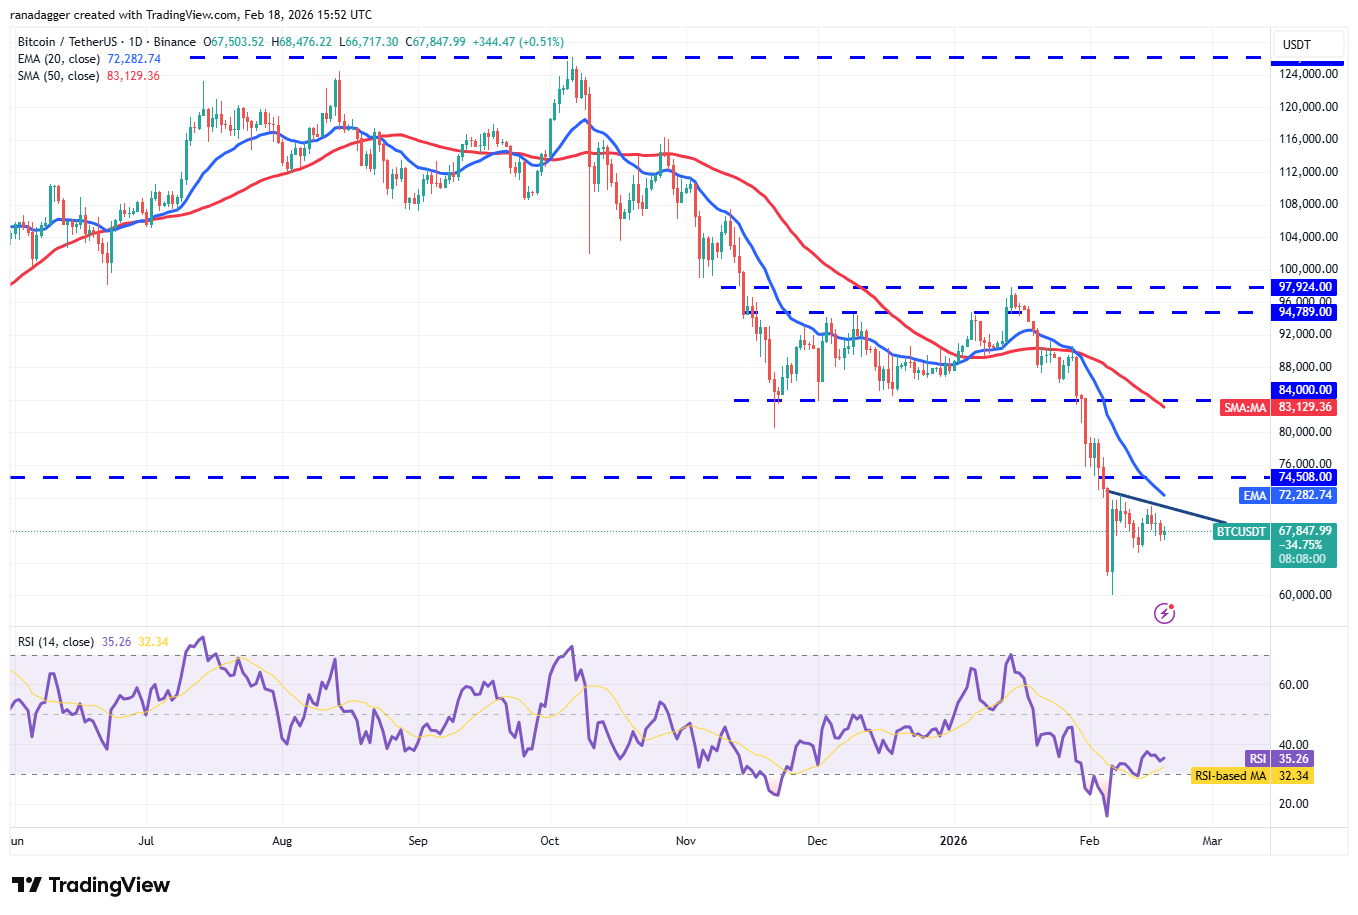
Buyers are likely to make another attempt to pierce the overhead resistance at the 20-day EMA ($72,282) and the $74,508 level. If they can pull it off, the BTC/USDT pair may rally to the 50-day SMA ($83,129).
Sellers are likely to have other plans. They will attempt to defend the 20-day EMA and pull the Bitcoin price below the immediate support at $65,118. If they manage to do that, the pair might tumble to solid support at $60,000.
Ether price prediction
The bulls have maintained Ether (ETH) above the immediate support at $1,897, indicating buying on dips.

Buyers will again attempt to clear the overhead hurdle at the 20-day EMA ($2,183). If they succeed, the ETH/USDT pair may start a stronger recovery toward the 50-day SMA ($2,707).
Contrarily, if the Ether price turns down and breaks below $1,897, it suggests that the bears are attempting to take charge. The pair may then drop to the critical support at $1,750. Buyers are expected to protect the $1,750 level with all their might, as a close below it may sink the pair to $1,537.
XRP price prediction
XRP (XRP) has been trading just below the 20-day EMA ($1.52), indicating that the bulls continue to exert pressure.
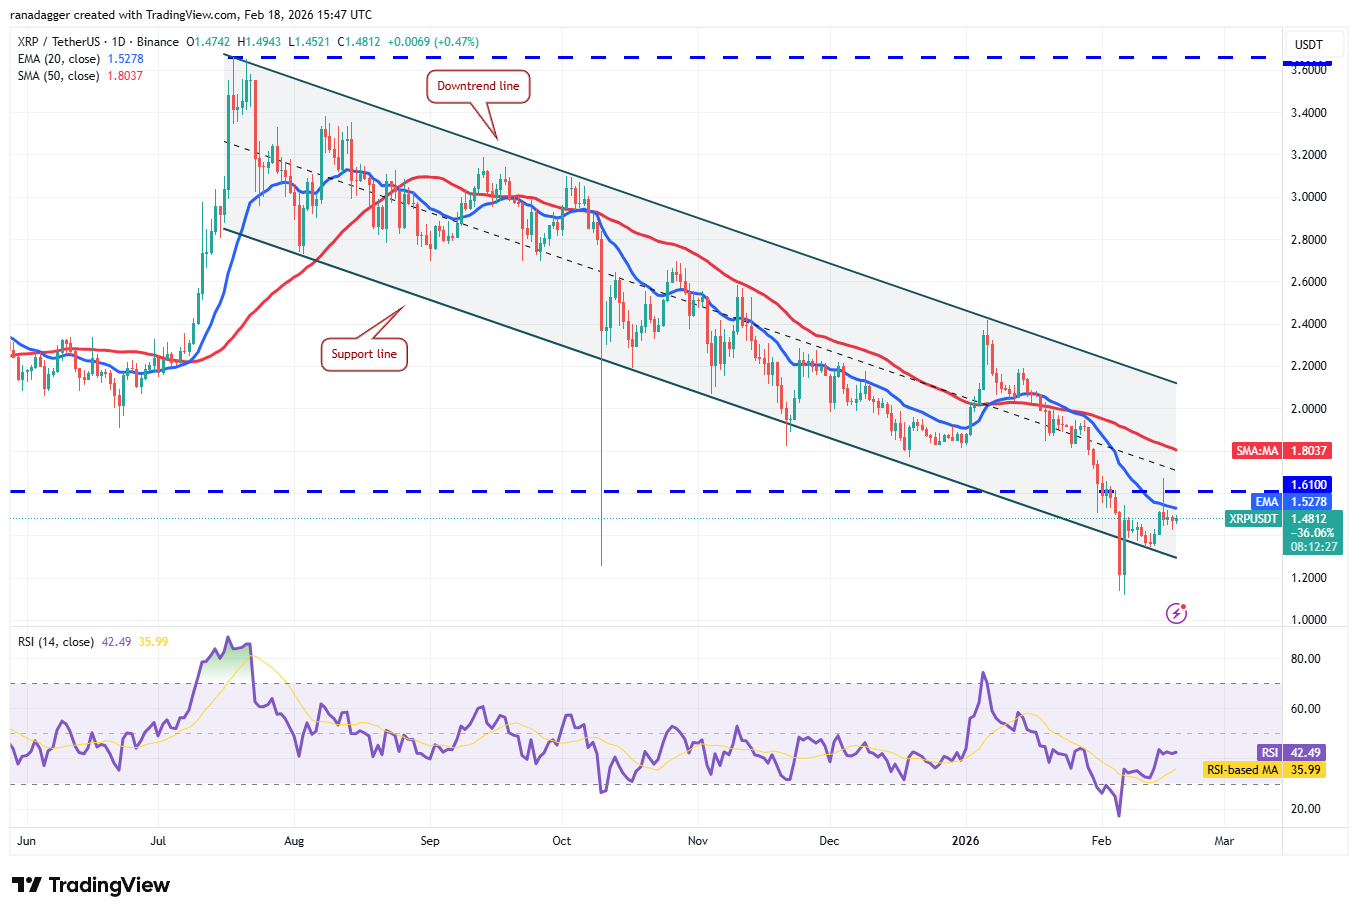
That improves the prospects of a break above the 20-day EMA and the breakdown level of $1.61. The XRP price may then climb to the 50-day SMA ($1.80), signaling the XRP/USDT pair may remain inside the channel for some more time.
Buyers will have to thrust the price above the downtrend line to indicate a potential short-term trend change. On the contrary, a deeper fall might begin if the price turns down and plunges below the support line.
BNB price prediction
BNB (BNB) has been trading in a narrow range for the past few days, signaling indecision between the bulls and the bears.
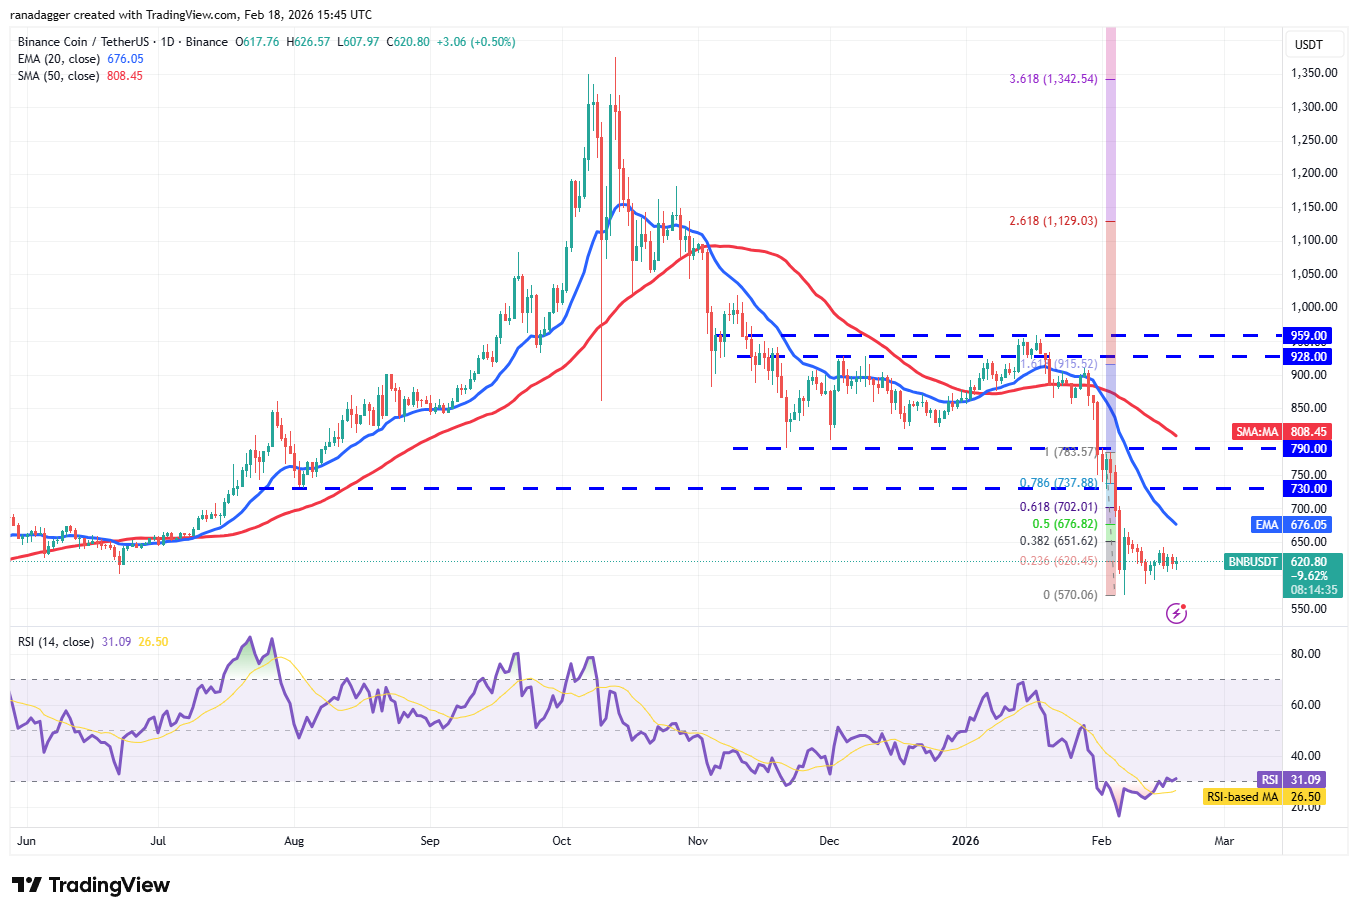
If the BNB price turns down and plummets below the $570 support, it indicates the resumption of the downtrend. The BNB/USDT pair may then extend the decline to the psychological level at $500.
Buyers will have to push and maintain the price above the 20-day EMA ($676) to suggest that the selling pressure is reducing. The pair may then rally to $730 and subsequently to $790.
Solana price prediction
Solana (SOL) is facing resistance near the breakdown level of $95, indicating that the bears are active at higher levels.
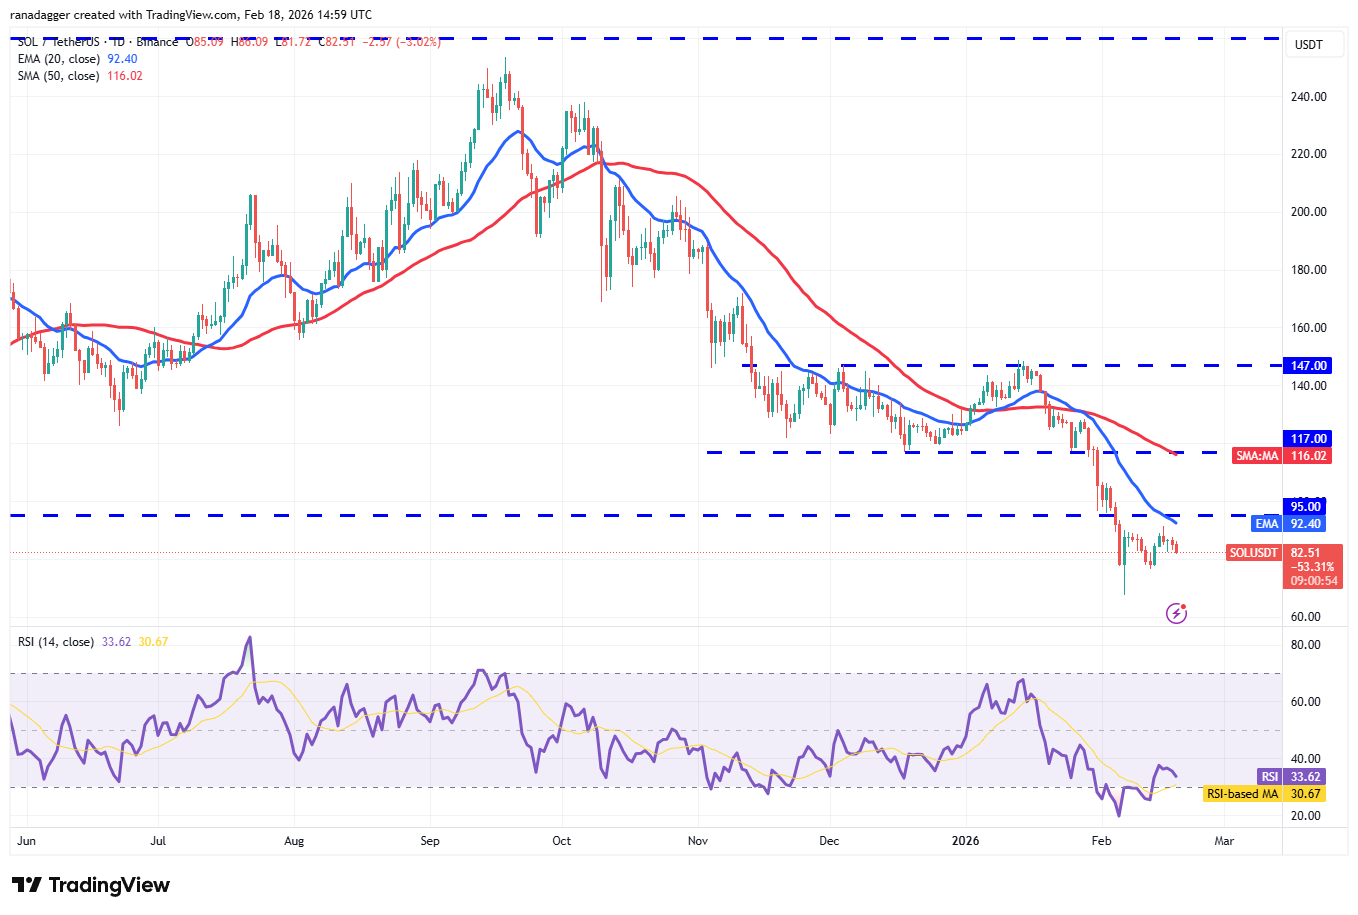
The bears will attempt to strengthen their position by pulling the Solana price below the $76 support. If they manage to do that, it suggests that the bears have flipped the $95 level into resistance. The pair may then retest the Feb. 6 low of $67.
Buyers will have to overcome the $95 overhead hurdle to signal a comeback. If they can pull it off, the SOL/USDT pair may ascend to the 50-day SMA ($116), where the sellers are expected to mount a strong defense.
Dogecoin price prediction
Dogecoin (DOGE) has been trading just below the 20-day EMA ($0.10), indicating a lack of selling at lower levels.
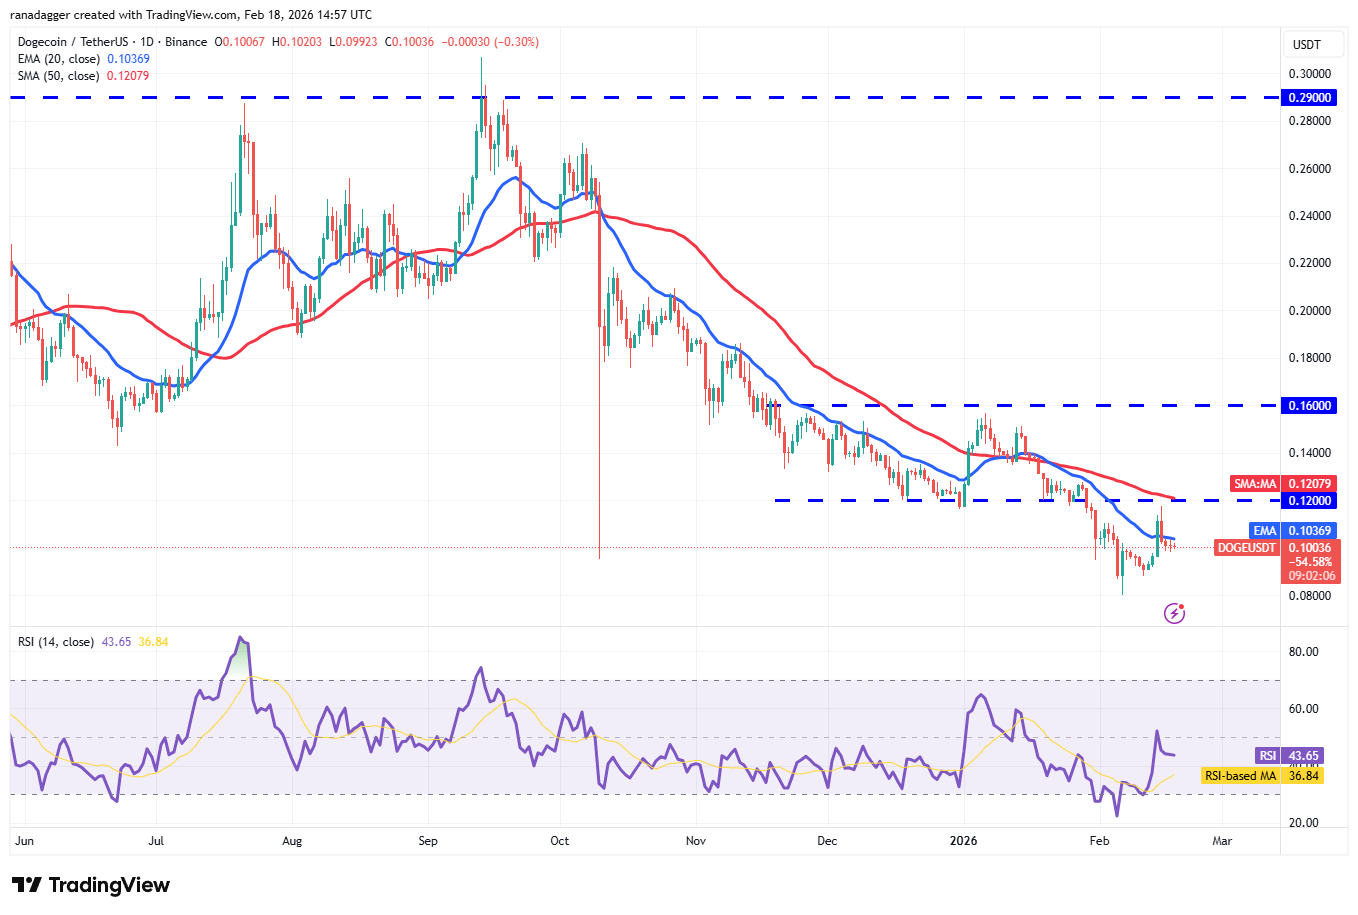
That increases the likelihood of a rally above the 20-day EMA. The DOGE/USDT pair may then climb to the 50-day SMA ($0.12). Sellers will attempt to halt the recovery at the $0.12 level, but if the bulls overcome the resistance, the Dogecoin price may soar to the $0.16 level.
Instead, if the price turns down from the $0.12 resistance, it suggests a possible range formation in the near term. The pair might swing between $0.08 and $0.12 for a few days.
Bitcoin Cash price prediction
Bitcoin Cash (BCH) has been stuck between the moving averages, indicating uncertainty about the next directional move.
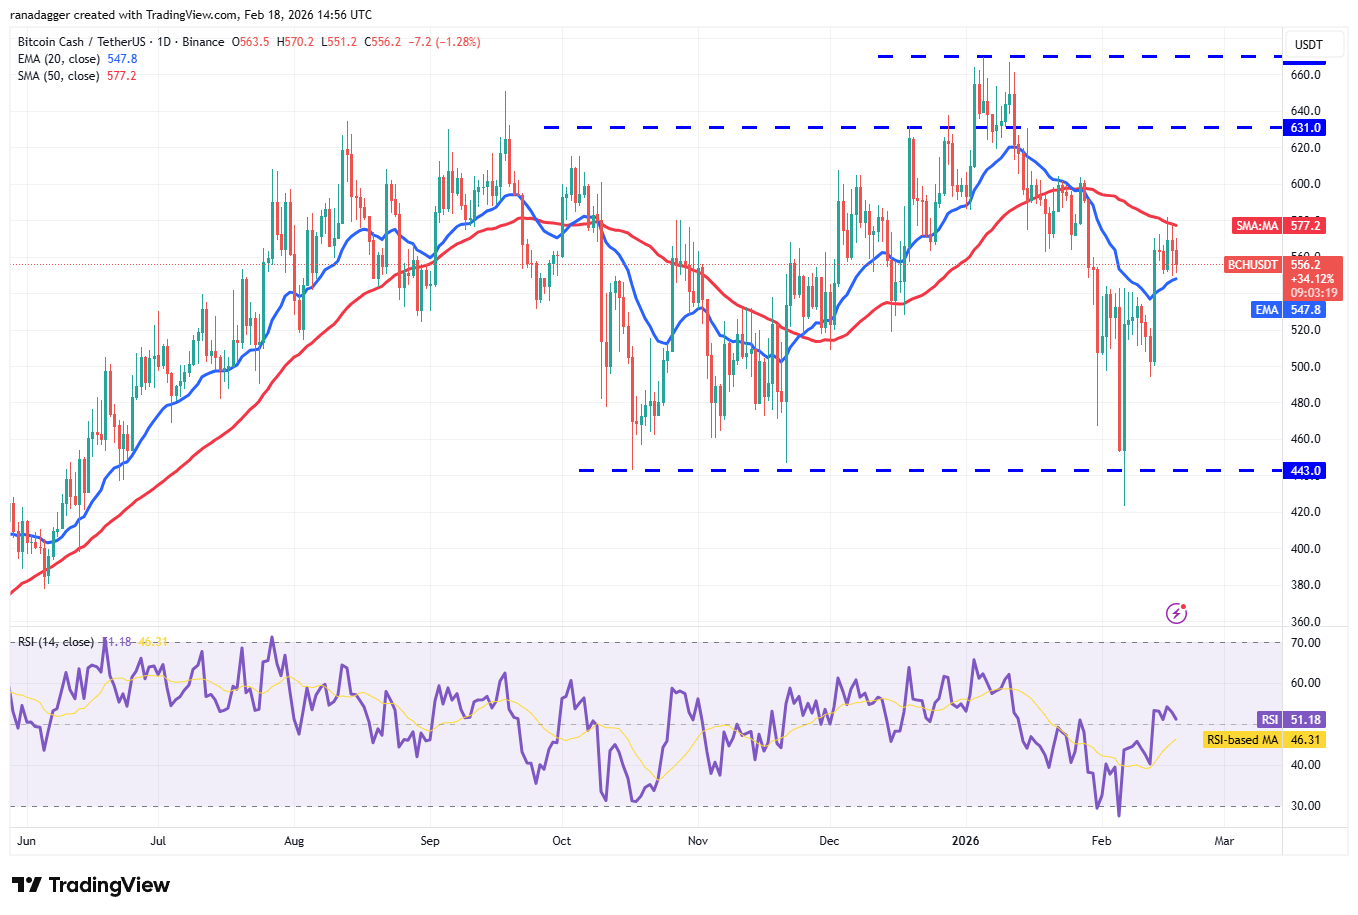
The upsloping 20-day EMA ($547) and the RSI just above the midpoint suggest a possible upside breakout. If that happens, the Bitcoin Cash price might rally to $600 and, after that, to $630.
Contrary to this assumption, if the price turns down and breaks below the 20-day EMA, it signals that the bears have overpowered the bulls. That might start a correction toward the next support at $500.
Related: 4 data points suggest XRP price bottomed at $1.12: Are bulls ready to take over?
Hyperliquid price prediction
Hyperliquid (HYPE) closed below the 20-day EMA ($30.26) on Tuesday, indicating selling at higher levels.
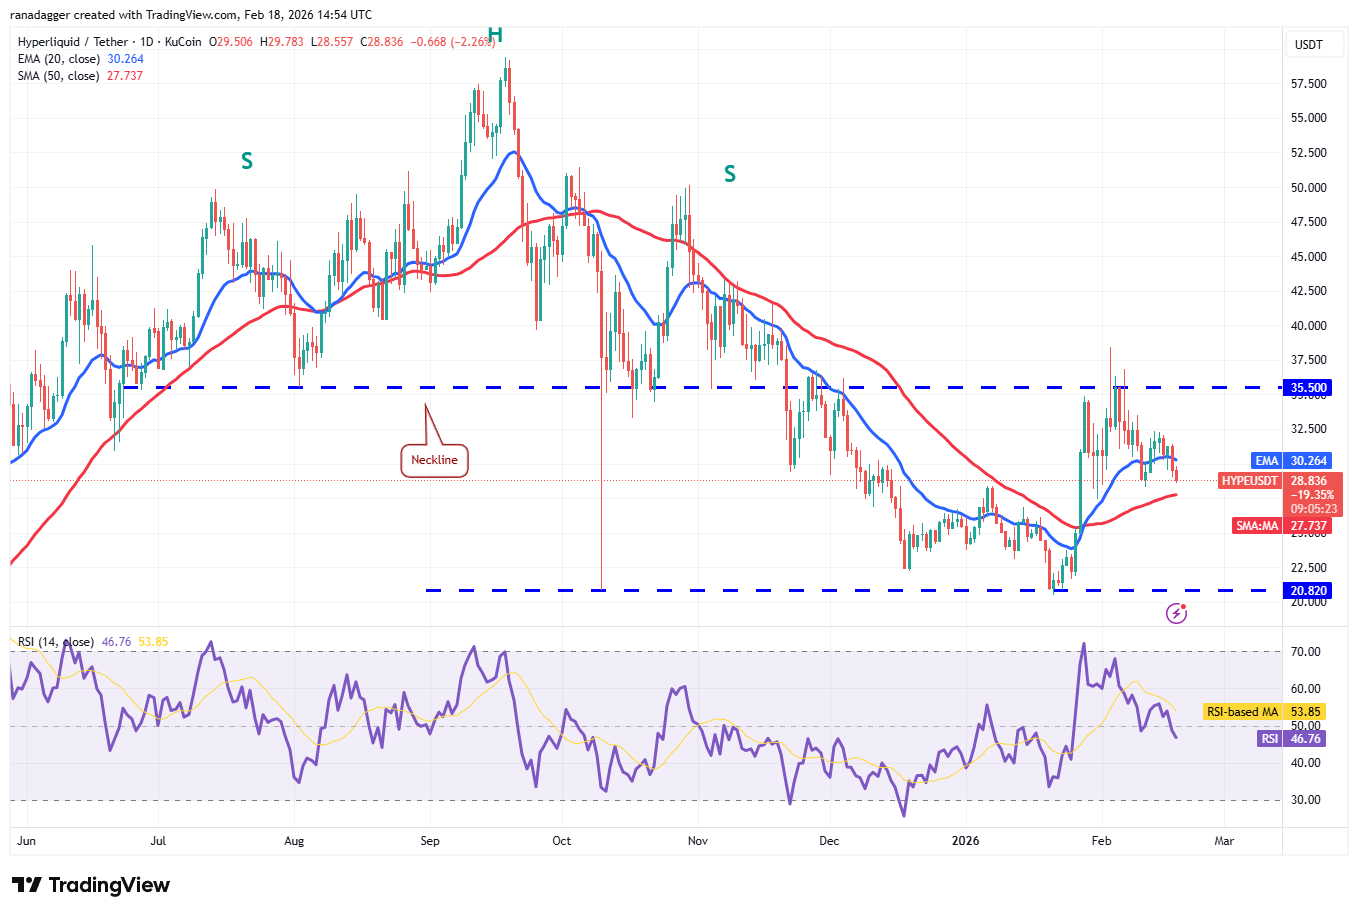
Buyers will attempt to maintain the Hyperliquid price above the 50-day SMA ($27.74), but if the bears prevail, the HYPE/USDT pair may tumble toward the solid support at $20.82. The flattish 20-day EMA and the RSI just below the midpoint suggest a range-bound action between $20.82 and $35.50 for some time.
The first sign of strength for the bulls is a close above the $32.50 level. That opens the doors for a rally to the $35.50 to $38.42 resistance zone.
Cardano price prediction
Cardano (ADA) has been clinging to the 20-day EMA ($0.29), indicating that the bulls have kept up the pressure.
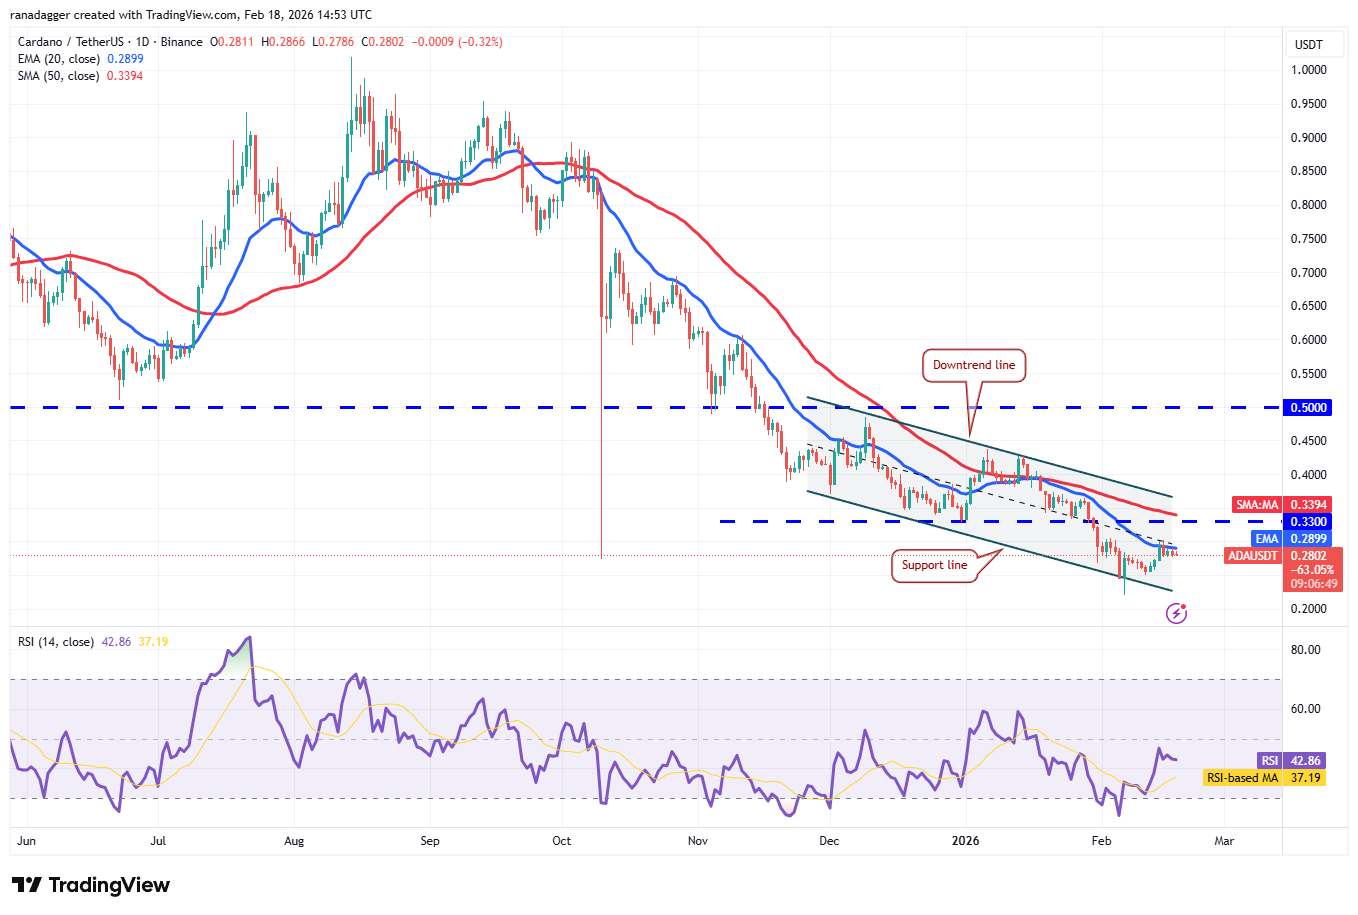
The possibility of a break above the 20-day EMA remains high. If that happens, the ADA/USDT pair may climb toward the downtrend line, which is expected to act as a stiff resistance. If buyers pierce the downtrend line, the Cardano price may rally to $0.44 and then to $0.50.
Sellers will have to tug the price below the support line to regain control. If they manage to do that, the pair might slump toward $0.15.
Monero price prediction
Monero (XMR) remains below the breakdown level of $360, but a positive sign is that the bulls have not allowed the price to slip below the immediate support at $309.
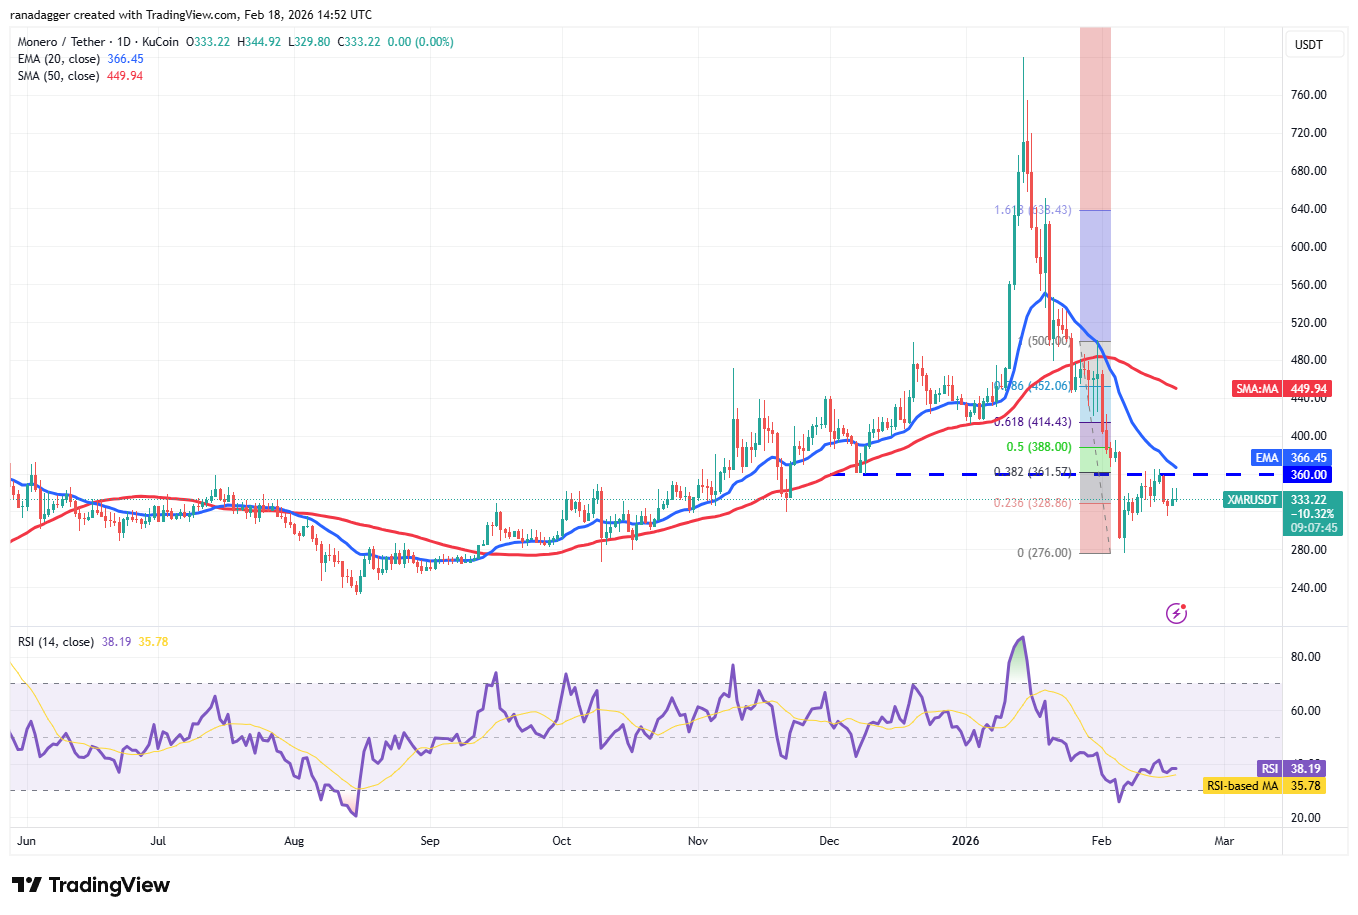
Buyers will have to thrust the Monero price above the 20-day EMA ($366) to gain the upper hand. The XMR/USDT pair may then climb to the 50-day SMA ($449), where the bears are expected to step in.
On the downside, a break and close below the $309 level indicates that the bears remain in control. The pair may then retest the crucial $276 support. A strong rebound off the $276 level might result in a range-bound action for a few days.
This article does not contain investment advice or recommendations. Every investment and trading move involves risk, and readers should conduct their own research when making a decision. While we strive to provide accurate and timely information, Cointelegraph does not guarantee the accuracy, completeness, or reliability of any information in this article. This article may contain forward-looking statements that are subject to risks and uncertainties. Cointelegraph will not be liable for any loss or damage arising from your reliance on this information.
