


Bitcoin (BTC) battled a key 200-week trend line around Thursday’s Wall Street open as “bearish acceleration” fears persisted.
Key points:
-
Bitcoin threatens to add the 200-week exponential moving average to its list of new resistance levels.
-
History offers lessons for what happens when price rejects from the key 200-week trend line.
-
Mayer Multiple values continue to show BTC in deep “oversold” territory.
Bitcoin’s fate hangs on $68,300 reclaim
Data from TradingView showed BTC price action focusing on the area around $67,000 for a second day.
Bulls already faced a lack of momentum — something stopping them from reclaiming the old 2021 all-time high at $69,000.
Now, Bitcoin’s 200-week exponential moving average (EMA) came into focus as a potential second new resistance level.
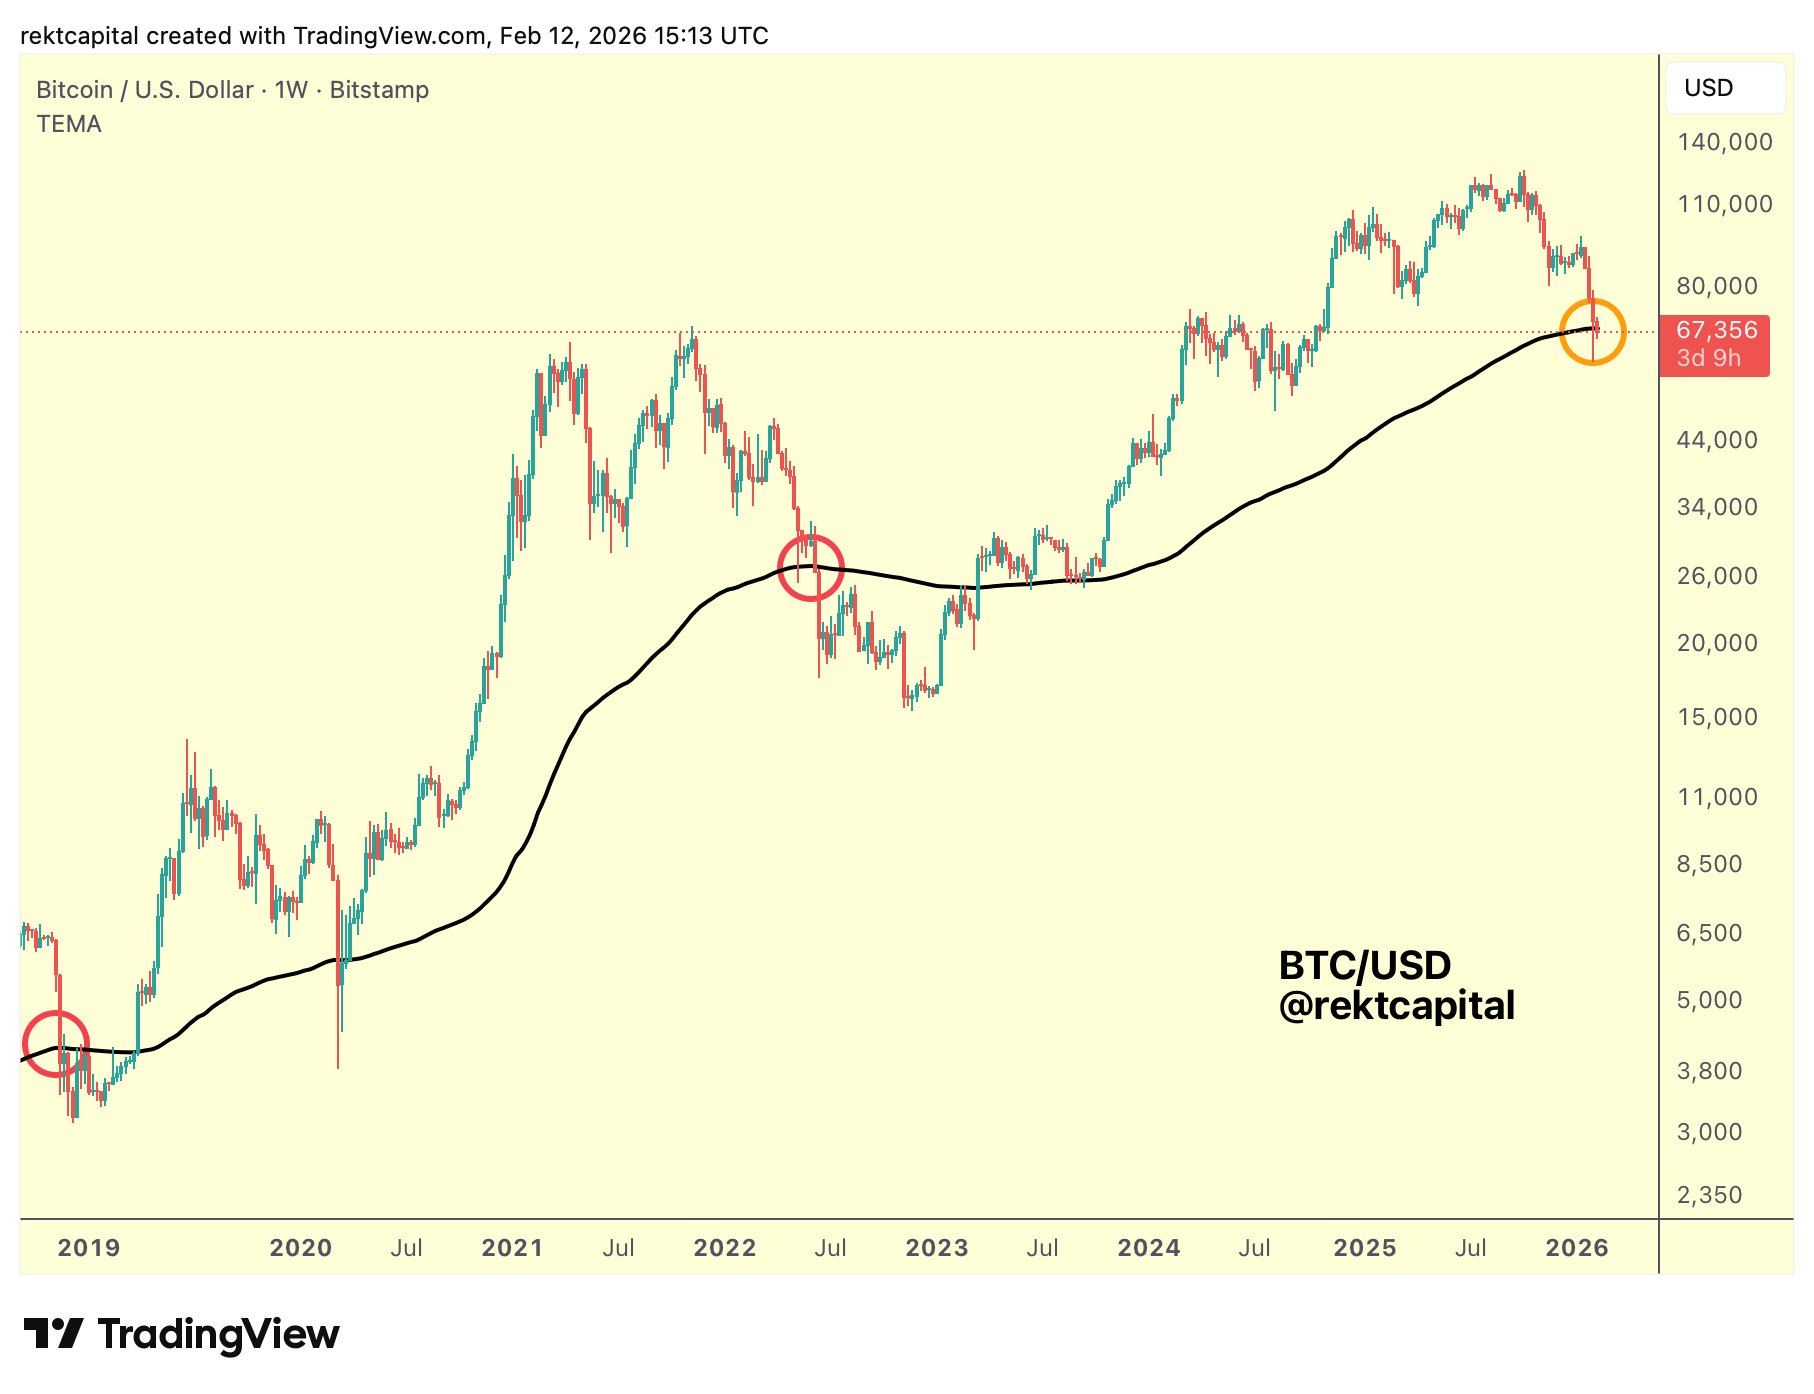
Commenting on the phenomenon, trader and analyst Rekt Capital employed comparisons to previous Bitcoin bear markets to warn that a failure to rescue the 200-week EMA would result in worse price downside.
“What would confirm additional downside for Bitcoin? Historically, a Weekly Close below the 200-week EMA (black) followed by a post-breakdown retest of the EMA into new resistance (red circles) has triggered additional Bearish Acceleration,” he wrote alongside a chart on X.
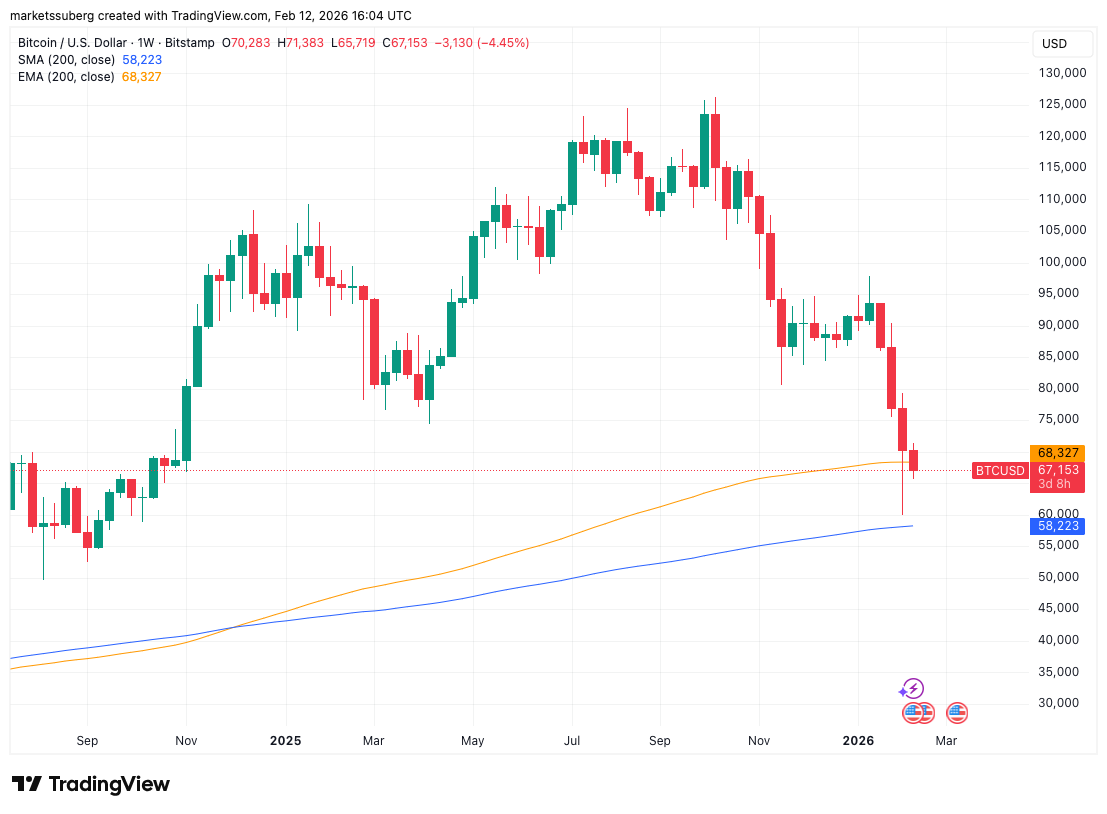
“The 200-week EMA (black) represents the price point of ~$68300. Therefore a Weekly Close below ~$68300 followed by a bearish retest of it would likely position Bitcoin for a repeat of history with additional downside over time.”
Analysis had hoped that the EMA would act as a long-term BTC price floor prior to last week’s break below $60,000. Together with the 200-week simple moving average (SMA), it now forms a “cloud” of support that price has so far avoided violating.
Adopting a more hopeful tone, William Clemente, head of strategy at crypto over-the-counter settlement platform Styx, eyed a buying opportunity.
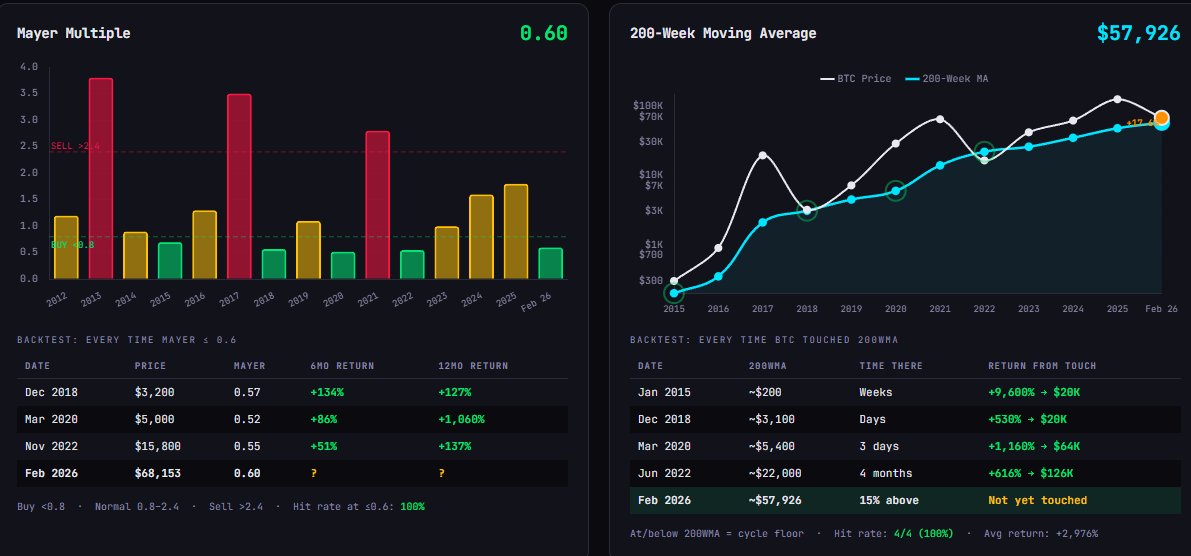
“Throughout Bitcoin’s life span we have seen two indicators continue to be the best global market bottom signals: The Mayer multiple (distance from 200 day moving average) and the 200 week moving average,” he argued on the day.
“Both of these are clearly in long term accumulation territory.”
Classic BTC price metric screams “cheap”
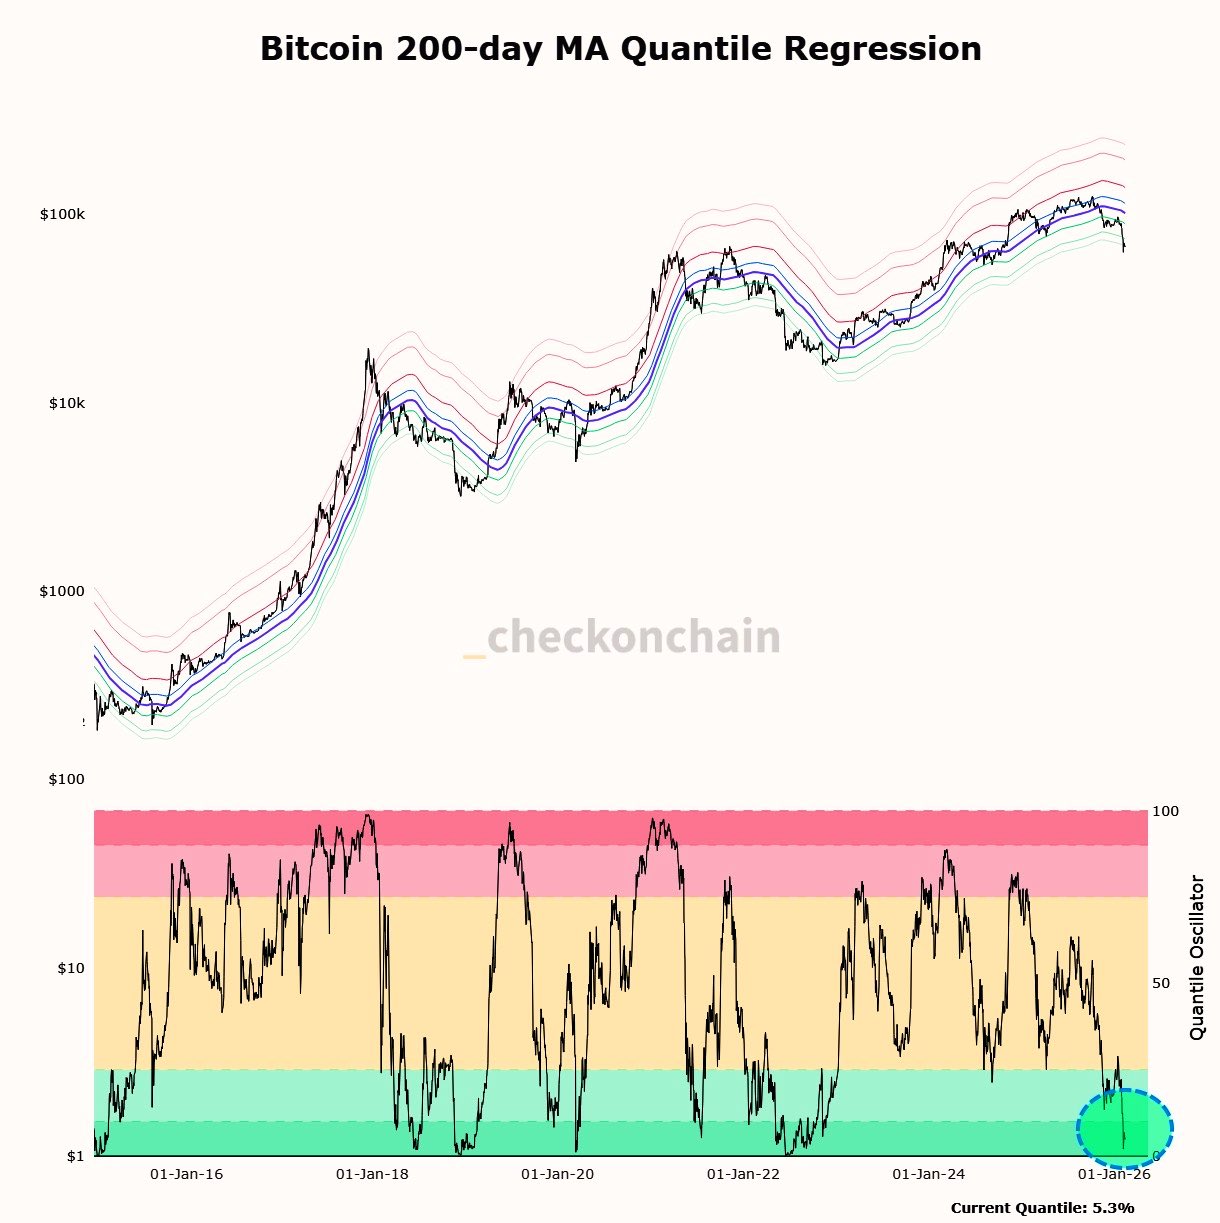
Continuing on the topic, the X analytics account named after famous economist Frank Fetter stressed just how rare current Mayer Multiple readings were.
Related: BTC traders wait for $50K bottom: Five things to know in Bitcoin this week
The Multiple is one of the best-known Bitcoin price yardsticks, and readings below 0.8 traditionally signify good long-term odds of returns. At the other end of the scale, a reading above 2.4 implies that caution is warranted.
“Only 5.3% of days have seen the Bitcoin Mayer Multiple at a lower level. Yeah it can go lower but I’m running out of ways to say BTC is cheap here,” the account told followers.
As Cointelegraph reported, Bitcoin last saw such low Mayer Multiple levels during the 2022 bear market.
Last week, Charles Edwards, founder of quantitative Bitcoin and digital asset fund Capriole Investments, agreed.
“It rarely hits 0.6x. Can price go lower?” he queried.
“Yes, but this is historically one of the best buy signals in Bitcoin history.”
This article does not contain investment advice or recommendations. Every investment and trading move involves risk, and readers should conduct their own research when making a decision. While we strive to provide accurate and timely information, Cointelegraph does not guarantee the accuracy, completeness, or reliability of any information in this article. This article may contain forward-looking statements that are subject to risks and uncertainties. Cointelegraph will not be liable for any loss or damage arising from your reliance on this information.
