


Solana’s SOL (SOL) has dropped 38% over the last 30 days, falling to a two-year low of $67 on Friday. Multiple analysts believe that the downside is not over for the seventh-placed cryptocurrency, with downward targets extending as low as $30.
Key takeaways:
-
Solana’s head-and-shoulders pattern targets a SOL price of $50 or lower.
-
MVRV bands point to a potential bottom, but support at $75 must hold.
Solana targets $42 after bearish confirmation
SOL price has already lost over 72% of its value since a cycle top of around $295 in January 2025. In doing so, its price confirmed a head-and-shoulders (H&S) pattern on multiple time frames.
Related: Pump.fun moves deeper into trading infrastructure with Vyper acquisition
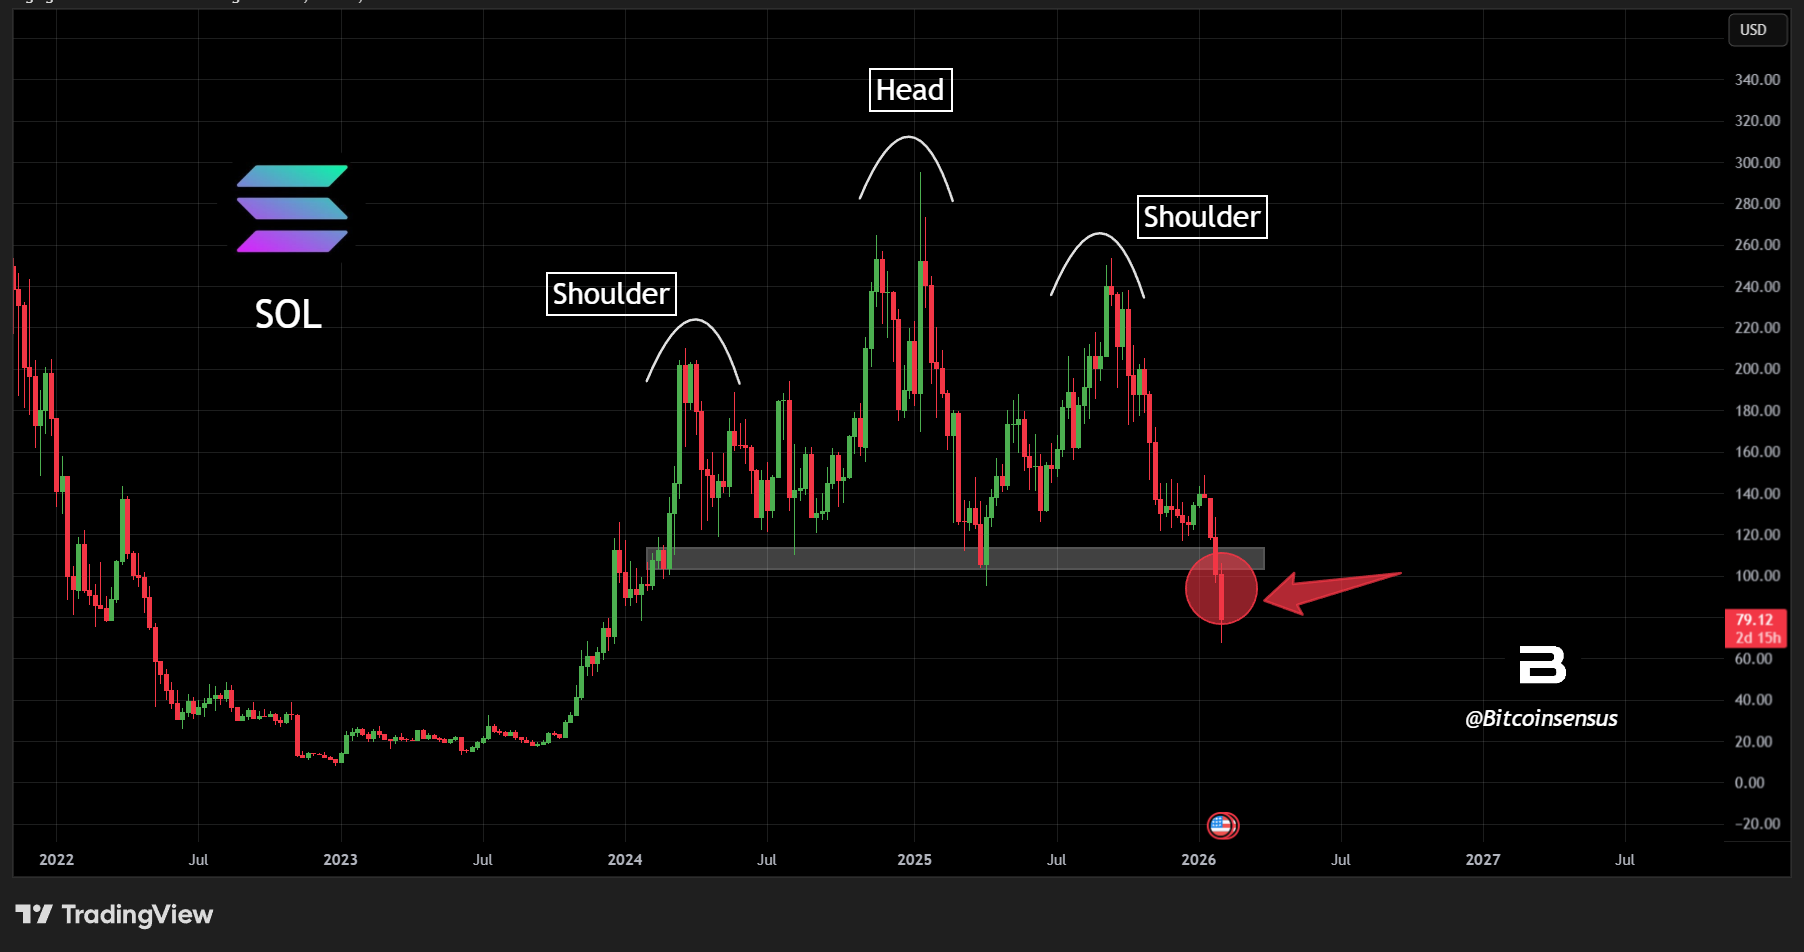
Crypto analyst Bitcoinsensus shared a chart showing SOL validating a H&S pattern, hinting at more downside ahead.
“Solana has confirmed a breakdown from this macro Head & Shoulders pattern,” Bitcoinsensus said in a Monday post on X, adding:
“The target could be as low as $50 per $SOL.”
“This is a classic head and shoulders pattern with a measured move to $45,” analyst Nextiscrypto said about SOL’s two-week chart. But other analysts said the price can go even lower.
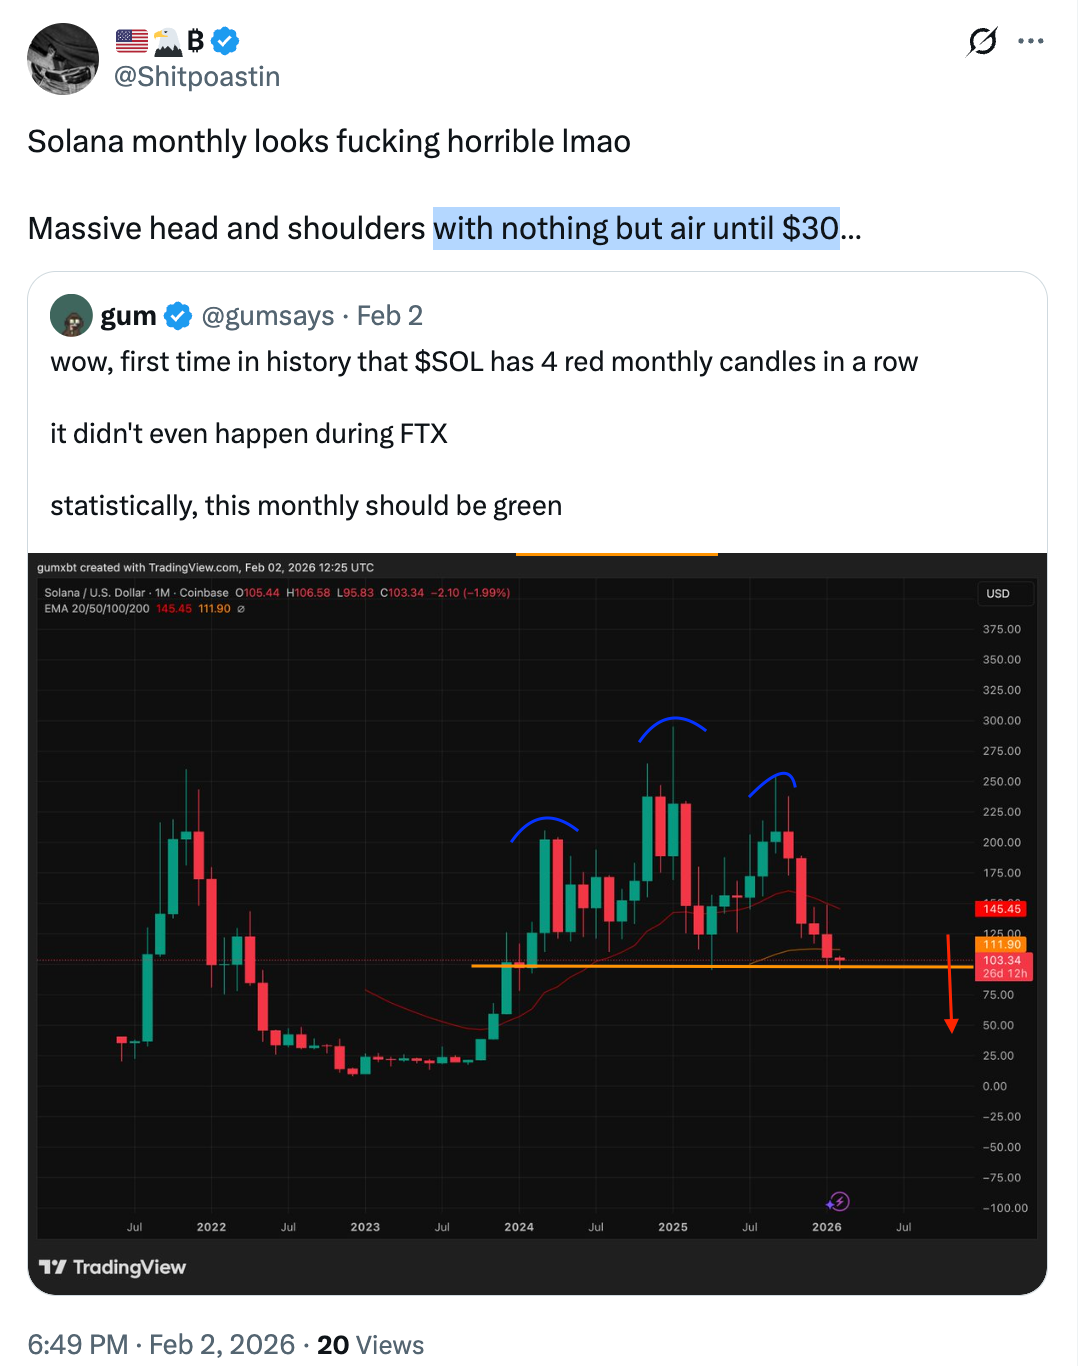
Pseudonymous analyst “Shitpoastin” said Solana’s price has also formed a “massive head and shoulders” pattern on the monthly chart over two years, “with nothing but air until $30.”
The two-day candle chart, meanwhile, shows that SOL price had broken below the H&S neckline at $120 on Jan. 30.
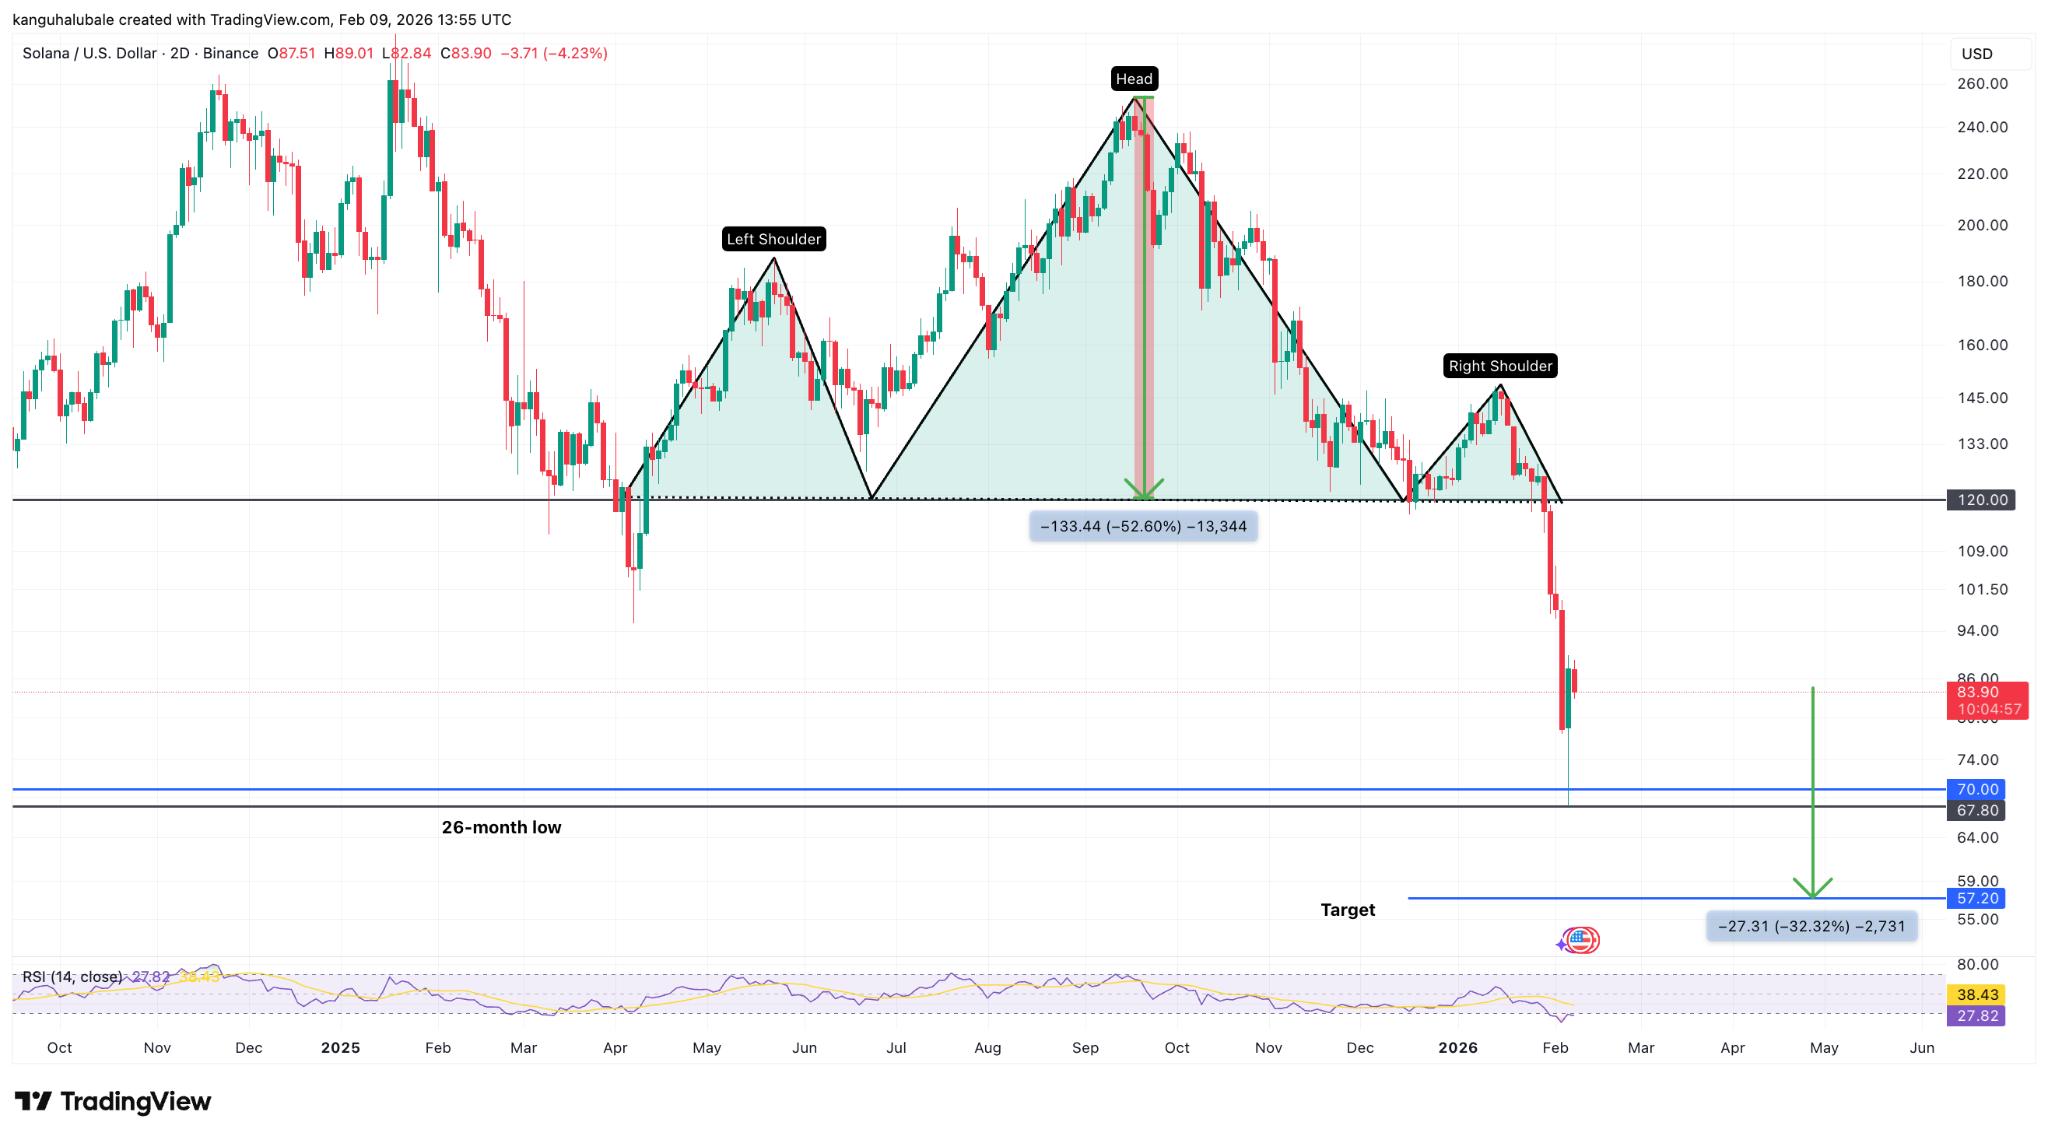
The measured target of the H&S pattern, calculated by adding the head’s height from the breakdown point, is $57, representing a 32% drop from the current level.
Solana’s MVRV bands give hope for a bottom at $75
SOL’s price crash last week was stopped by support from the lowest boundary of its MVRV extreme deviation pricing bands, currently at $75.
These bands show when SOL is below or above the average price at which traders last moved their coins.
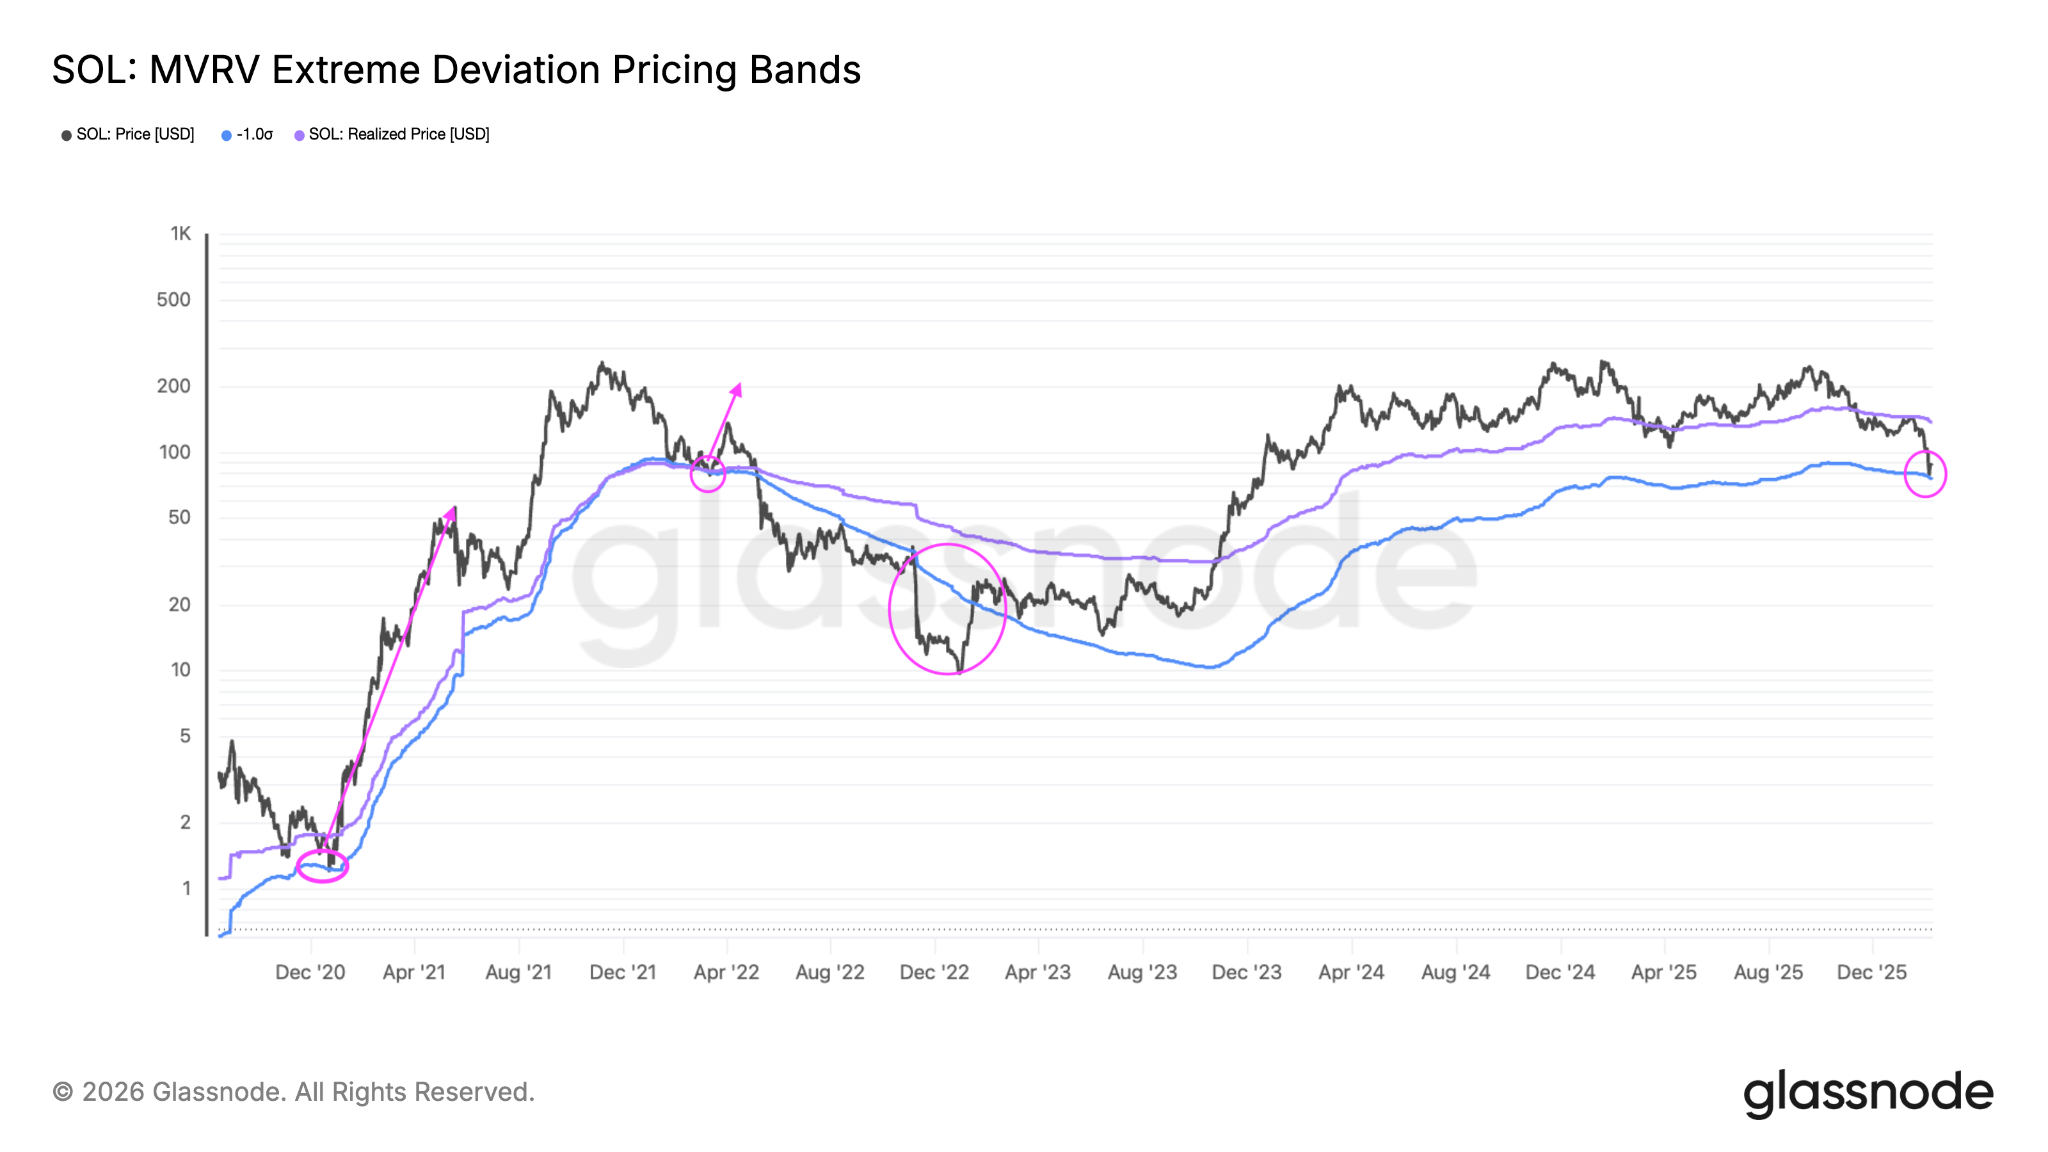
Historically, SOL prices drop to near or even below the lowest MVRV band before a bottom is reached.
That includes the March 2022 bounce, when the SOL price rose 87% within three weeks to $140 after testing the lowest MVRV deviation band around $75. A similar rebound occurred earlier in December 2020.
Solana’s association with the FTX crash in November 2022, however, saw a significant deviation below this band, with the price dropping another 70% and bottoming around $7 in December that year.
Therefore, SOL’s drop below $75 spark the next phase of the correction as seen in 2022, likely aligning with the H&S target.
This article does not contain investment advice or recommendations. Every investment and trading move involves risk, and readers should conduct their own research when making a decision. While we strive to provide accurate and timely information, Cointelegraph does not guarantee the accuracy, completeness, or reliability of any information in this article. This article may contain forward-looking statements that are subject to risks and uncertainties. Cointelegraph will not be liable for any loss or damage arising from your reliance on this information.
