


Key points:
-
Bitcoin has started a relief rally, which is expected to face selling near $84,000.
-
Several major altcoins are at risk of breaking below their support levels if the bulls fail to clear the overhead resistance levels.
Bitcoin (BTC) turned up from the $74,508 level on Monday, and the buyers are attempting to maintain the price above $79,000. BTC analyst PlanC said in a post on X that the fall to the $75,000 to $80,000 zone might be “the deepest pullback opportunity this Bitcoin bull run.”
The Crypto Fear & Greed Index, which measures overall crypto market sentiment, plunged into the “Extreme Fear” zone with a score of 14, the lowest in 2026. Crypto analytics platform Santiment said in a report on Friday that the extreme negativity on social media was a silver lining as “historically, crypto markets move in the opposite direction of the crowd’s expectations.”
However, not everyone believes that a bottom is in. Several analysts are bearish on BTC and expect it to fall further. Traders on Polymarket also anticipate the downtrend to continue, with the odds of BTC falling below $65,000 rising to 72% on Monday.
Could BTC and the major altcoins start a strong relief rally in the near term? Let’s analyze the charts of the top 10 cryptocurrencies to find out.
S&P 500 Index price prediction
The S&P 500 Index (SPX) fell to the 50-day simple moving average (6,864) on Thursday, but the bulls successfully defended the level.
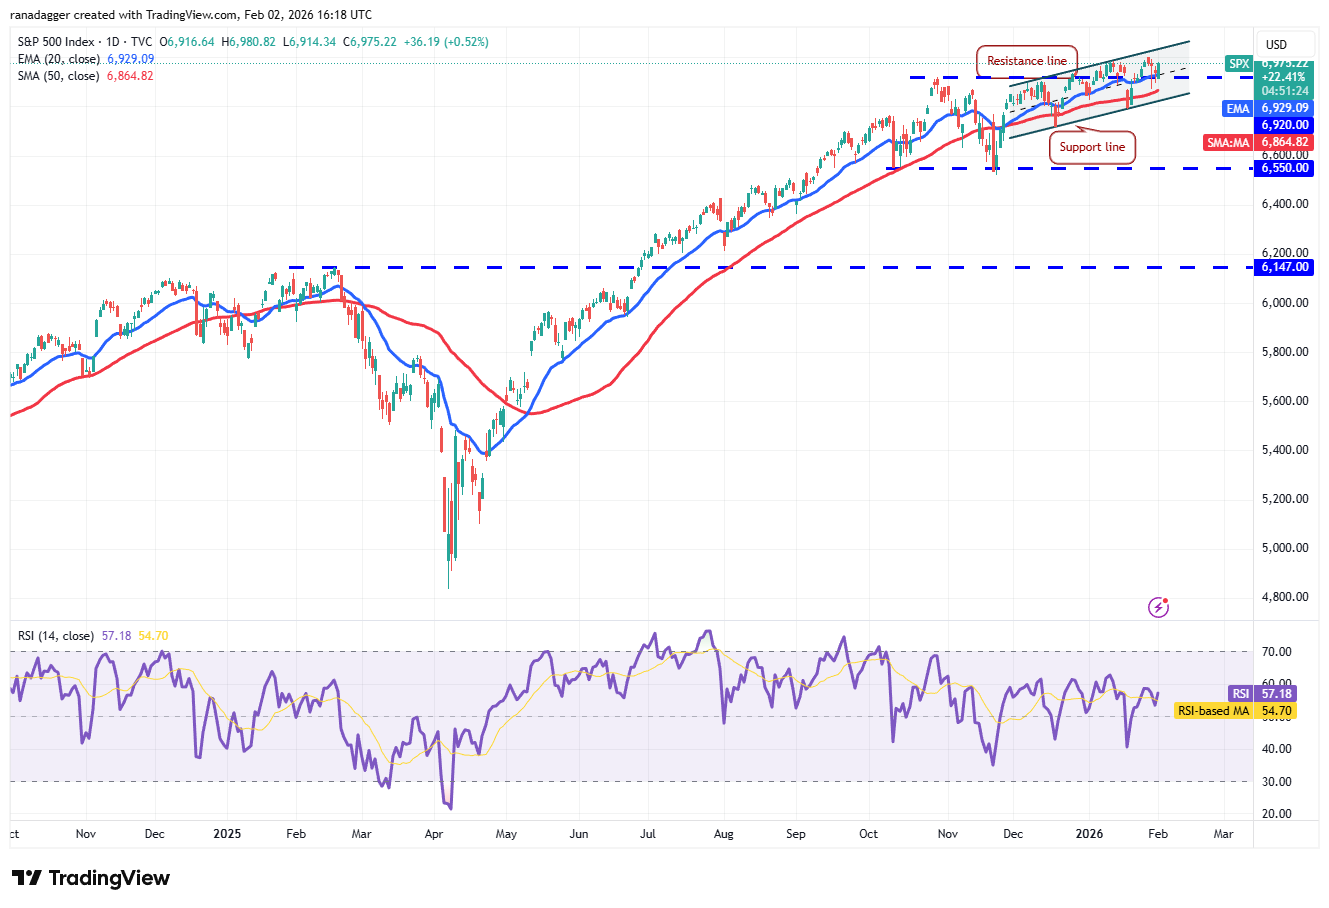
The bulls will have to thrust the price above the resistance line of the ascending channel pattern to indicate the resumption of the uptrend. The index may then rally to 7,290.
Contrary to this assumption, if the price turns down from the resistance line and breaks below the 20-day exponential moving average ($6,929), it suggests that the index may remain inside the channel for a while longer. The bears will gain the upper hand on a close below the support line. The index may then decline toward the 6,550 support.
US Dollar Index price prediction
The US Dollar Index (DXY) tumbled below the 96.21 support on Tuesday, but the bears could not sustain the lower levels.
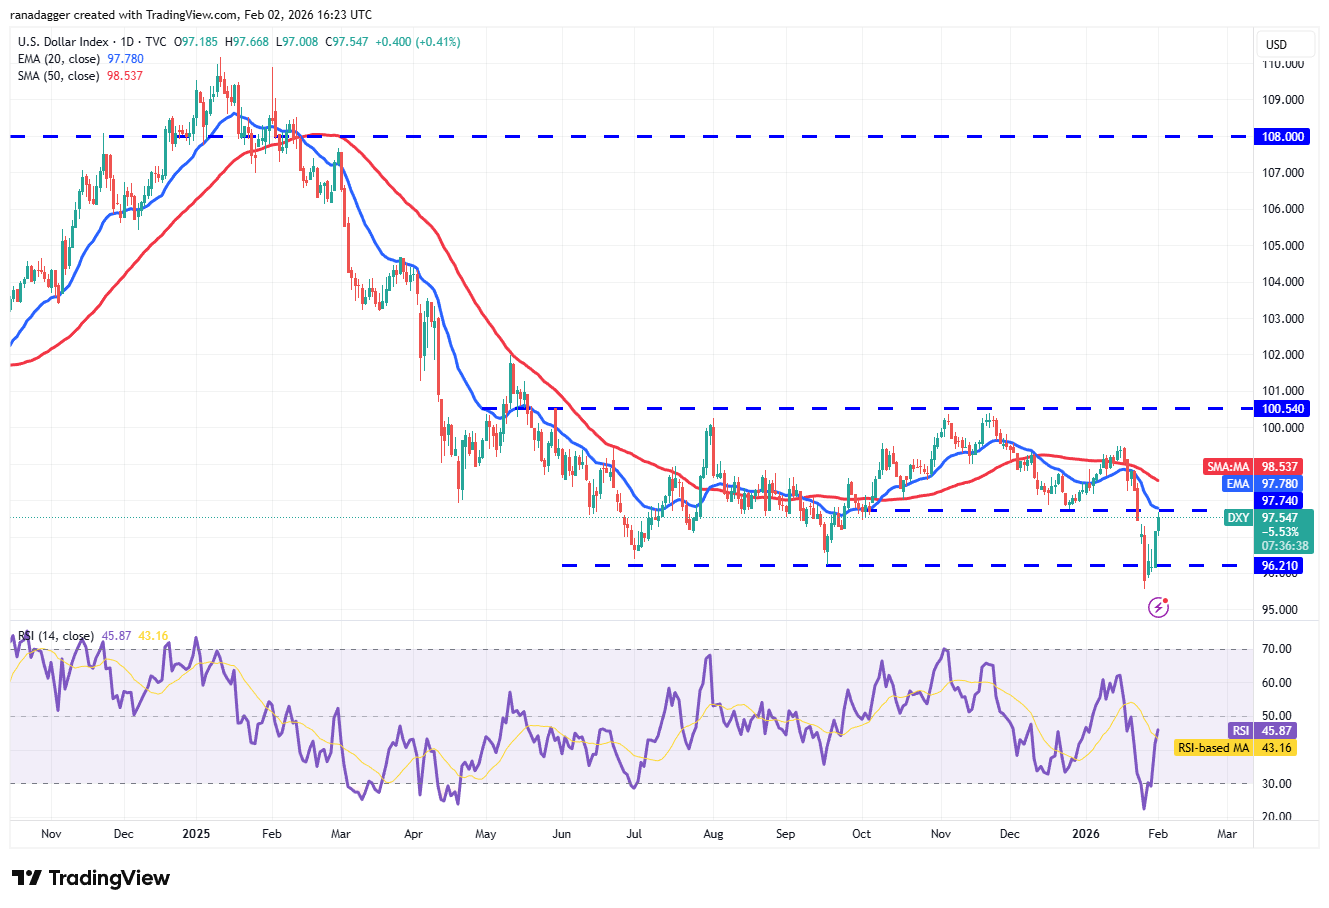
The bulls pushed the price back above the 96.21 level on Wednesday, but the recovery is expected to face selling at the 20-day EMA ($97.78). If the price turns down sharply from the 20-day EMA, the bears will attempt to sink the index below the 96.21 level.
On the other hand, a break and close above the 20-day EMA suggests that the break below the 96.21 level may have been a bear trap. The index may then rally toward the stiff overhead resistance of 100.54.
Bitcoin price prediction
BTC fell below the Nov. 21, 2025, low of $80,600 on Saturday and reached the critical support of $74,508 on Monday.
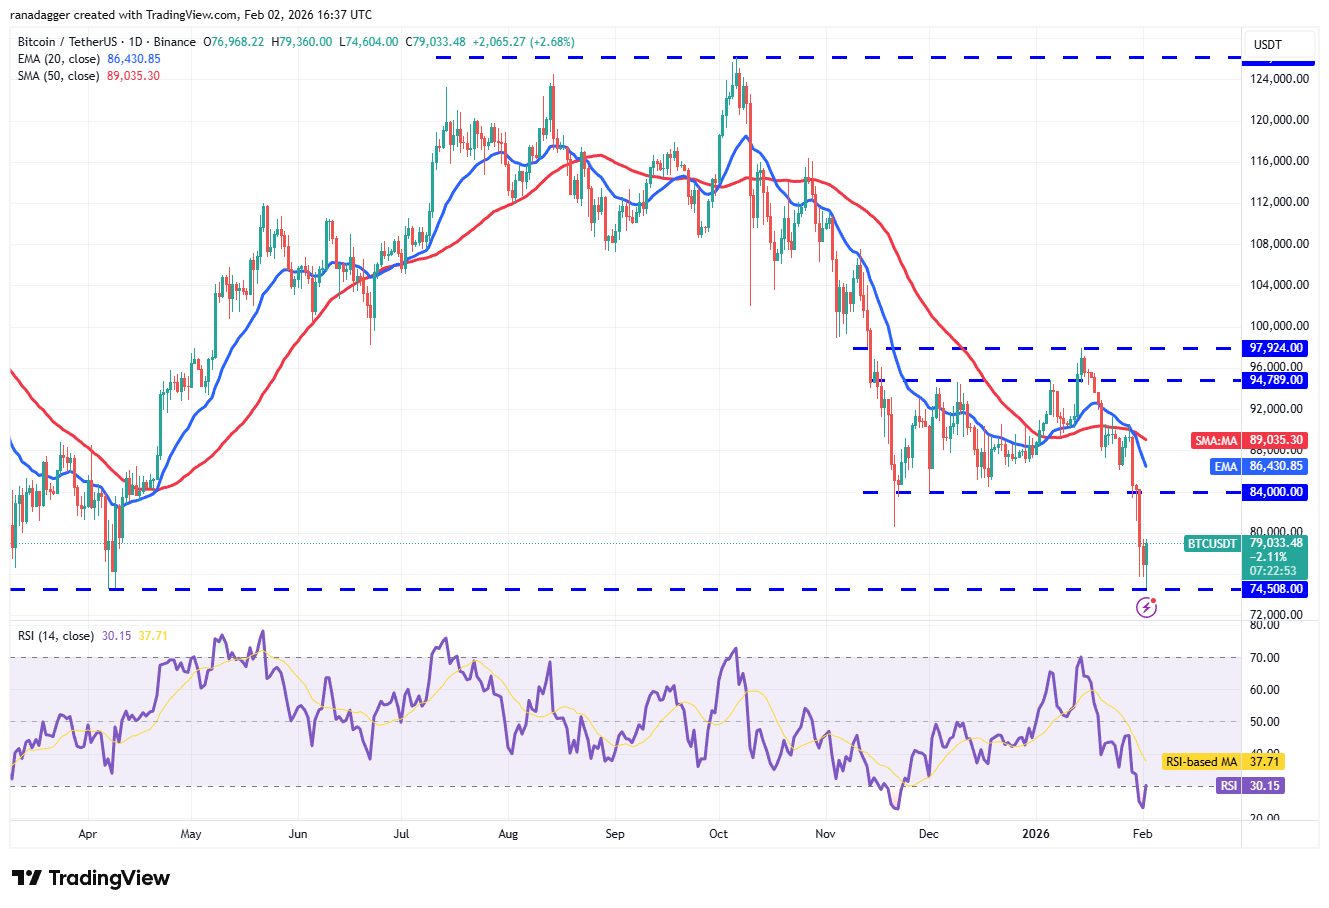
The relative strength index (RSI) plunged into the oversold territory, signaling a possible relief rally in the near term. The Bitcoin price is expected to face selling in the $80,600 to $84,000 zone. If the BTC/USDT pair turns down sharply from the overhead zone, the risk of a break below the $74,508 level increases. The next support on the downside is at $60,000.
The first sign of strength will be a break and close above the moving averages. That suggests the $74,508 level will continue to behave as a floor for some more time.
Ether price prediction
Ether (ETH) broke below the $2,623 level on Saturday and fell to the next major support of $2,111 on Monday.
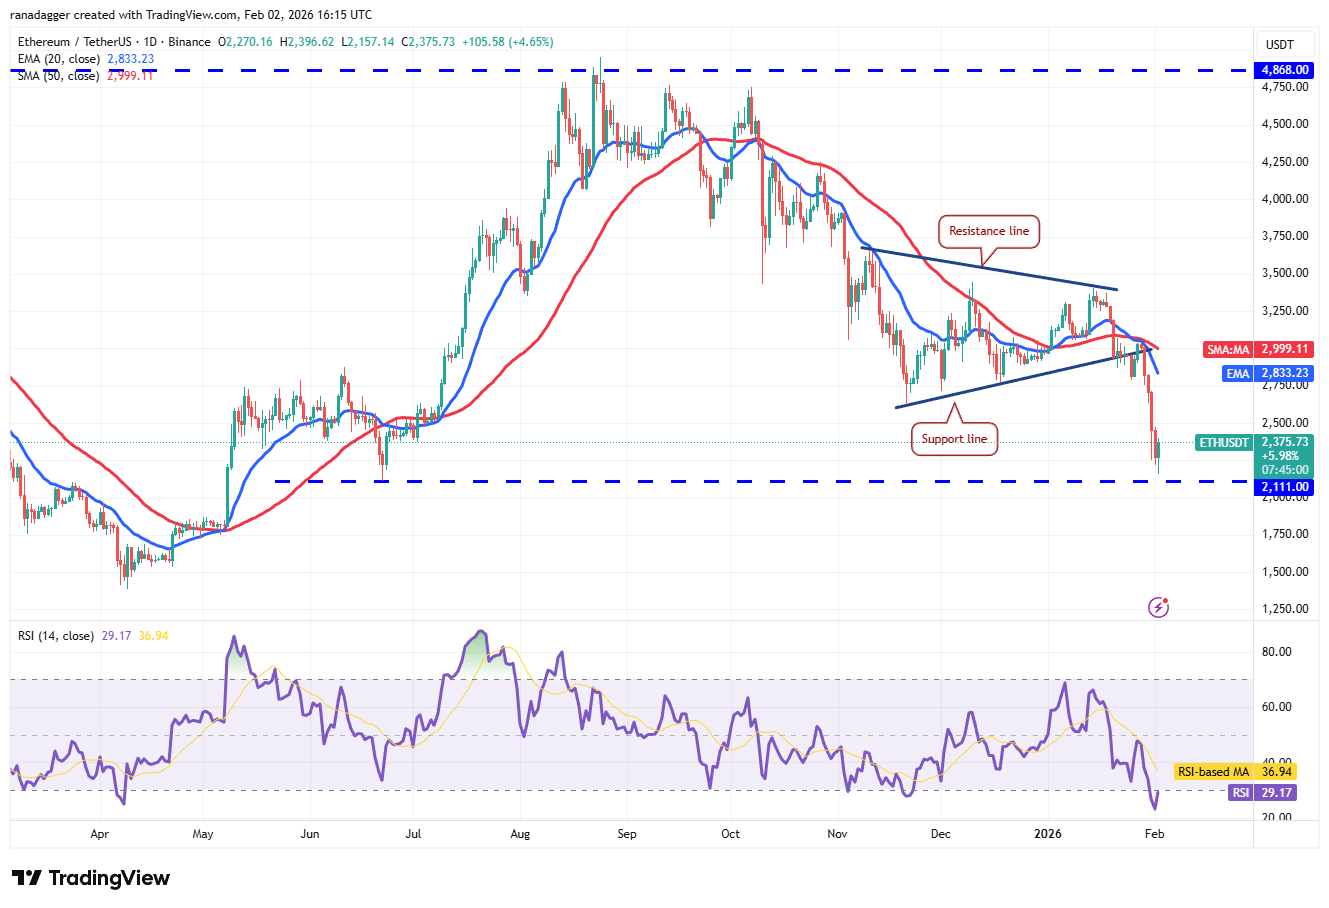
The RSI has slipped into the oversold category, indicating that the selling may have been overdone in the near term. That increases the possibility of a relief rally, which is expected to face selling at the 20-day EMA ($2,833).
A shallow bounce off the current level or a sharp reversal from the 20-day EMA suggests that the advantage remains with the bears. If the $2,111 support cracks, the Ether price may descend to $1,750. The bulls will be back in the game after the ETH/USDT pair rises above the moving averages.
BNB price prediction
BNB (BNB) plummeted below the uptrend line and the $790 support on Saturday, indicating aggressive selling by the bears.
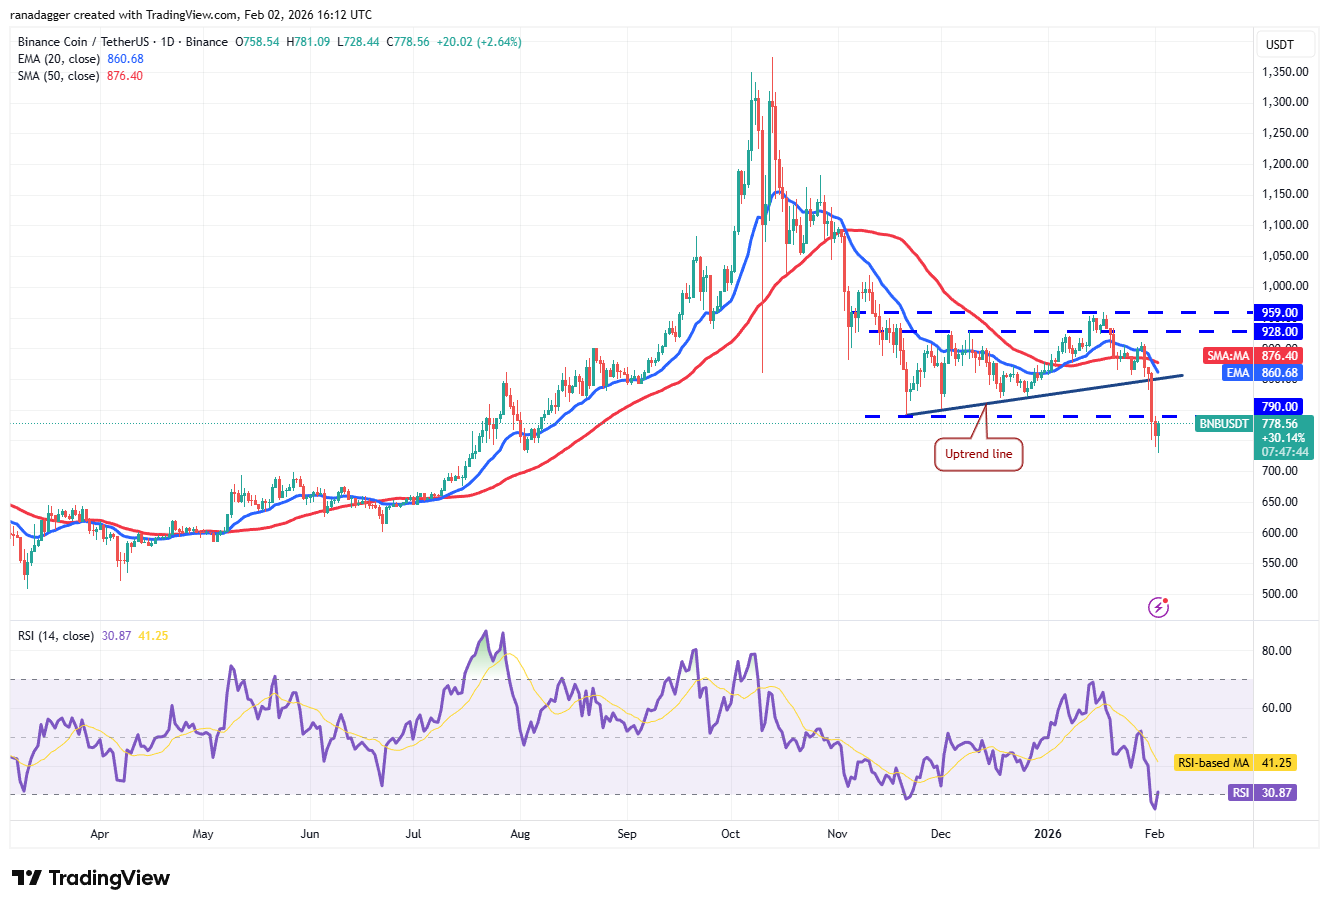
The bulls are attempting to protect the $730 support, but the relief rally is expected to face selling at the breakdown level of $790. If the BNB price turns down sharply from $790, it signals that the bears have flipped the level into resistance. That increases the prospects of a drop to $700.
Instead, if the price closes above $790, it suggests that the lower levels are attracting buyers. The BNB/USDT pair may then rally to the moving averages, where the bulls are expected to encounter solid selling by the bears.
XRP price prediction
XRP (XRP) is witnessing a tough battle between the buyers and sellers at the crucial $1.61 support.
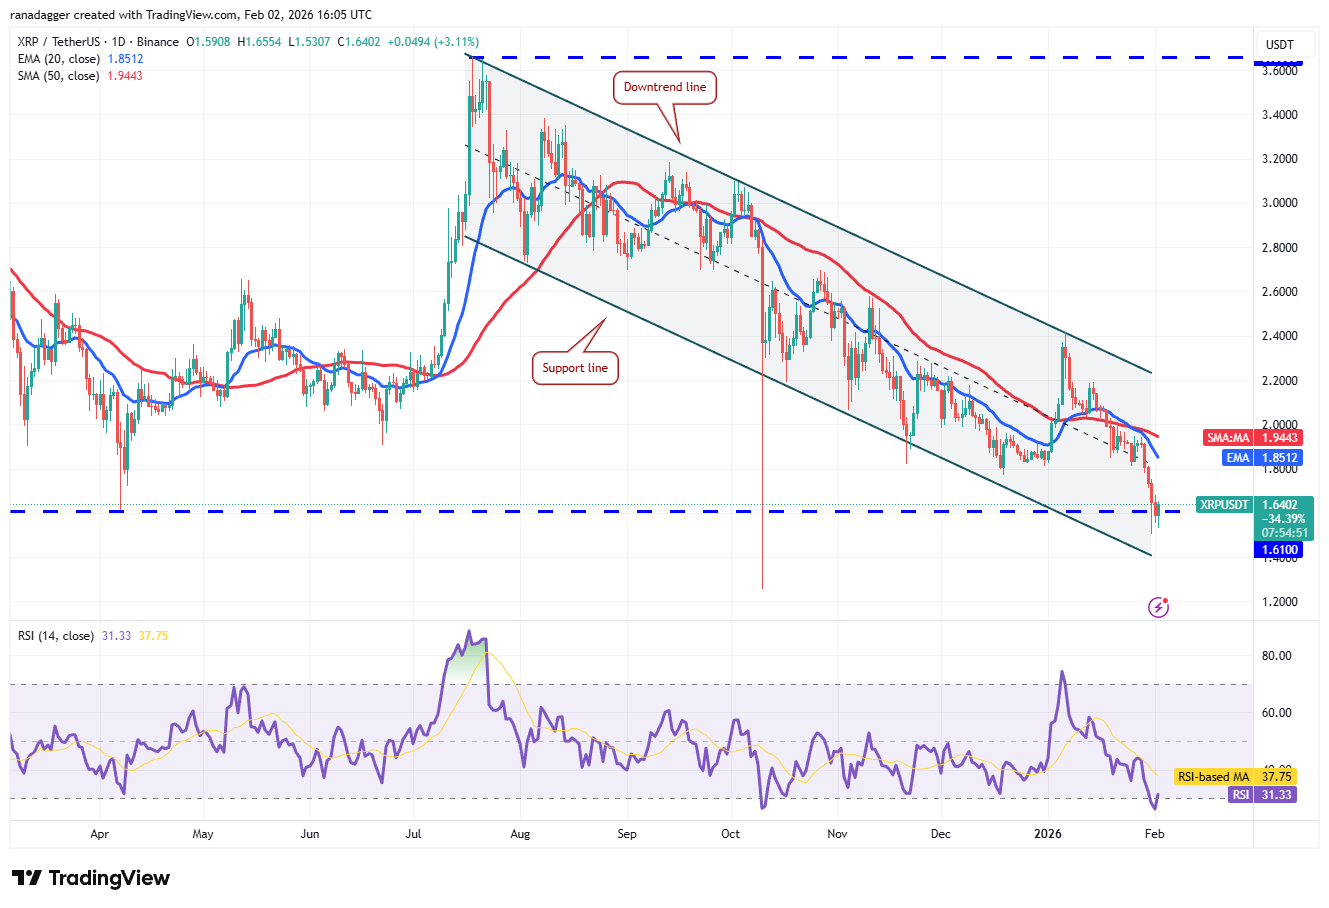
A shallow bounce increases the likelihood of a drop to the support line of the descending channel pattern. Buyers are expected to defend the support line, as a break below it might sink the XRP/USDT pair to the Oct. 10, 2025, low of $1.25.
The moving averages are the critical resistance to watch out for on the upside. A close above the moving averages suggests that the XRP price may remain inside the channel for a few more days.
Solana price prediction
Solana (SOL) collapsed below the $117 level on Saturday and reached the critical support at $95.
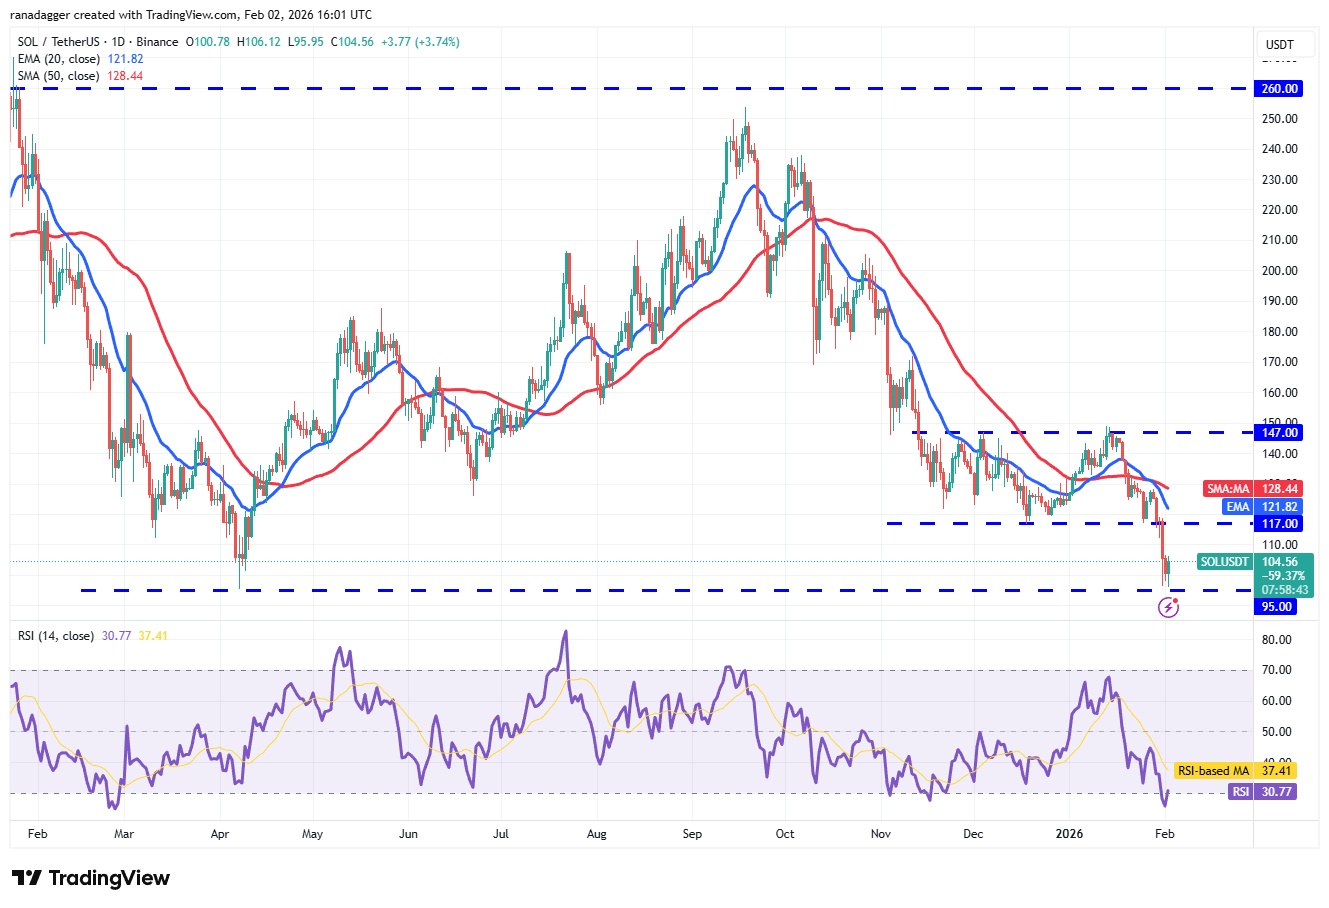
The bulls have successfully defended the $95 level, but the failure to start a strong bounce suggests that the bears continue to exert pressure. If the $95 support gives way, the SOL/USDT pair may start the next leg of the downtrend to $79.
Contrarily, if the Solana price rises above $107, the recovery may reach the 20-day EMA ($121). Sellers will attempt to defend the 20-day EMA, but if the bulls prevail, the pair may march toward the $147 resistance.
Related: XRP price risks repeating 2022 crash as new buyers go underwater
Dogecoin price prediction
Dogecoin (DOGE) plunged below the Oct. 10, 2025, low of $0.10 on Saturday, indicating aggressive selling by the bears.
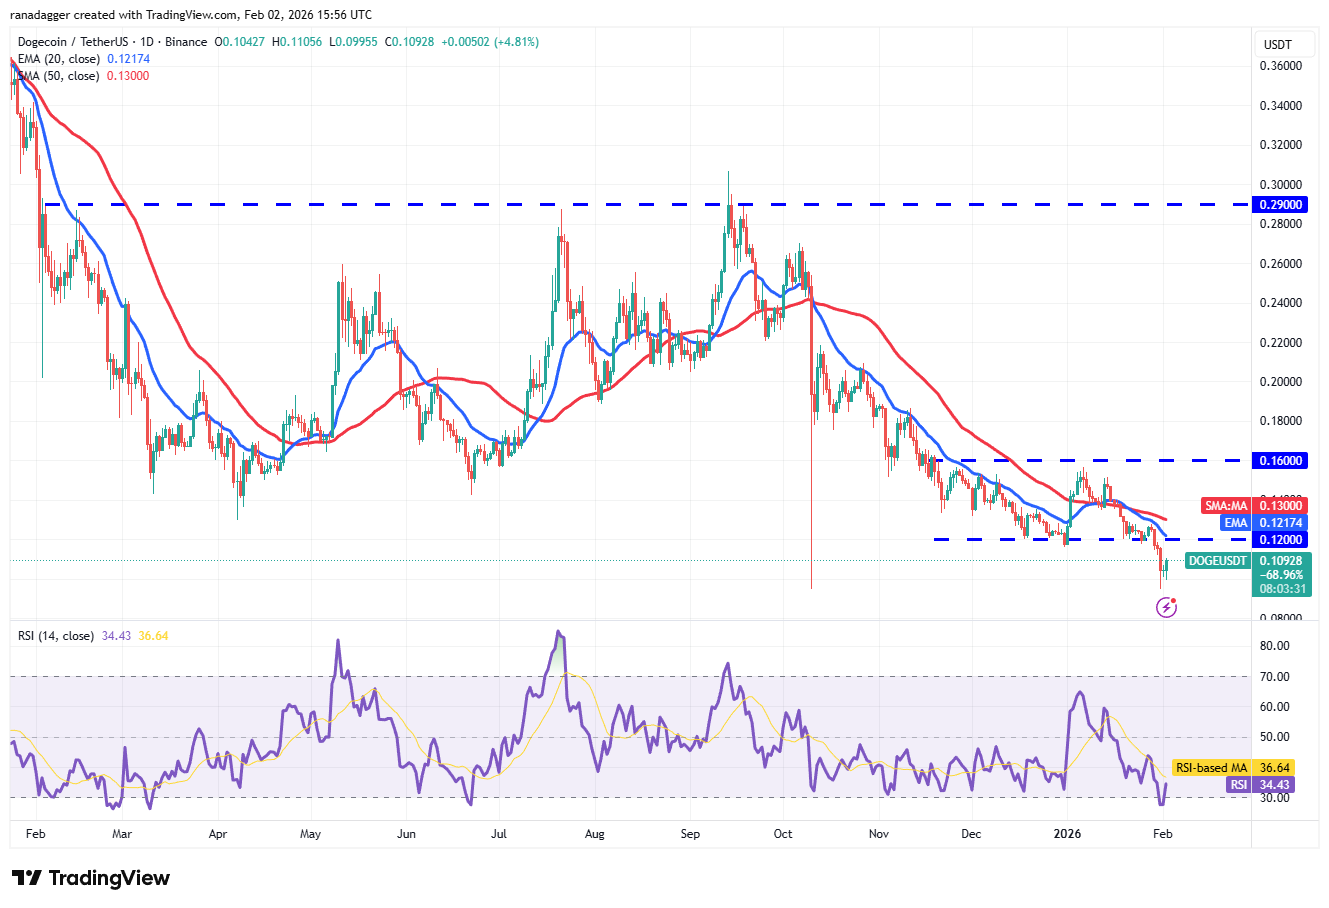
The bulls have started a relief rally, which is expected to face selling at the 20-day EMA ($0.12). If the Dogecoin price turns down sharply from the 20-day EMA, the risk of a break below the $0.10 level increases. The DOGE/USDT pair may then nosedive to $0.08.
Alternatively, if buyers pierce the 20-day EMA, it suggests that the market has rejected the break below the $0.10 level. The pair will then attempt a rally to the solid overhead resistance at $0.16.
Cardano price prediction
Cardano (ADA) fell below the Oct. 10, 2025, low of $0.27 on Saturday, signaling that the bears remain in charge.
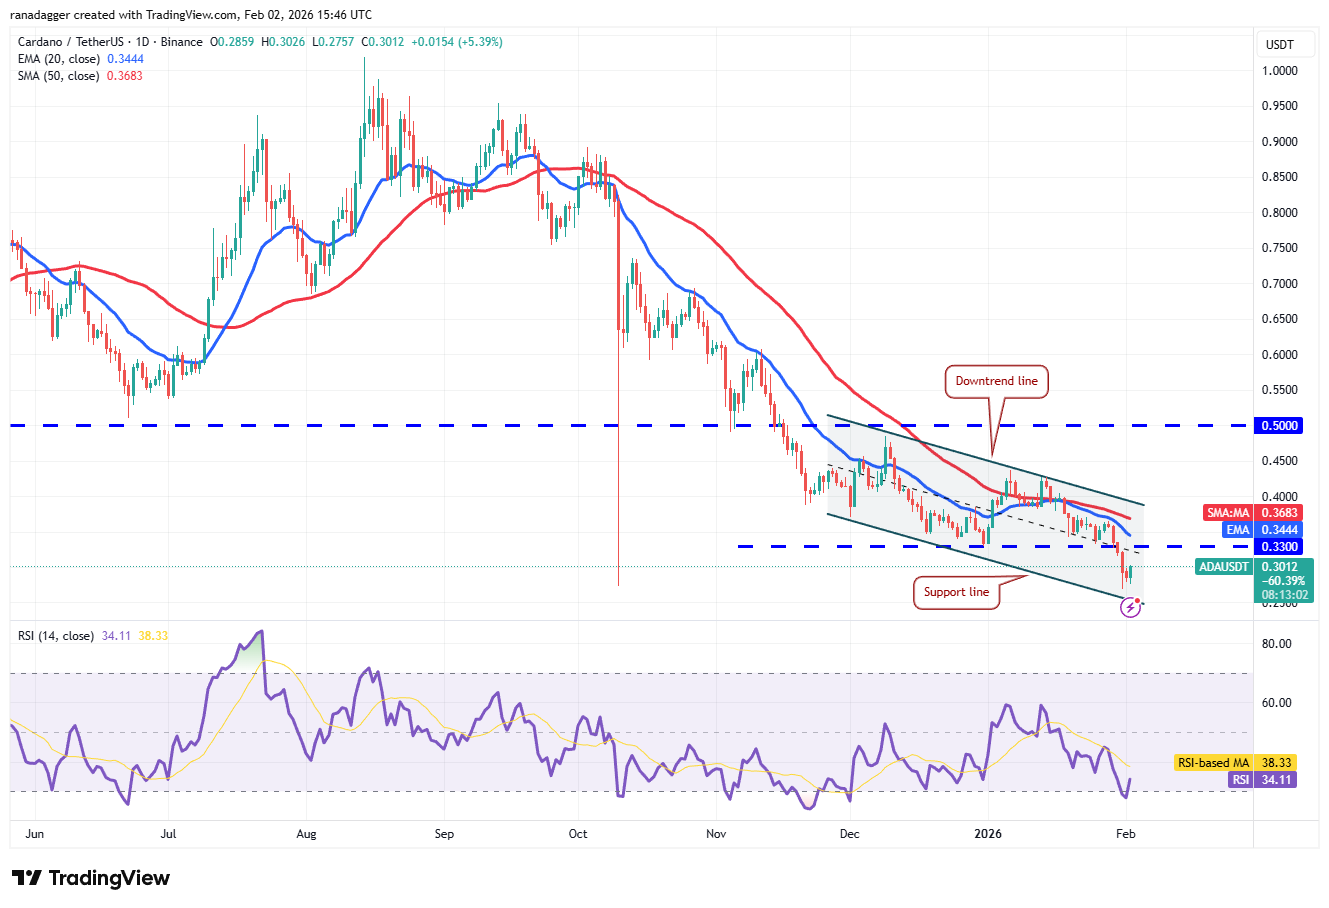
The Cardano price has bounced off the support line but is expected to face selling at the 20-day EMA ($0.34). If the price turns down sharply from the 20-day EMA, the bears will again try to yank the ADA/USDT pair below the support line. If they succeed, the downtrend may extend to $0.20.
The bulls will have to catapult the price above the downtrend line to suggest that the downtrend may be ending. The pair may then ascend to the breakdown level of $0.50.
Bitcoin Cash price prediction
Bitcoin Cash (BCH) fell toward its pattern target of $456 on Saturday, where the buyers stepped in.
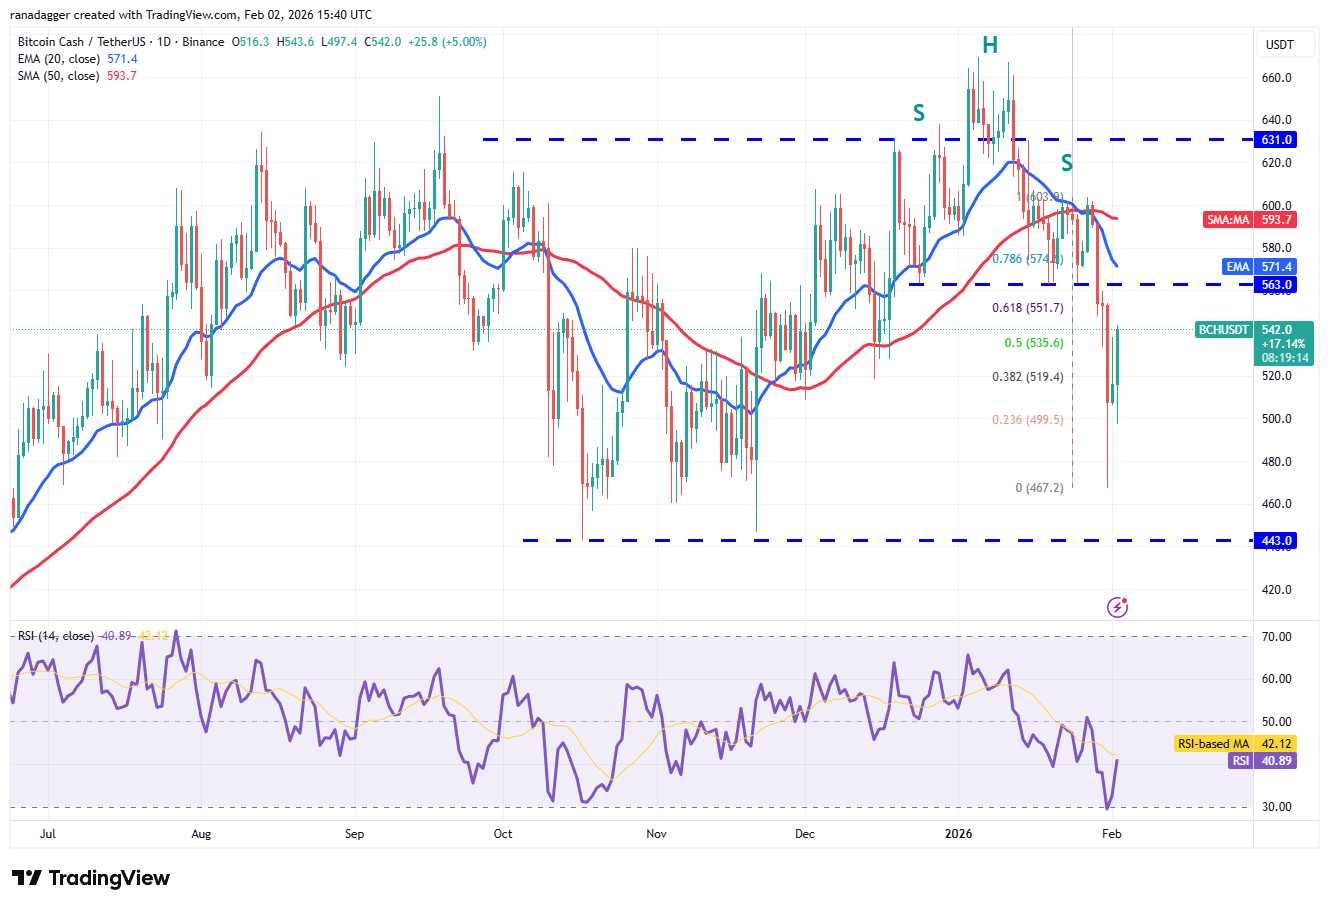
The bulls have started a relief rally, which is expected to face resistance in the zone between the 50% Fibonacci retracement level of $535 and the 61.8% retracement level of $551. If the Bitcoin Cash price turns down from the resistance zone, the bears will attempt to pull the BCH/USDT pair below $500.
On the contrary, if buyers propel the price above $551, the pair may reach the 20-day EMA ($571). A close above the 20-day EMA signals that the bulls are back in the game.
This article does not contain investment advice or recommendations. Every investment and trading move involves risk, and readers should conduct their own research when making a decision. While we strive to provide accurate and timely information, Cointelegraph does not guarantee the accuracy, completeness, or reliability of any information in this article. This article may contain forward-looking statements that are subject to risks and uncertainties. Cointelegraph will not be liable for any loss or damage arising from your reliance on this information.
