


Bitcoin (BTC) saw modest volatility around Tuesday’s Wall Street open as BTC price analysis saw a market bottom by the end of the month.
Key points:
-
Bitcoin should be safe from new local lows for the current US session, but the week is still tipped to be volatile.
-
Analysis says BTC price action is in a “period of anticipation.”
-
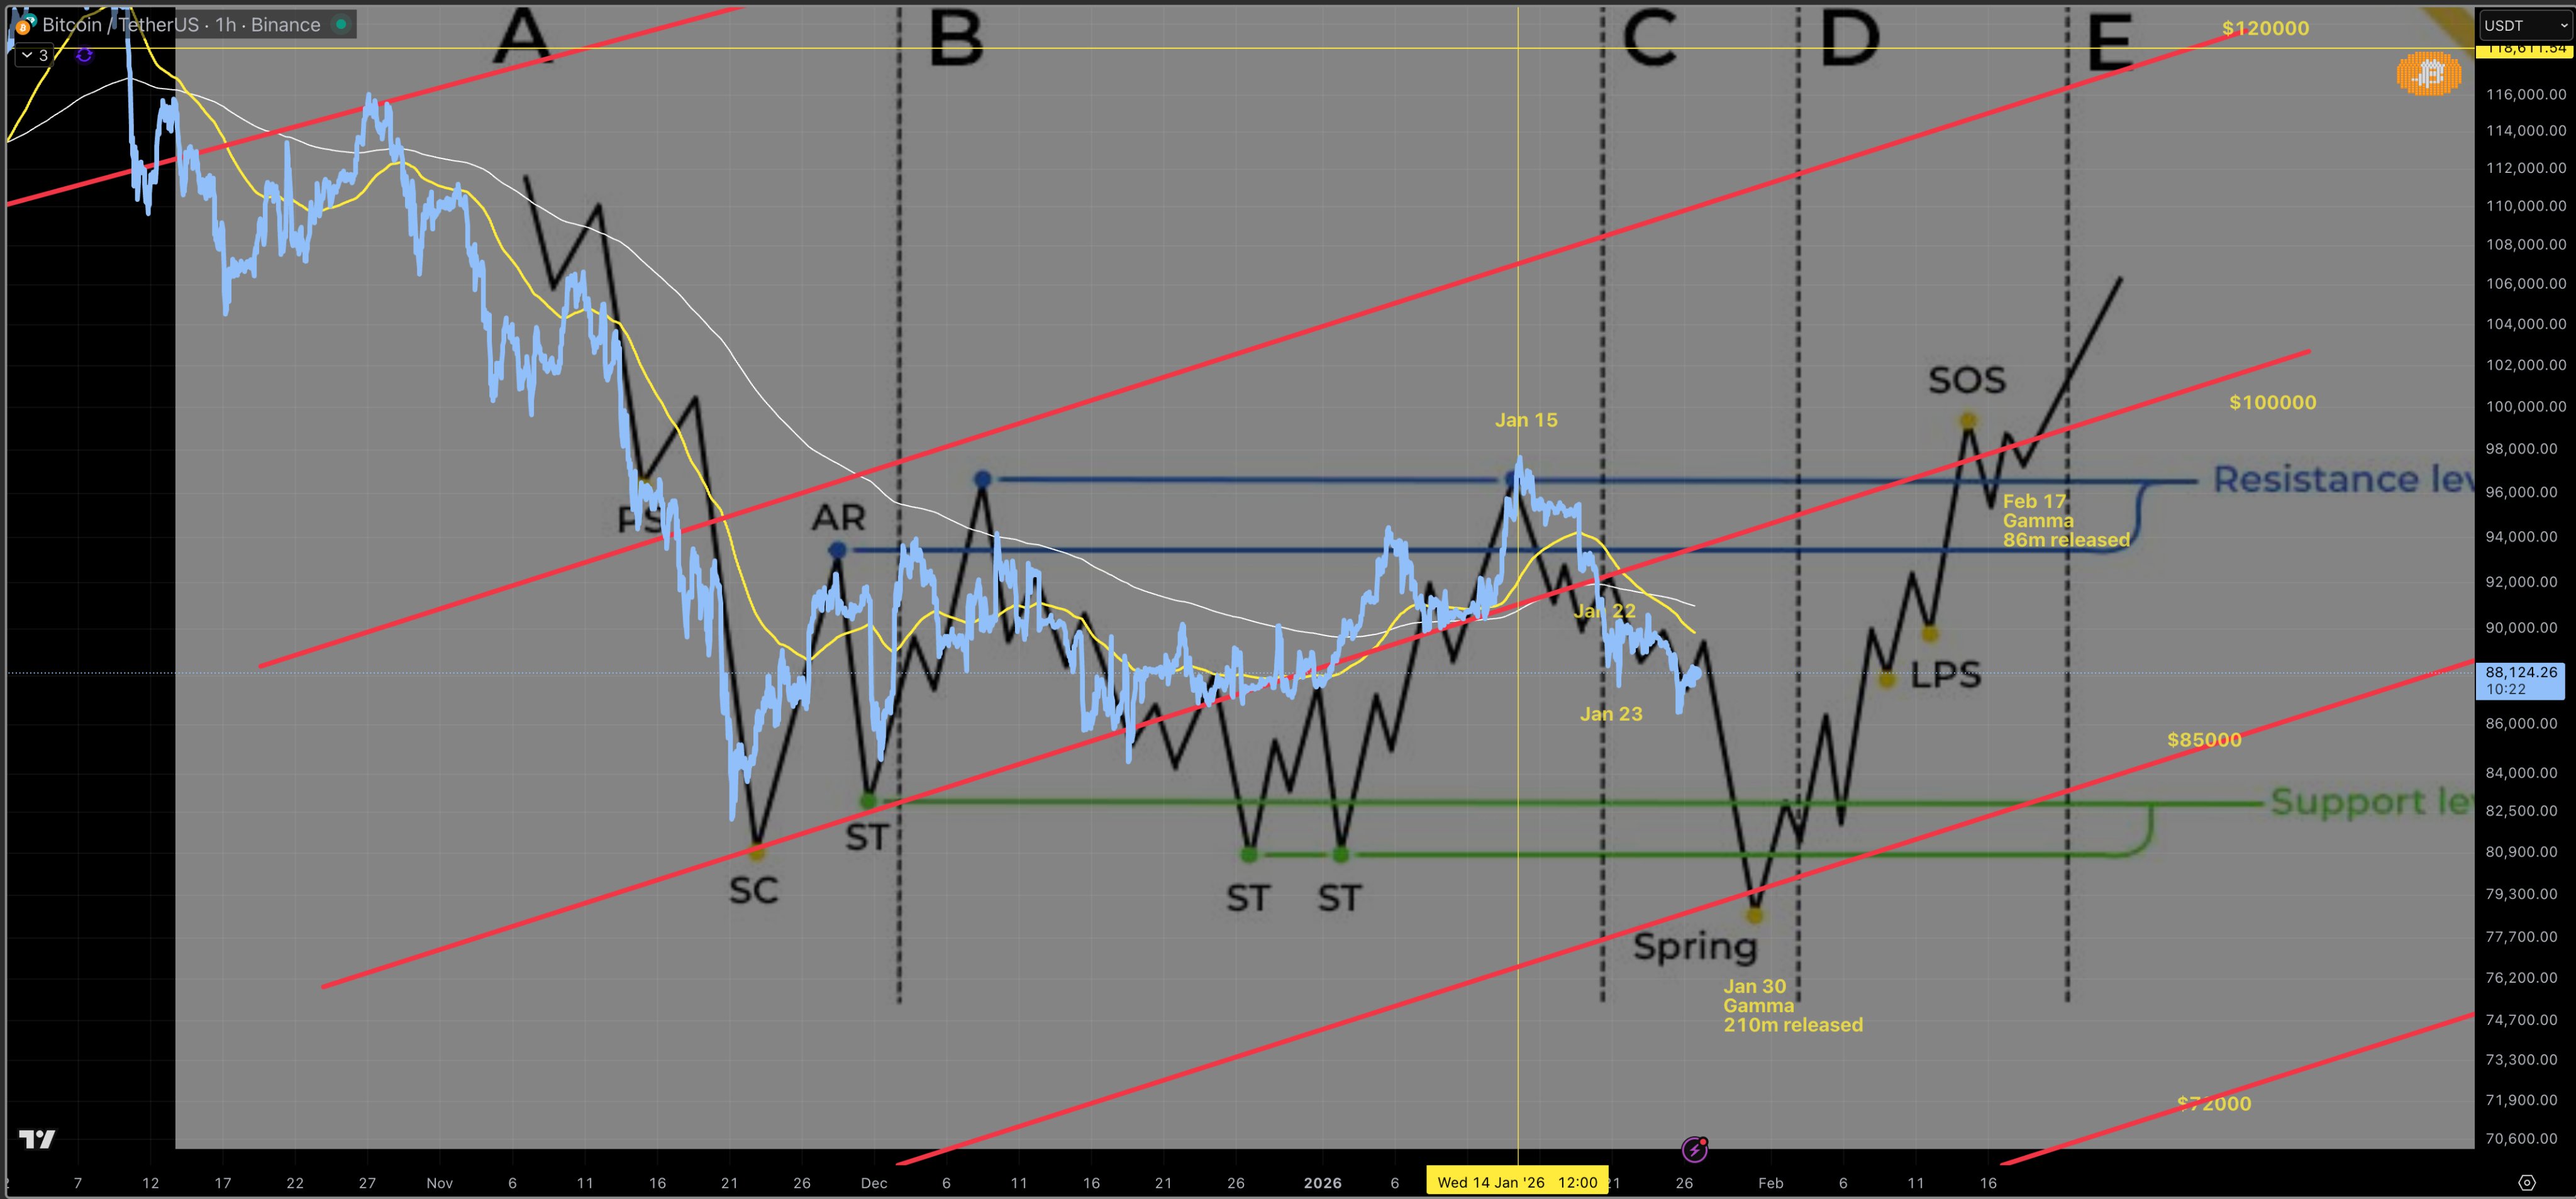
A market take using the Wyckoff method calls for a sub-$80,000 swing low on Bitcoin before February.
“High probability” BTC will hold $87,000 Tuesday
Data from TradingView showed a trip to $88,315 for BTC/USD before it retraced the move to head lower.
Still rangebound, Bitcoin offered little inspiration to market participants.
Keith Alan, cofounder of trading resource Material Indicators, offered some hope in the form of a buy signal from one of the latter’s proprietary trading tools.
“A new Trend Precognition signal on the $BTC Daily chart does not necessarily mean Bitcoin will test resistance today,” he wrote in an X post on the topic.
“While that is indeed a possibility, the new signal indicates there is a high probability that price will not revisit yesterday’s low today.”
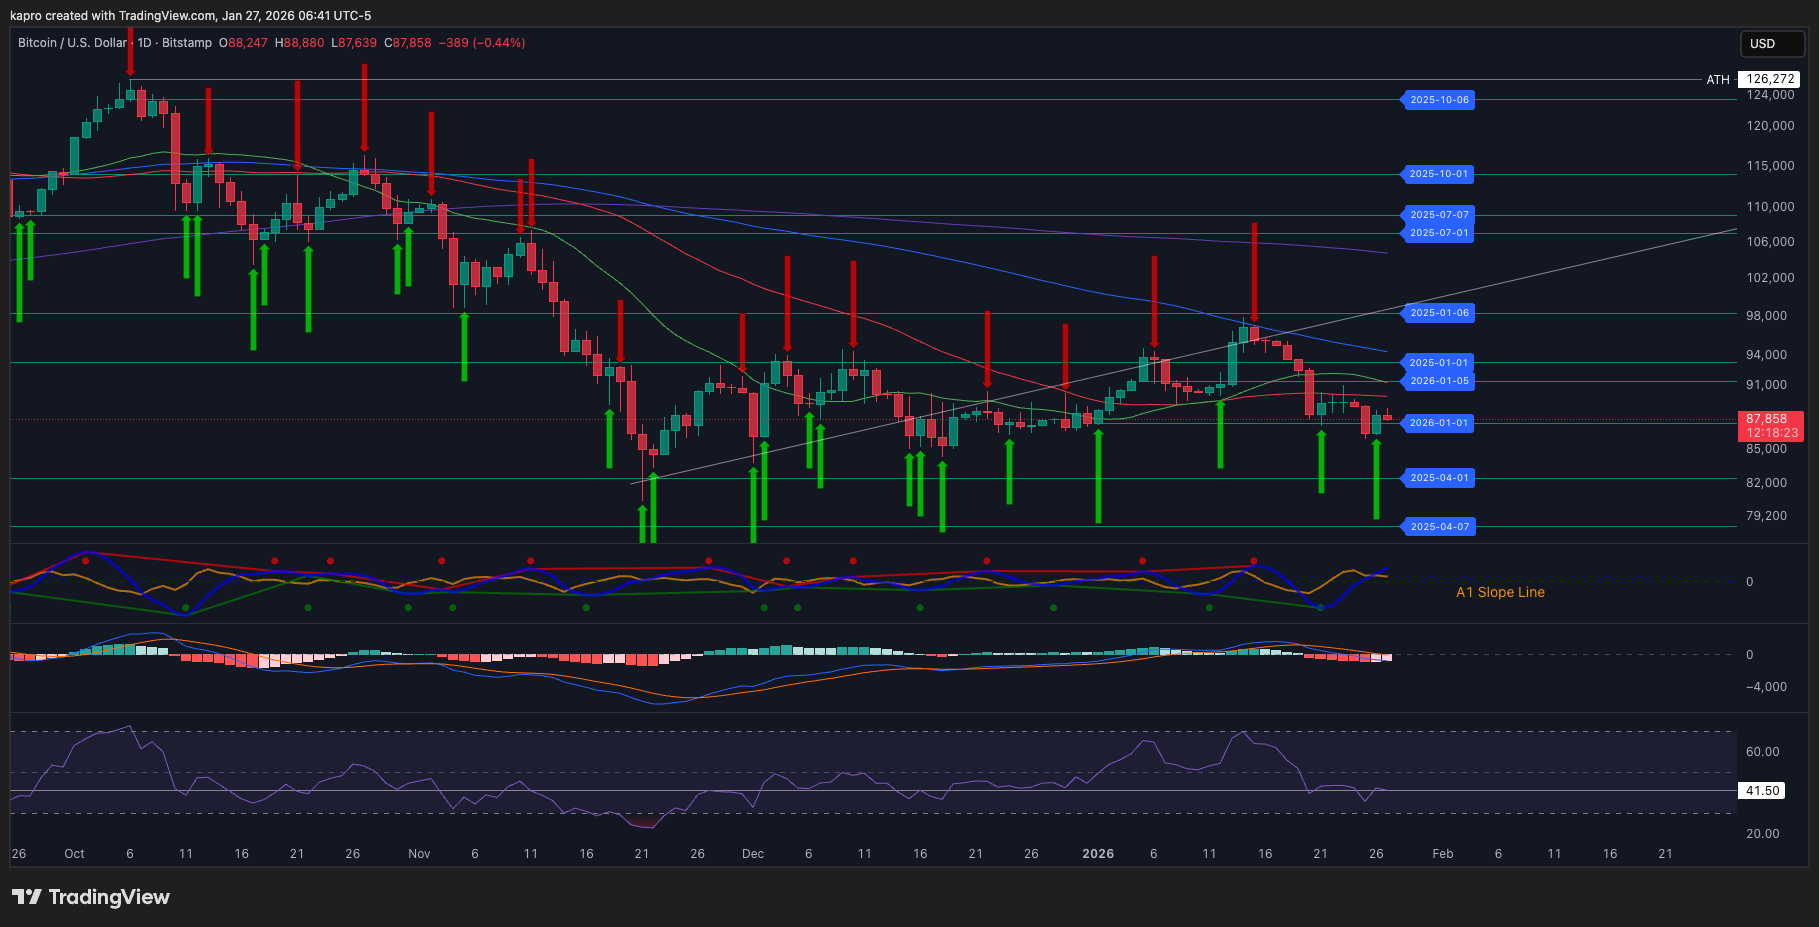
Alan referred to Monday’s brief dip below $87,000 and said that the current daily candle now needed to close above the 2026 open level near $87,500.
“A wick below is a sign of weakness, and an indication that a breakdown is likely coming,” he added.
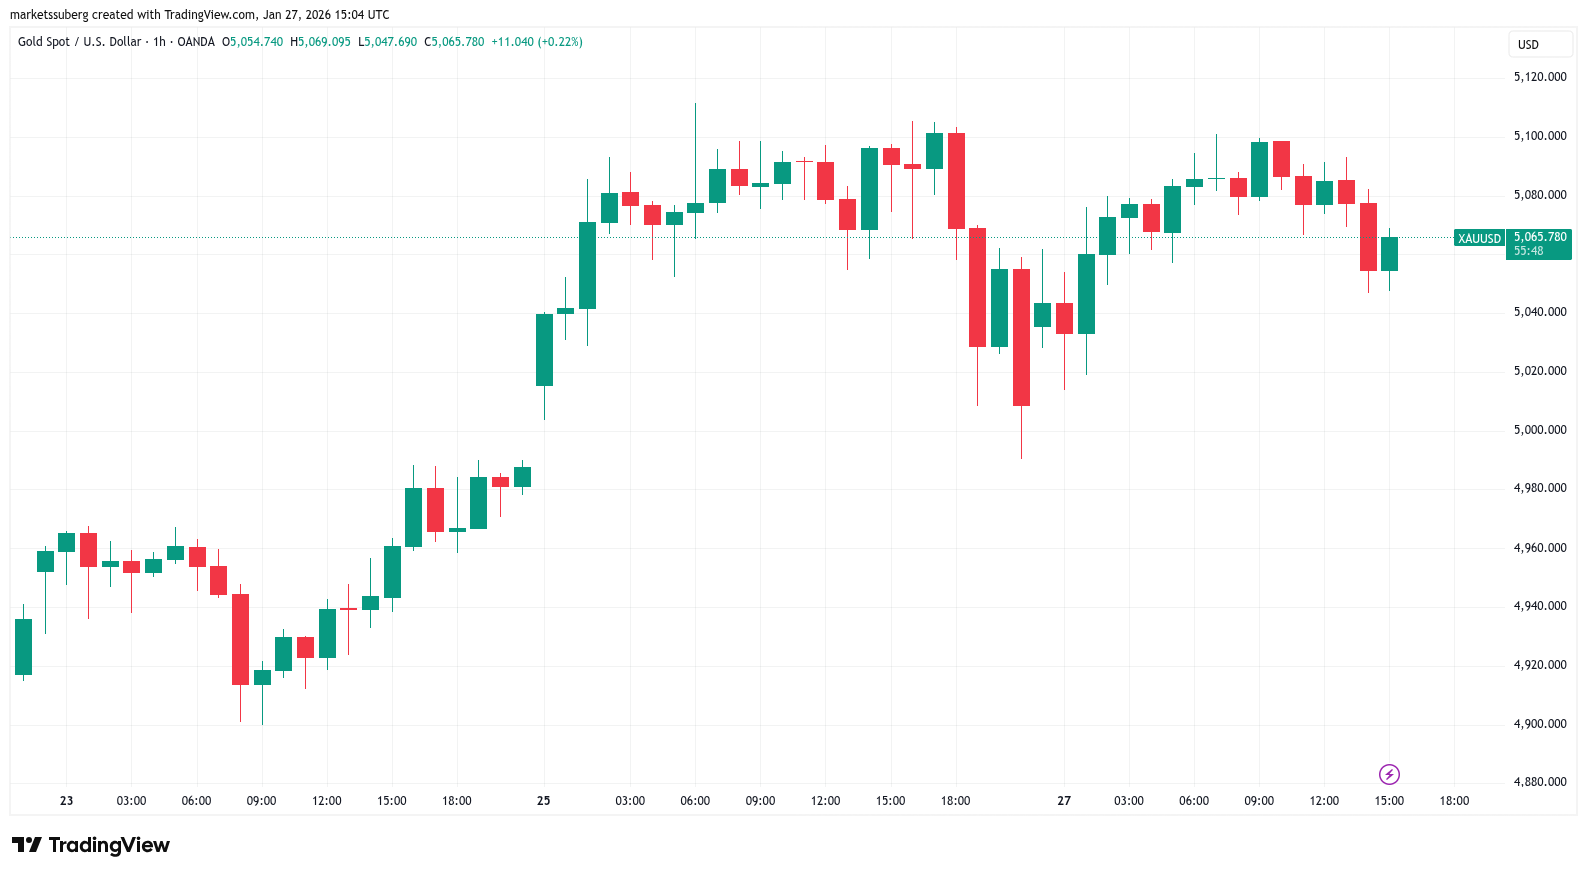
While the S&P 500 and Nasdaq Composite Index both opened slightly higher on the day, gold began to show signs that it would retest $5,000 as support.
As volatility cooled across macro assets, Bitcoin price momentum analysis from onchain analytics platform CryptoQuant was cautiously optimistic.
“Data from Binance shows that daily price momentum is positive at approximately $1,676, with a momentum of 1.93%, indicating a moderately higher closing price compared to the opening price,” contributor Arab Chain wrote in a “Quicktake” blog post.
“This reading reflects a clear attempt by the market to regain balance after a previous wave of selling pressure; however, it does not yet constitute strong bullish momentum. Instead, it suggests a quiet corrective move.”
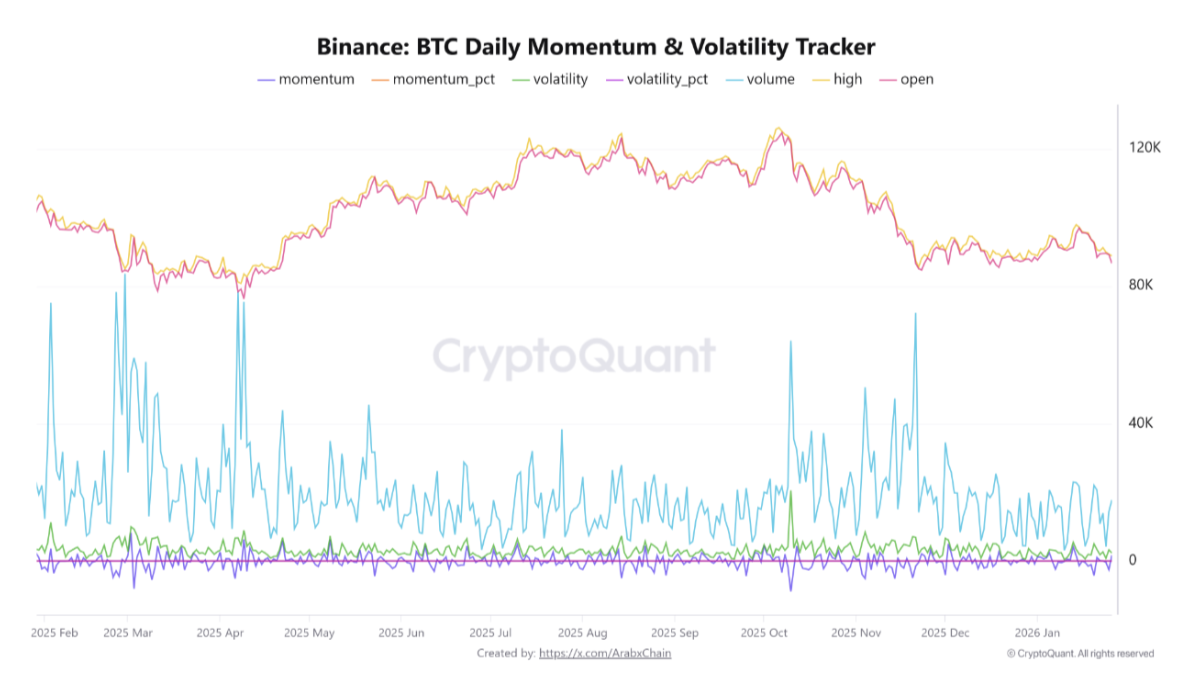
Arab Chain added that Binance order-book data showed Bitcoin being in a “period of anticipation rather than an immediate breakout or distribution phase.”
Bitcoin Wyckoff analysis sees “spring” event next
As Cointelegraph reported, markets anticipated fresh turbulence in the second half of the week.
Related: Bitcoin trend line cross mimics 2022 amid ‘insane’ BTC vs. silver breakdown
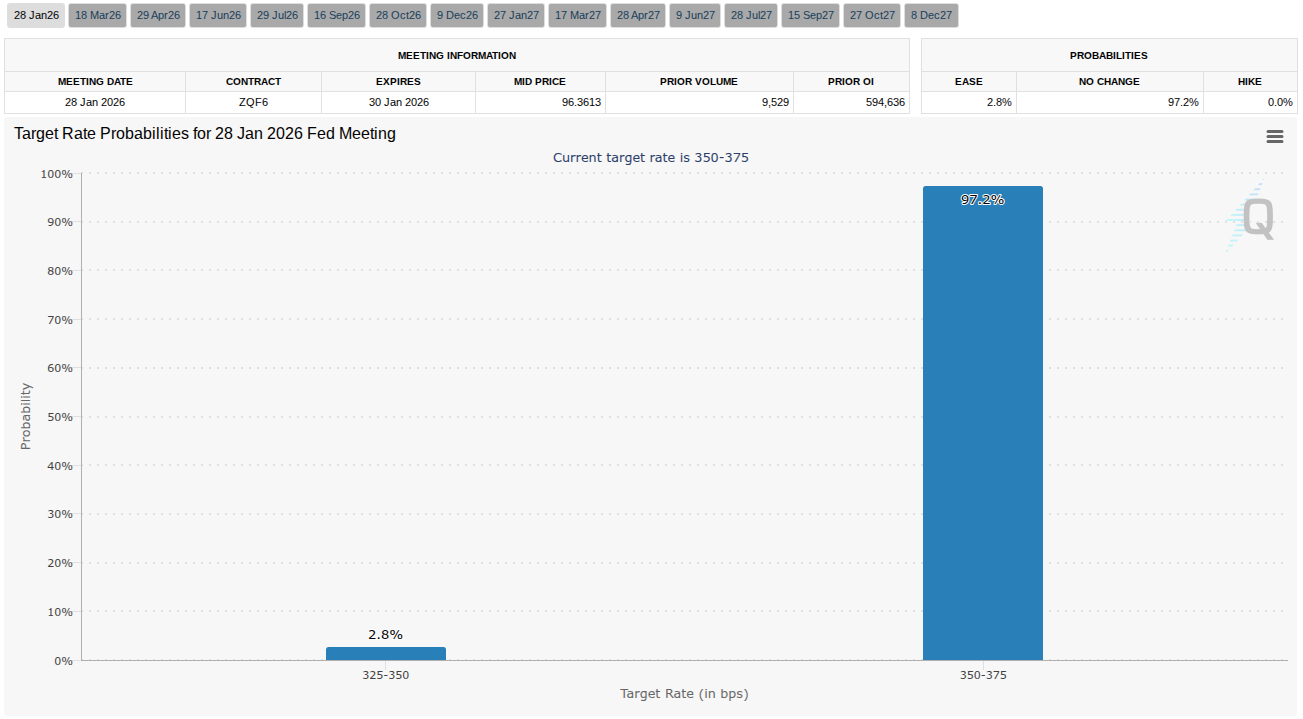
Wednesday was due to see the US Federal Reserve decision on interest rates, along with guidance by Chair Jerome Powell, under heavy pressure to cut them from the government.
Despite that, expectations of a rate cut remained below 3% Tuesday, per data from CME Group’s FedWatch Tool.
In his latest forecast, commentator MartyParty added further importance to the Fed event and others this week.
Using Wyckoff analysis, MartyParty saw a key long-term swing low, known as the “spring,” occurring on BTC/USDT around the same time. An accompanying chart warned that this could take the pair below $80,000.
“This coincides with the Wyckoff Spring Event. Expect Volatility,” he told X followers.
This article does not contain investment advice or recommendations. Every investment and trading move involves risk, and readers should conduct their own research when making a decision. While we strive to provide accurate and timely information, Cointelegraph does not guarantee the accuracy, completeness, or reliability of any information in this article. This article may contain forward-looking statements that are subject to risks and uncertainties. Cointelegraph will not be liable for any loss or damage arising from your reliance on this information.
