


Bitcoin (BTC) heads into year-end 2025 stuck at $90,000 as stocks and precious metals roar higher.
-
Bitcoin sees only a modest uptick after its last weekly close of the year, as liquidity analysis warns of a fresh dip.
-
Traders’ cost bases form the backbone of support reclaim targets heading into 2026.
-
Risk assets, except crypto, are in party mode despite low expectations of another Federal Reserve interest-rate cut in January.
-
Bitfinex whales are an island of hope in a defeated crypto landscape, with longs at their highest levels in nearly two years.
-
Compared to Bitcoin history, this year’s bull market drawdown is still firmly “for ants.”
Bitcoin starts the week with $90,000 fakeout
Bitcoin price volatility returned with a vengeance into the weekly close, with a spike above $90,000 coming soon after.
This, in line with previous attempts, failed to flip that key level back to definitive support, data from TradingView shows.
With the all-important yearly candle close around the corner, however, traders are far from relaxed when it comes to what could happen next.
For trader CrypNuevo, last Friday’s $24 billion options expiry meant that the door was now open to higher volatility as standard.
“Record levels of options expired on Friday, so I’m expecting a lot of volatility for the next few weeks,” he wrote in a thread on X.
“Those options kept price stuck in a range – price will be more volatile now.”
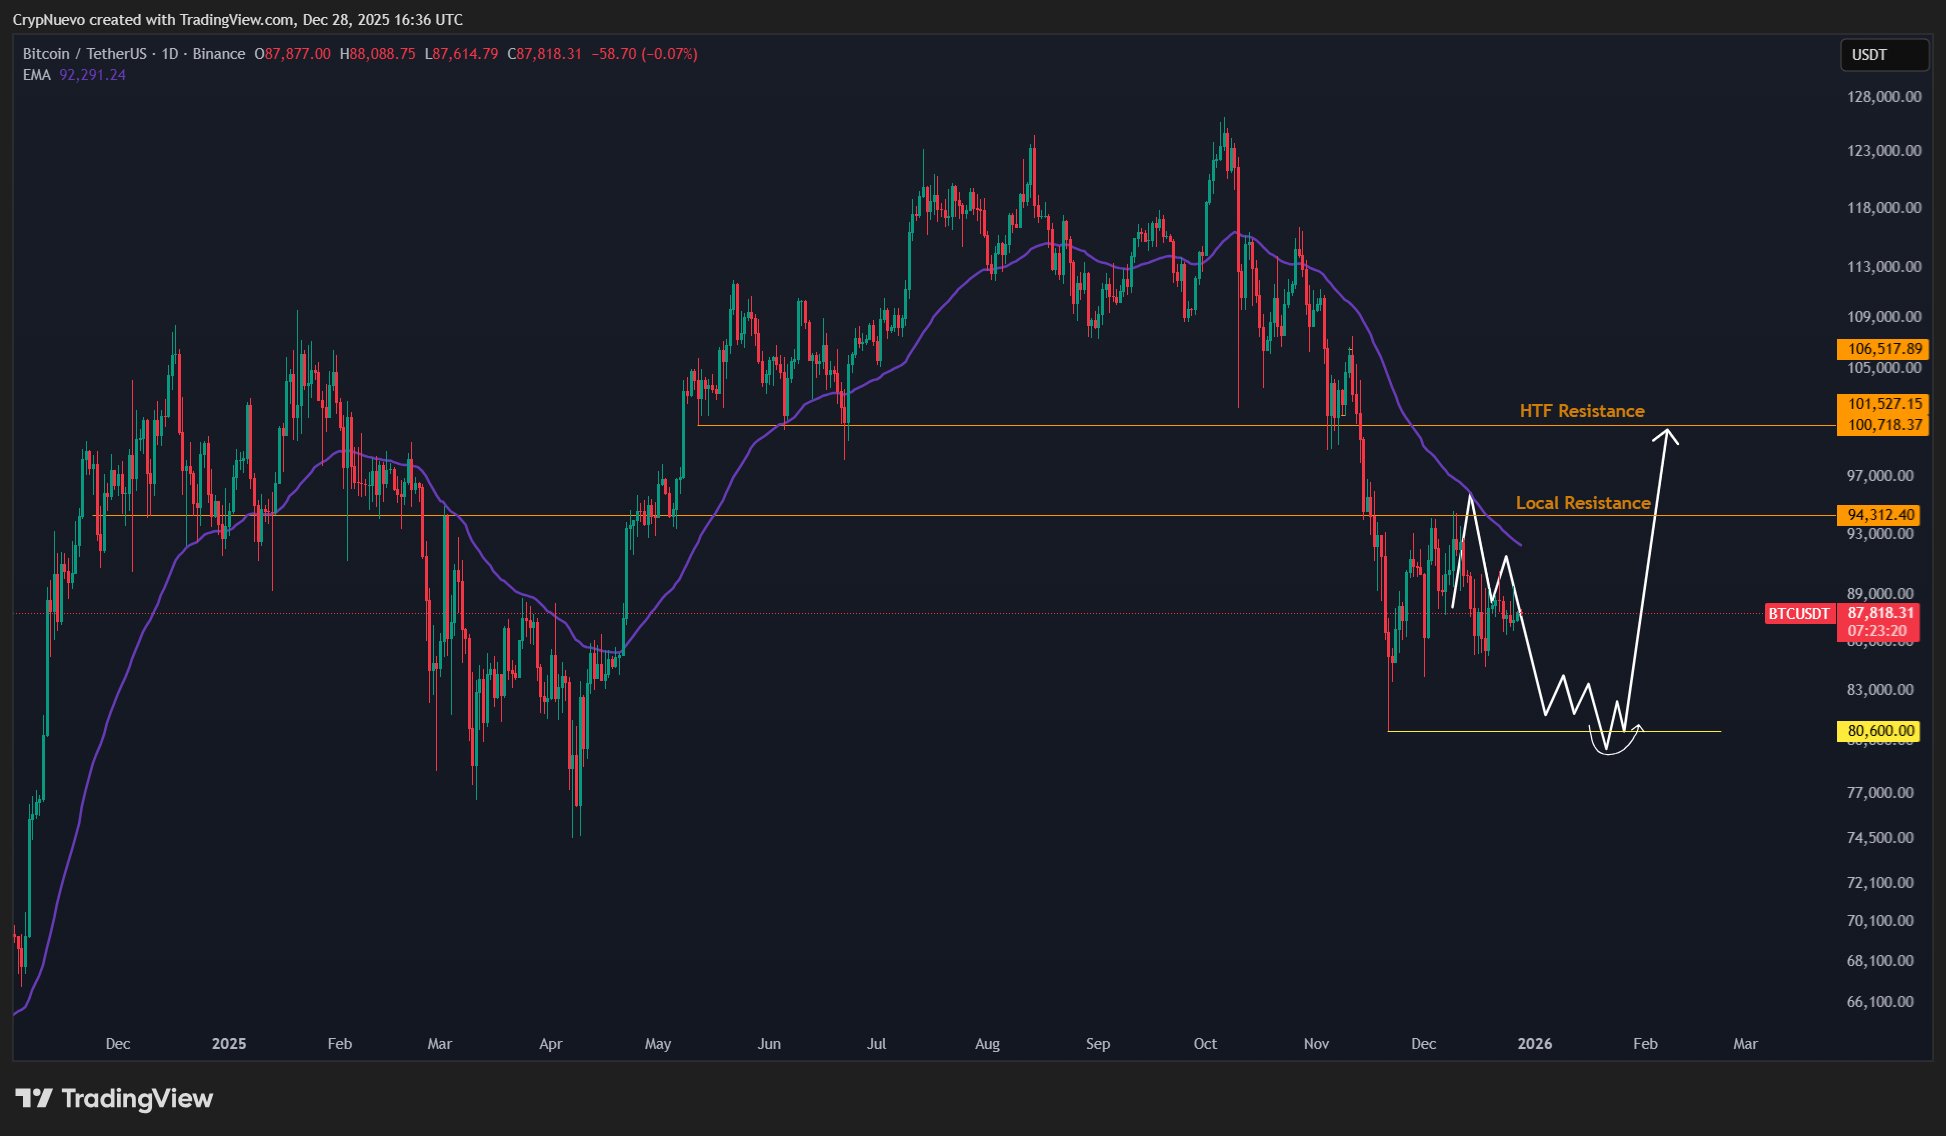
An accompanying chart put $94,300 and $100,000 as important resistance points to watch next.
To the downside, CrypNuevo tapped exchange order-book liquidity for signals, warning that the mid-$80,000 range could come back into play.
“In terms of liquidations, in HTF there are more to the upside at $96k. But in LTF, there are more liquidations to the downside around $85k,” he wrote about high and low-timeframes liquidation clusters.
“So in terms of efficiency, it’s more efficient to drop price to low $80’s first, before bouncing back and targetting the upside liquidity.”
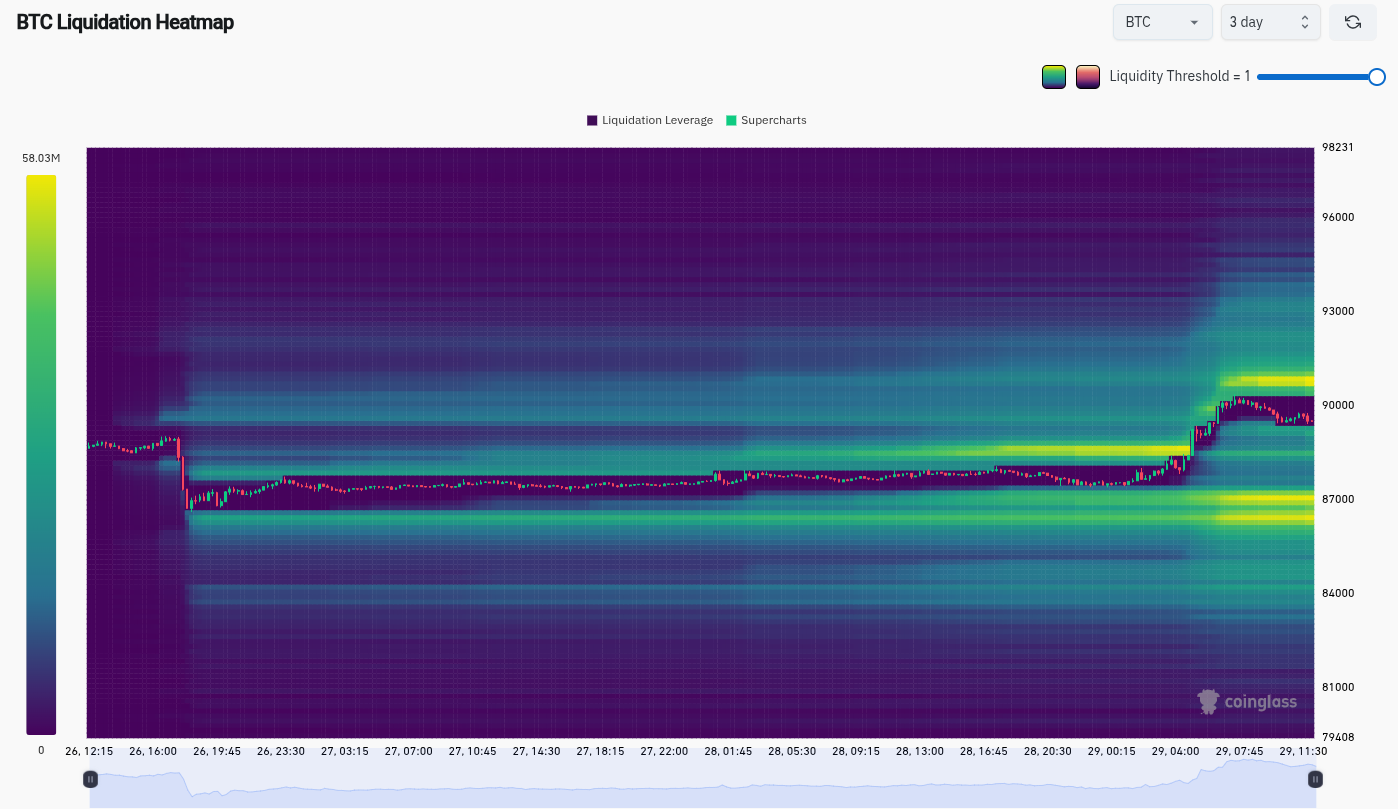
Data from monitoring resource CoinGlass showed liquidity thickening around the spot price over the past three days in anticipation of the last TradFi trading days of the year.
Closer to home, crypto trader, analyst and entrepreneur Michaël van de Poppe eyed the 20-day simple moving average (SMA) as a target.
“Nothing confirmed, as it has been breaking above this 20-Day MA during the previous correction,” he wrote on the day.
“The important part is whether it will sustain above this 20-Day MA after US Open later today & holds above it in the coming days.”
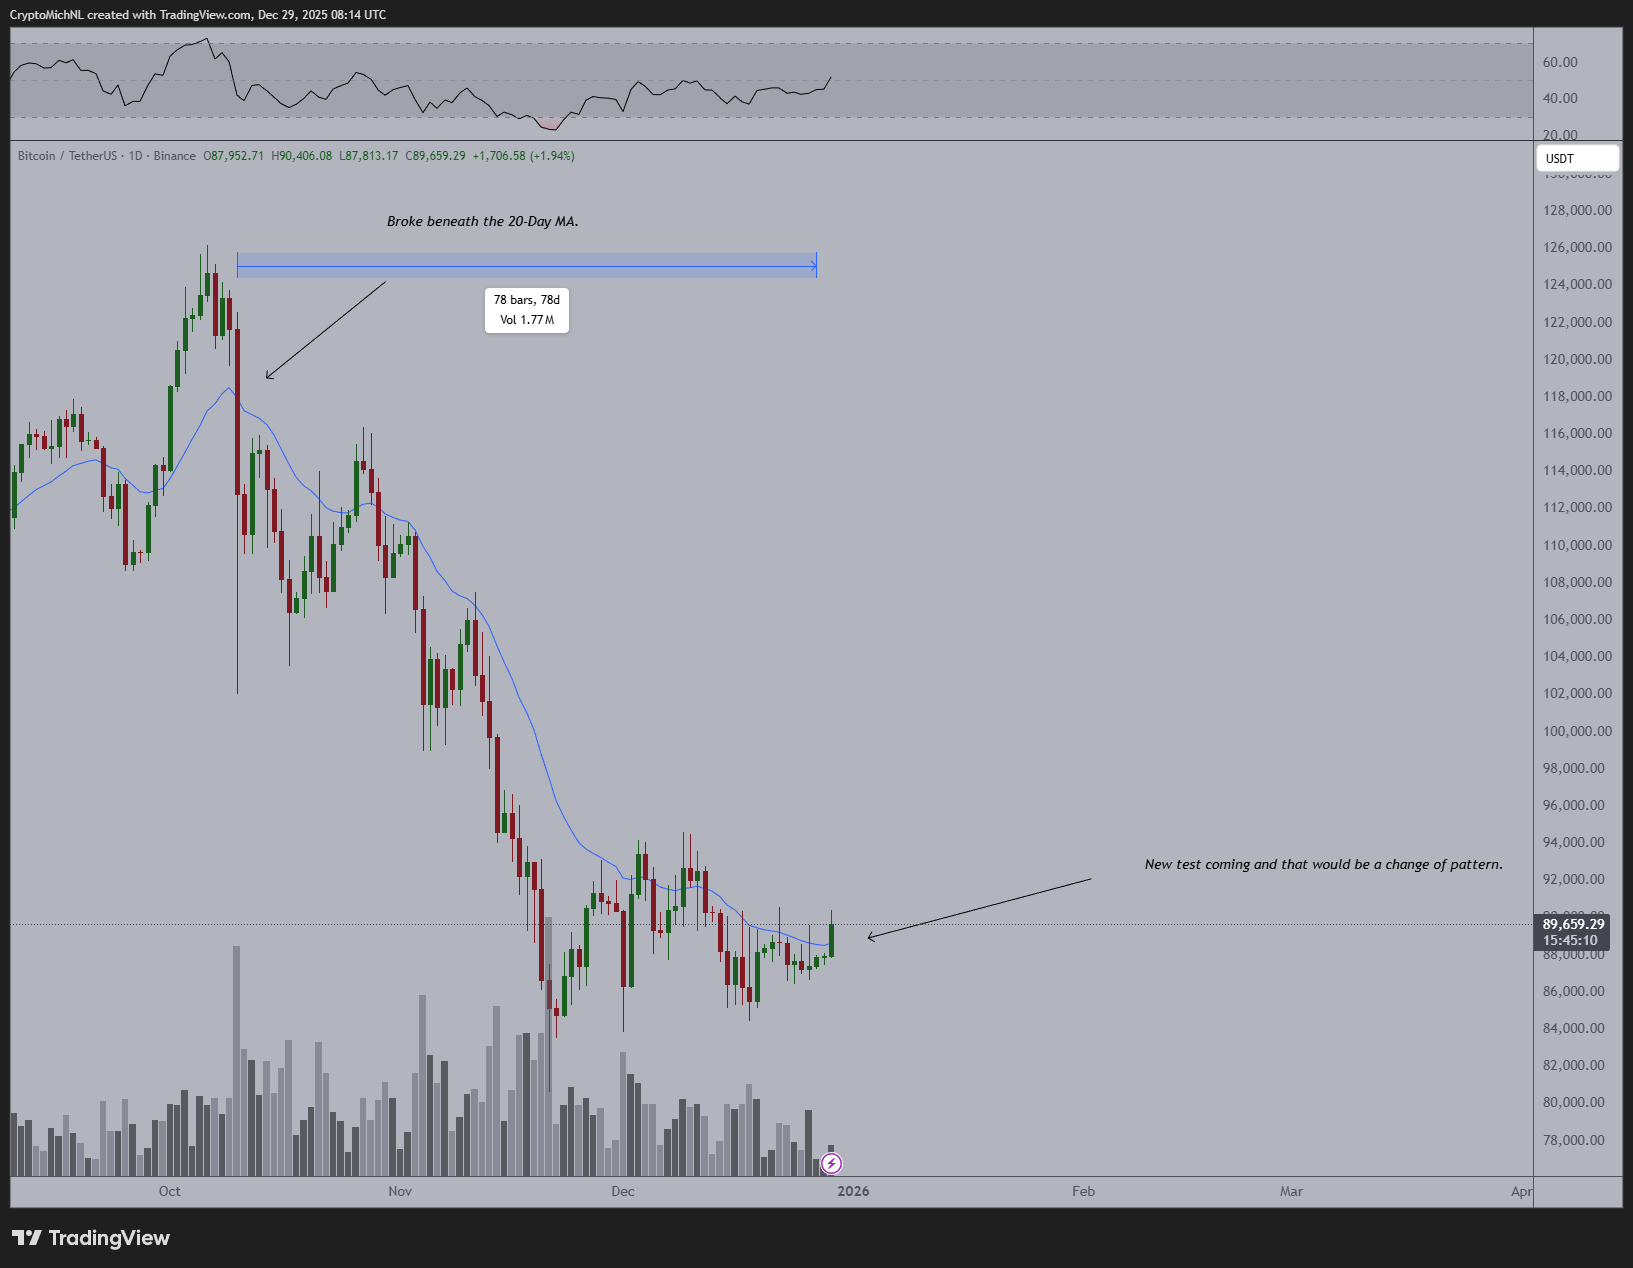
Van de Poppe said that breaking through and flipping the 20-day SMA, currently at $89,400, would mark a “change of scenery” for BTC price action.
Realized BTC price points the way higher
Going forward, key BTC price resistance levels to flip back to support coincide with hodlers’ cost bases.
Also known as “realized price,” cost bases reflect the aggregate buy-in price for various types of Bitcoin investors, from diamond hands to newcomers and speculators.
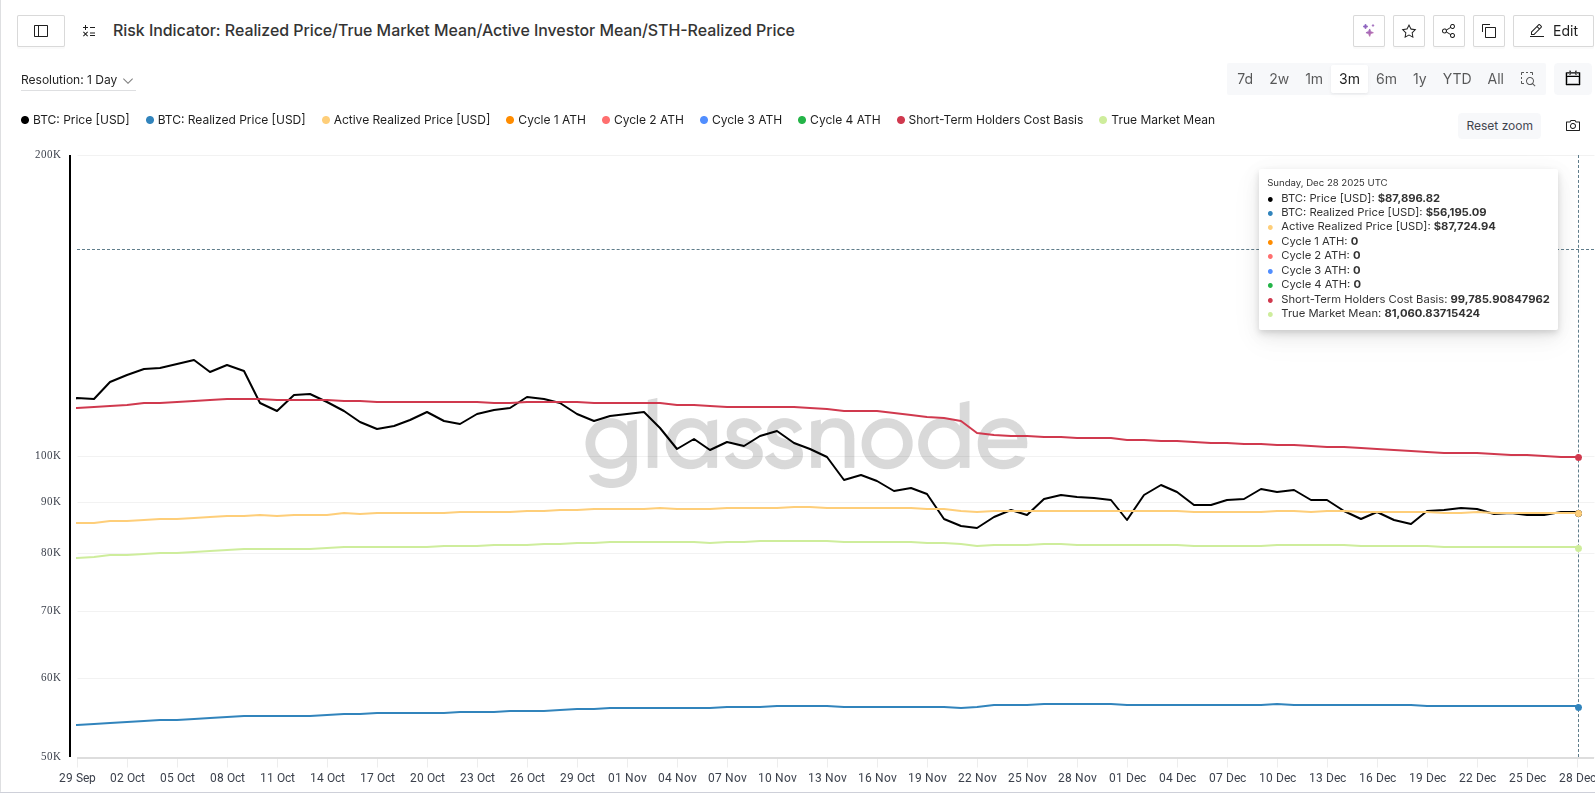
The latest data from onchain analytics platform Glassnode currently puts the realized price of short-term holders (STHs) at $99,785. These are entities holding a given amount of BTC for up to six months, typically influenced by sudden price volatility and more prone to selling at short notice.
As Cointelegraph reported, the STH cost basis tends to function as support during bull markets, and reclaiming it is essential during a bull-market correction.
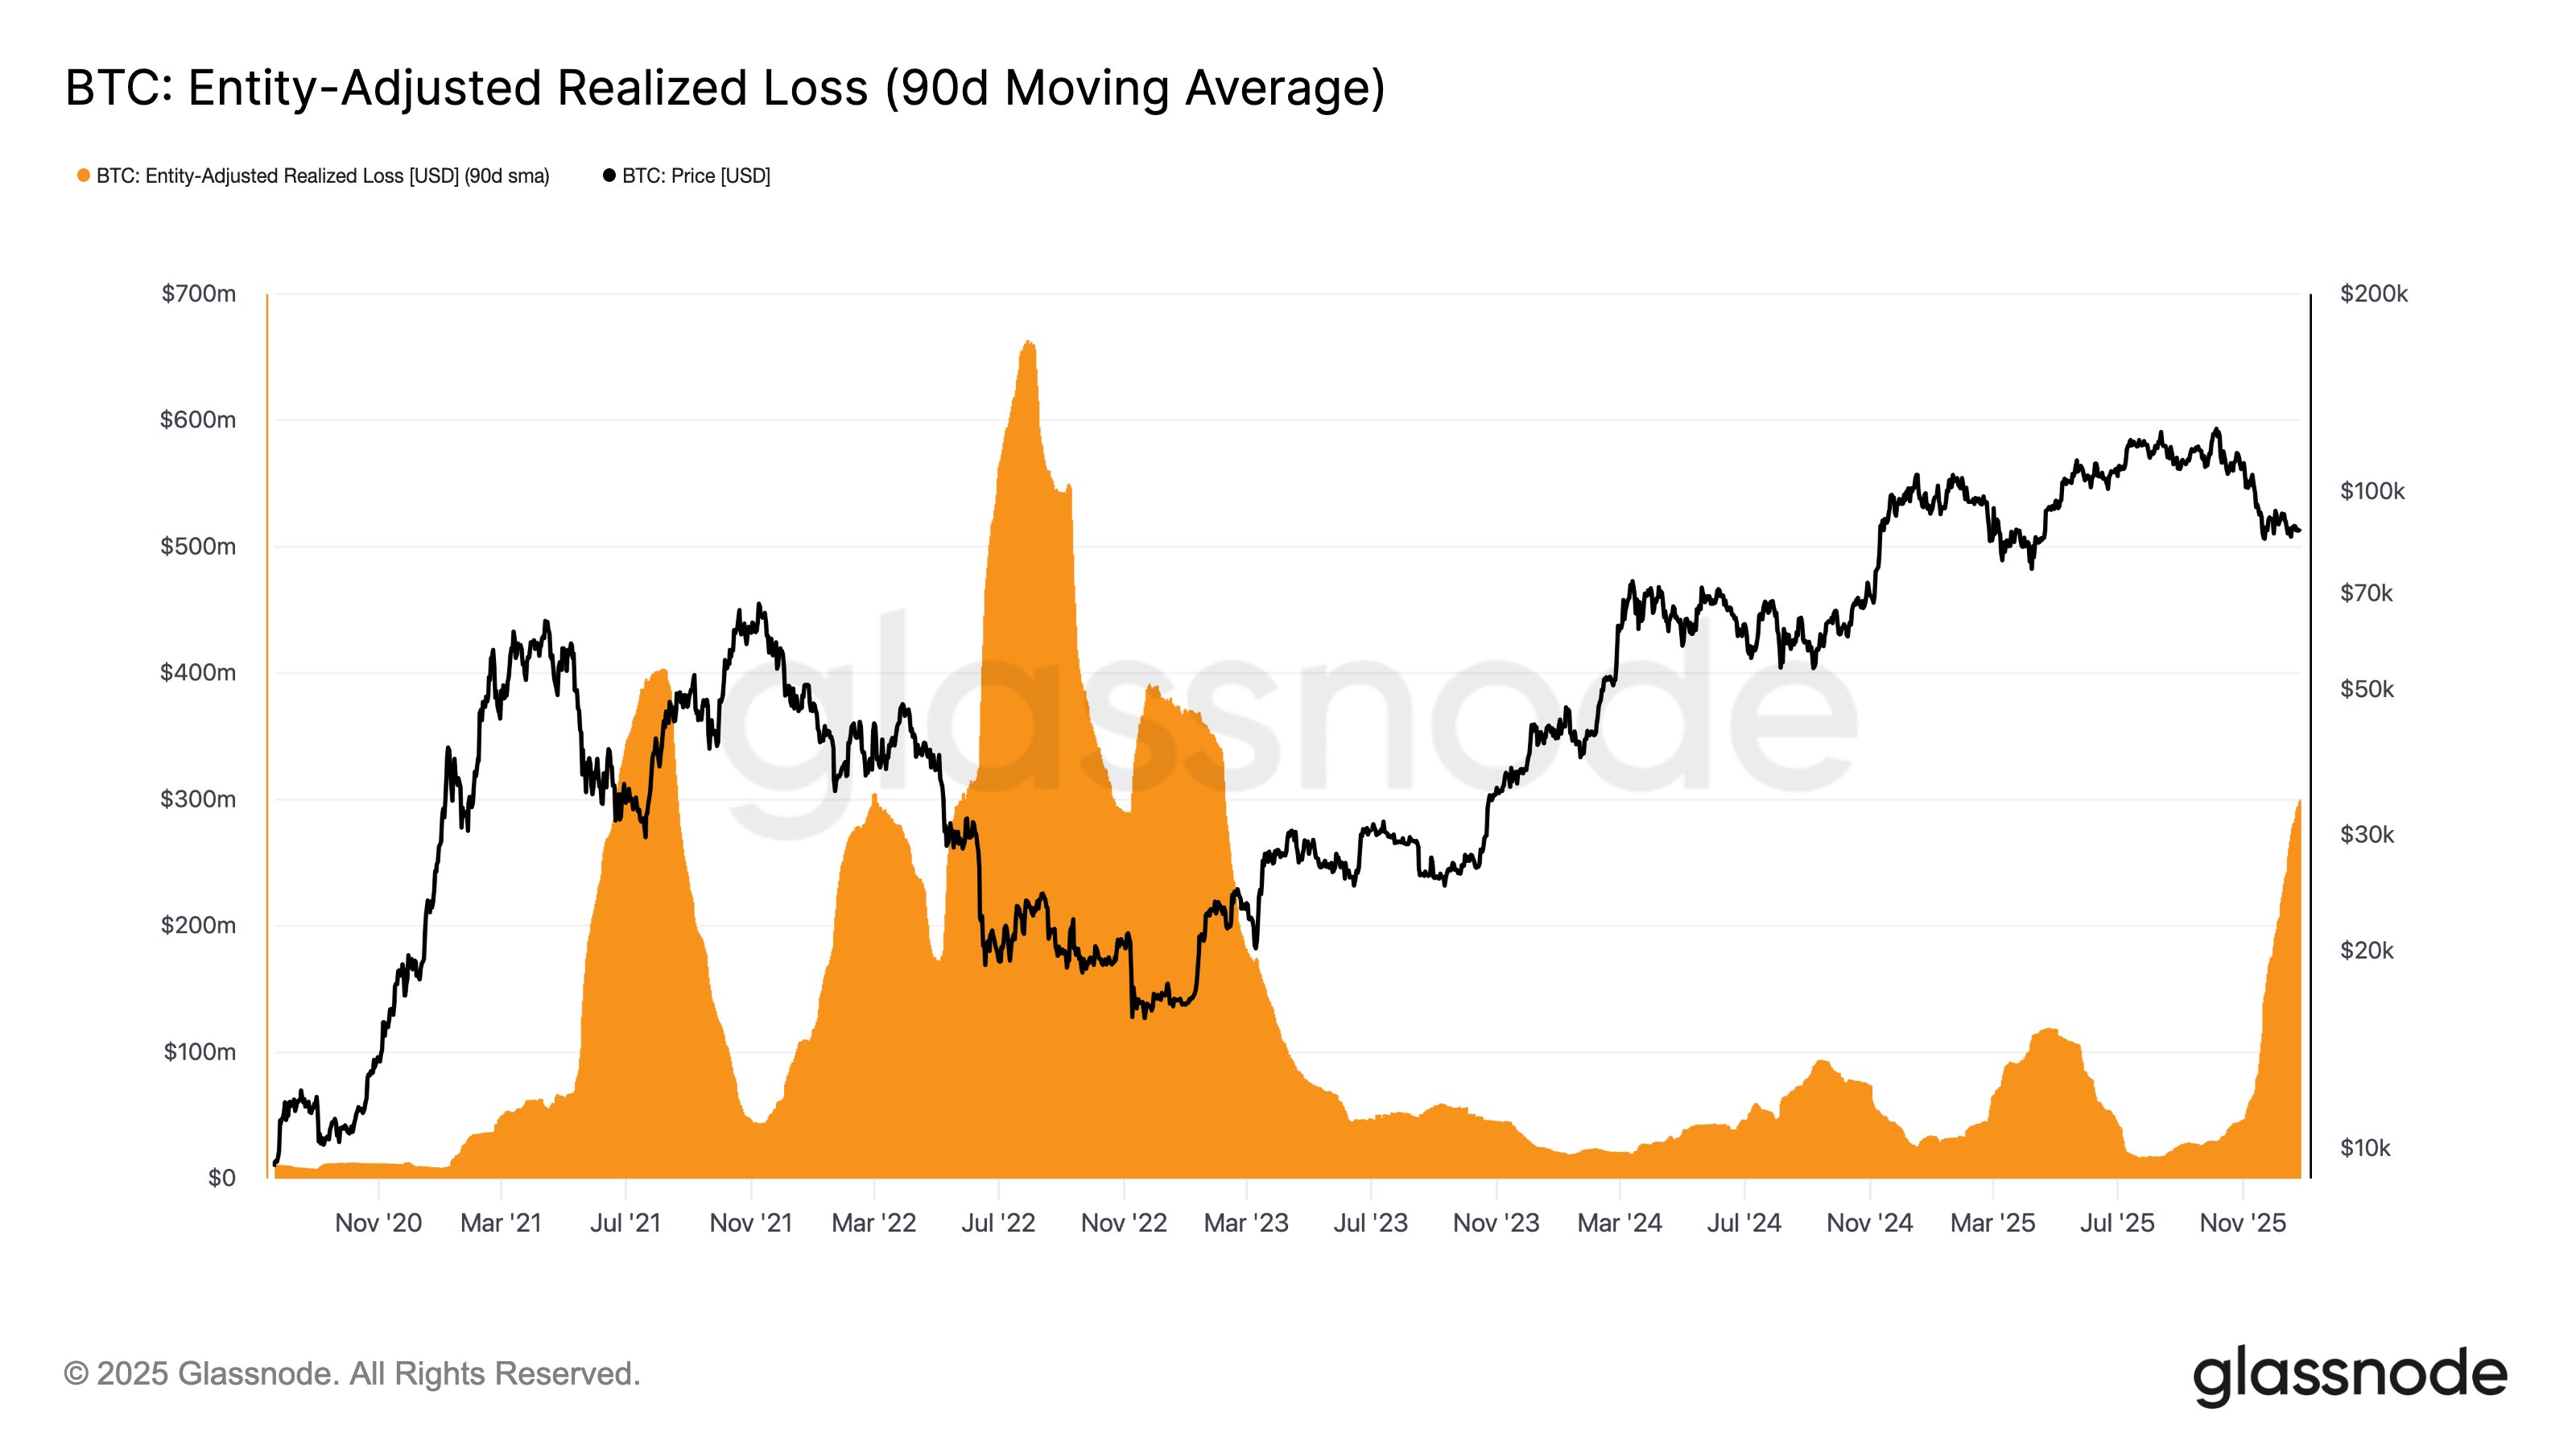
In some of its most recent findings, Glassnode showed STH entities still moving coins onchain at a loss, more than two months after Bitcoin’s latest all-time high.
“The realized loss volume, after filtering out in-house transactions and smoothing with a 90-day SMA, is now at $300M per day,” pseudonymous lead research analyst CryptoVizArt reported on X at the weekend.
“Despite the price stabilizing above the True Market Mean ($81K), selling at a loss, due to top buyers’ frustration with time, has not declined significantly.”
CryptoVizArt referred to another important price point, which measures the cost basis of the broader active investor base. During the current drawdown, the BTC price has failed to close below it.
Crypto remains the 2025 macro outsider
The new year period is a quiet one when it comes to US macroeconomic data prints, but markets have next year’s issues in mind.
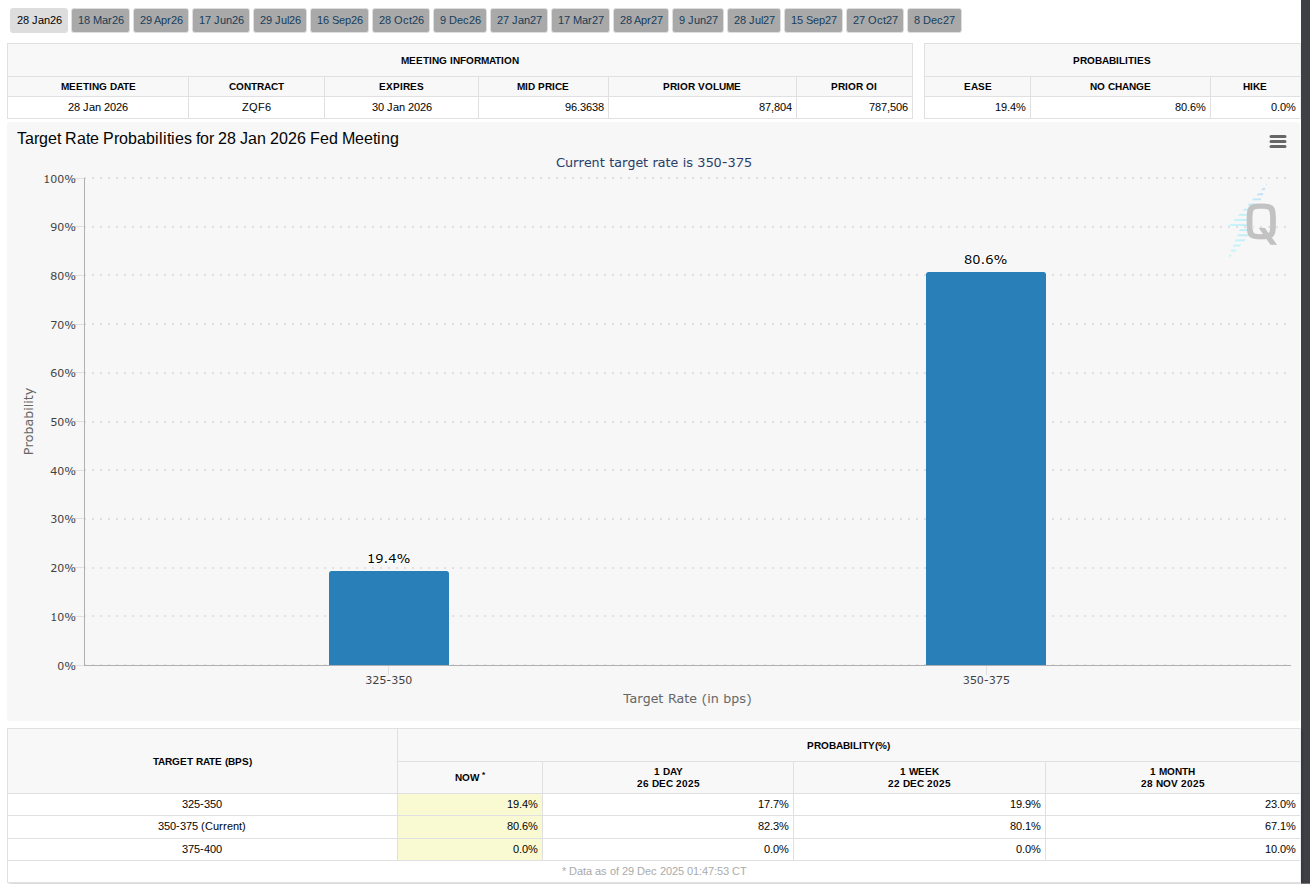
Tuesday’s release of the Federal Reserve’s December meeting minutes should help form an impression of future policy.
This is significant for risk-asset traders, as the current consensus sees a highly mixed bag of US financial conditions going forward.
Despite declining inflation and a worsening labor market, the Fed is not expected to continue lowering interest rates at its next meeting in late January, per data from CME Group’s FedWatch Tool.
Regardless of how stocks read the current environment, however, all-time highs are in place — as well as those for precious metals — while crypto fails to catch a bid.
Price discovery for gold and silver continued into the start of the week, with both assets seeing major volatility while Bitcoin managed only a nominal trip to $90,000.
“The Bitcoin-to-silver ratio is now down to 1,104, the lowest since September 2023,” trading resource The Kobeissi Letter commented on the topic.
“Since May, the ratio has dropped -67% as silver has significantly outperformed Bitcoin. At the same time, the Bitcoin-to-gold ratio is down to 19, the lowest since November 2023, and is down -50% since January.”
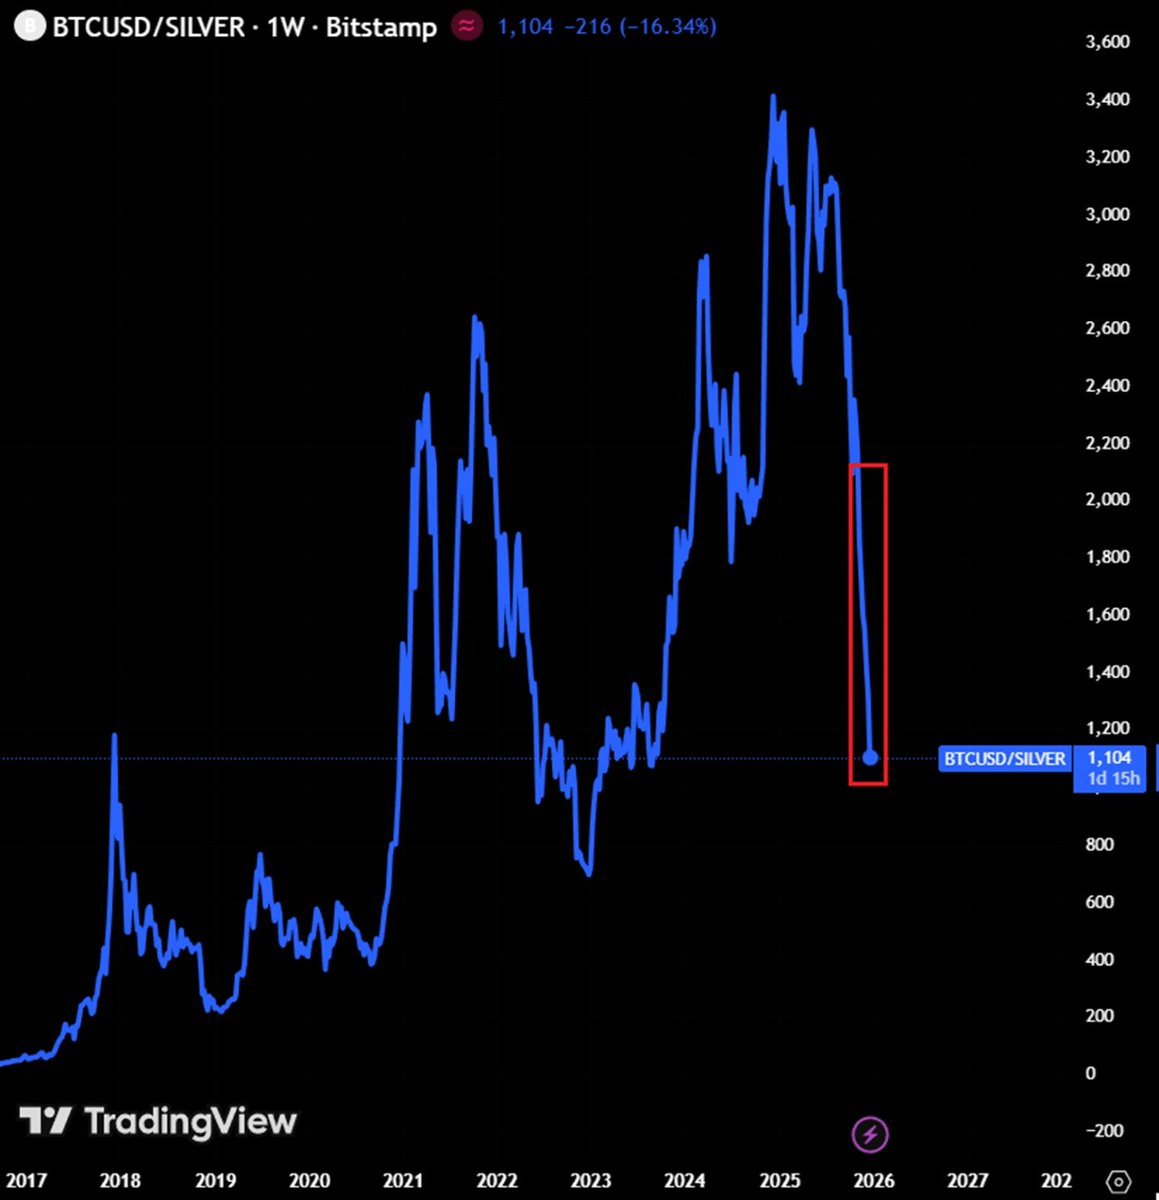
Kobeissi queried whether crypto could “catch up” next year.
“By comparison, the ratios stood at 680 and 9, respectively, at the 2022 bear market low,” it added.
Bitfinex whales double down on bull market
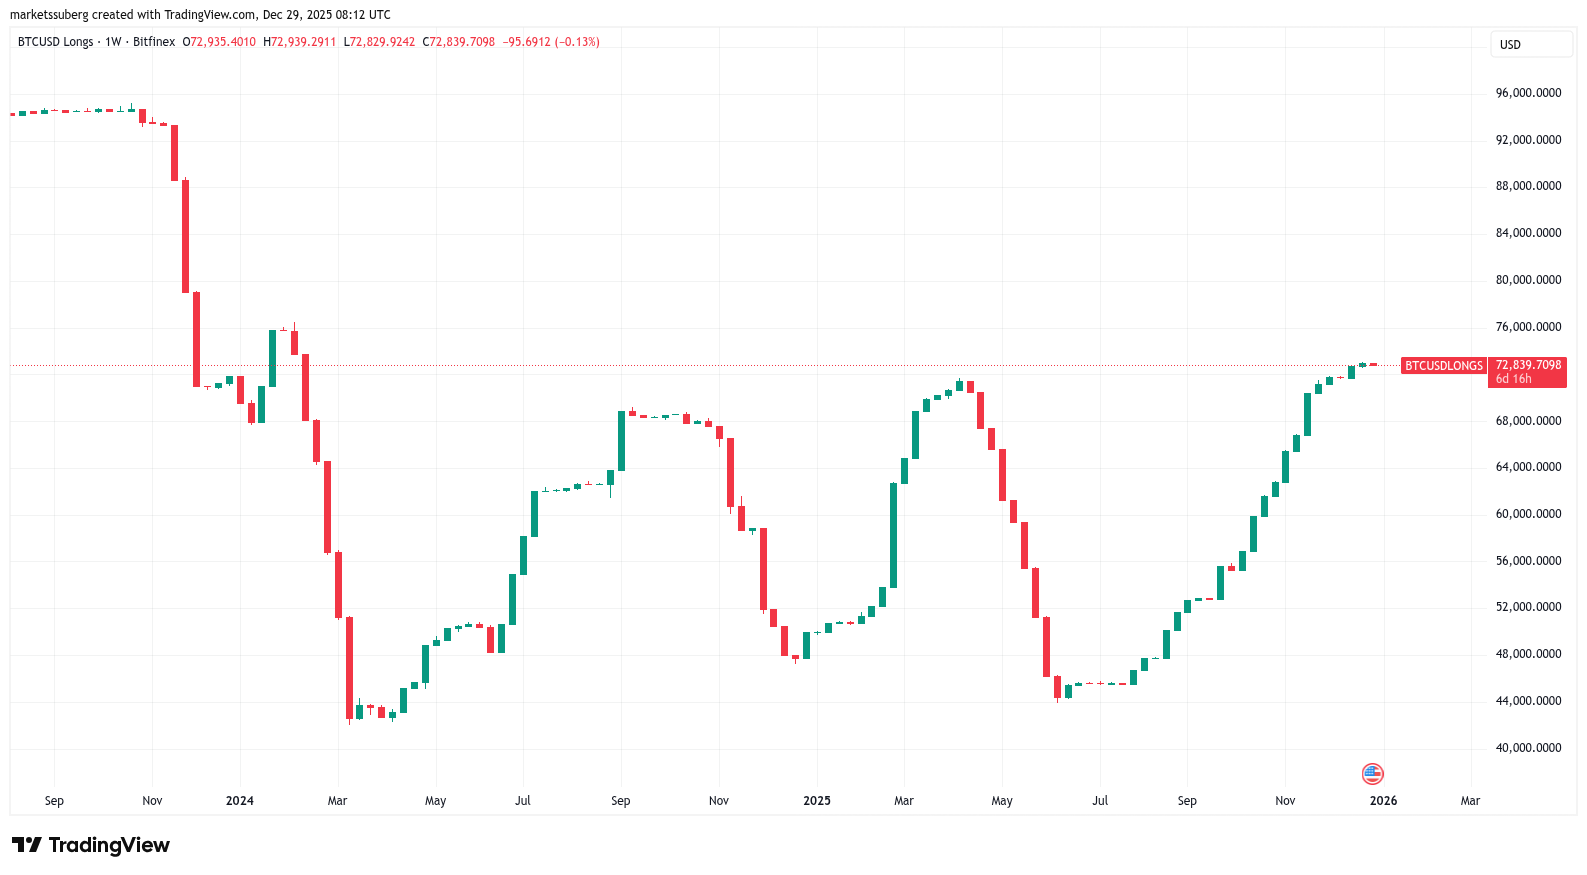
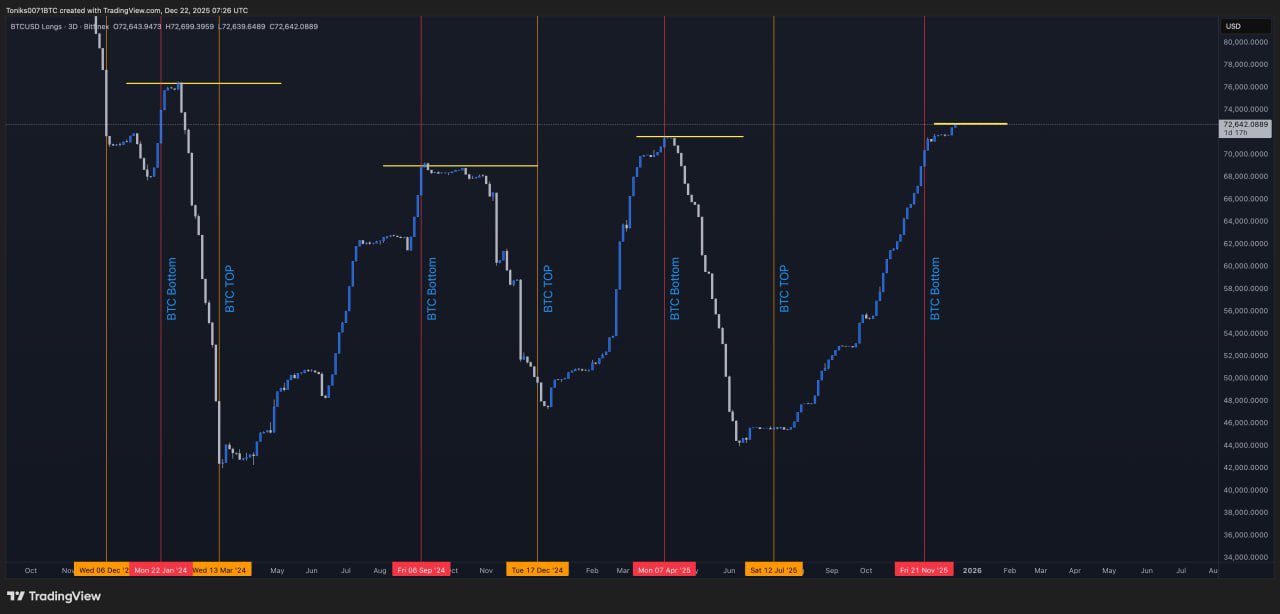
In a clear contrast to the broader market mood, large-volume traders on crypto exchange Bitfinex appear anything but bearish on the BTC price outlook.
As noted by trader BitBull, whales’ long BTC positions are at their highest levels since mid-February.
Long interest has even outstripped its local peak from early April, when BTC/USD hit lows under $75,000 before embarking on a 50% rebound over a six-week period.
“Despite people calling for 4-yr cycle repeat, Bitfinex whales think that there’s still a big pump left,” BitBull commented in X analysis on the data.
“What if Bitcoin hits a new ATH in 2026?”
Trading resource Galaxy Trading noted that Bitfinex whales tend to follow historical patterns, providing a form of trading signal for the broader investor base.
“OG Whales are accumulating longs. They are the best indicator for when to get out of the market. Once they start closing out hard it’s time to get out,” it told X followers last week.
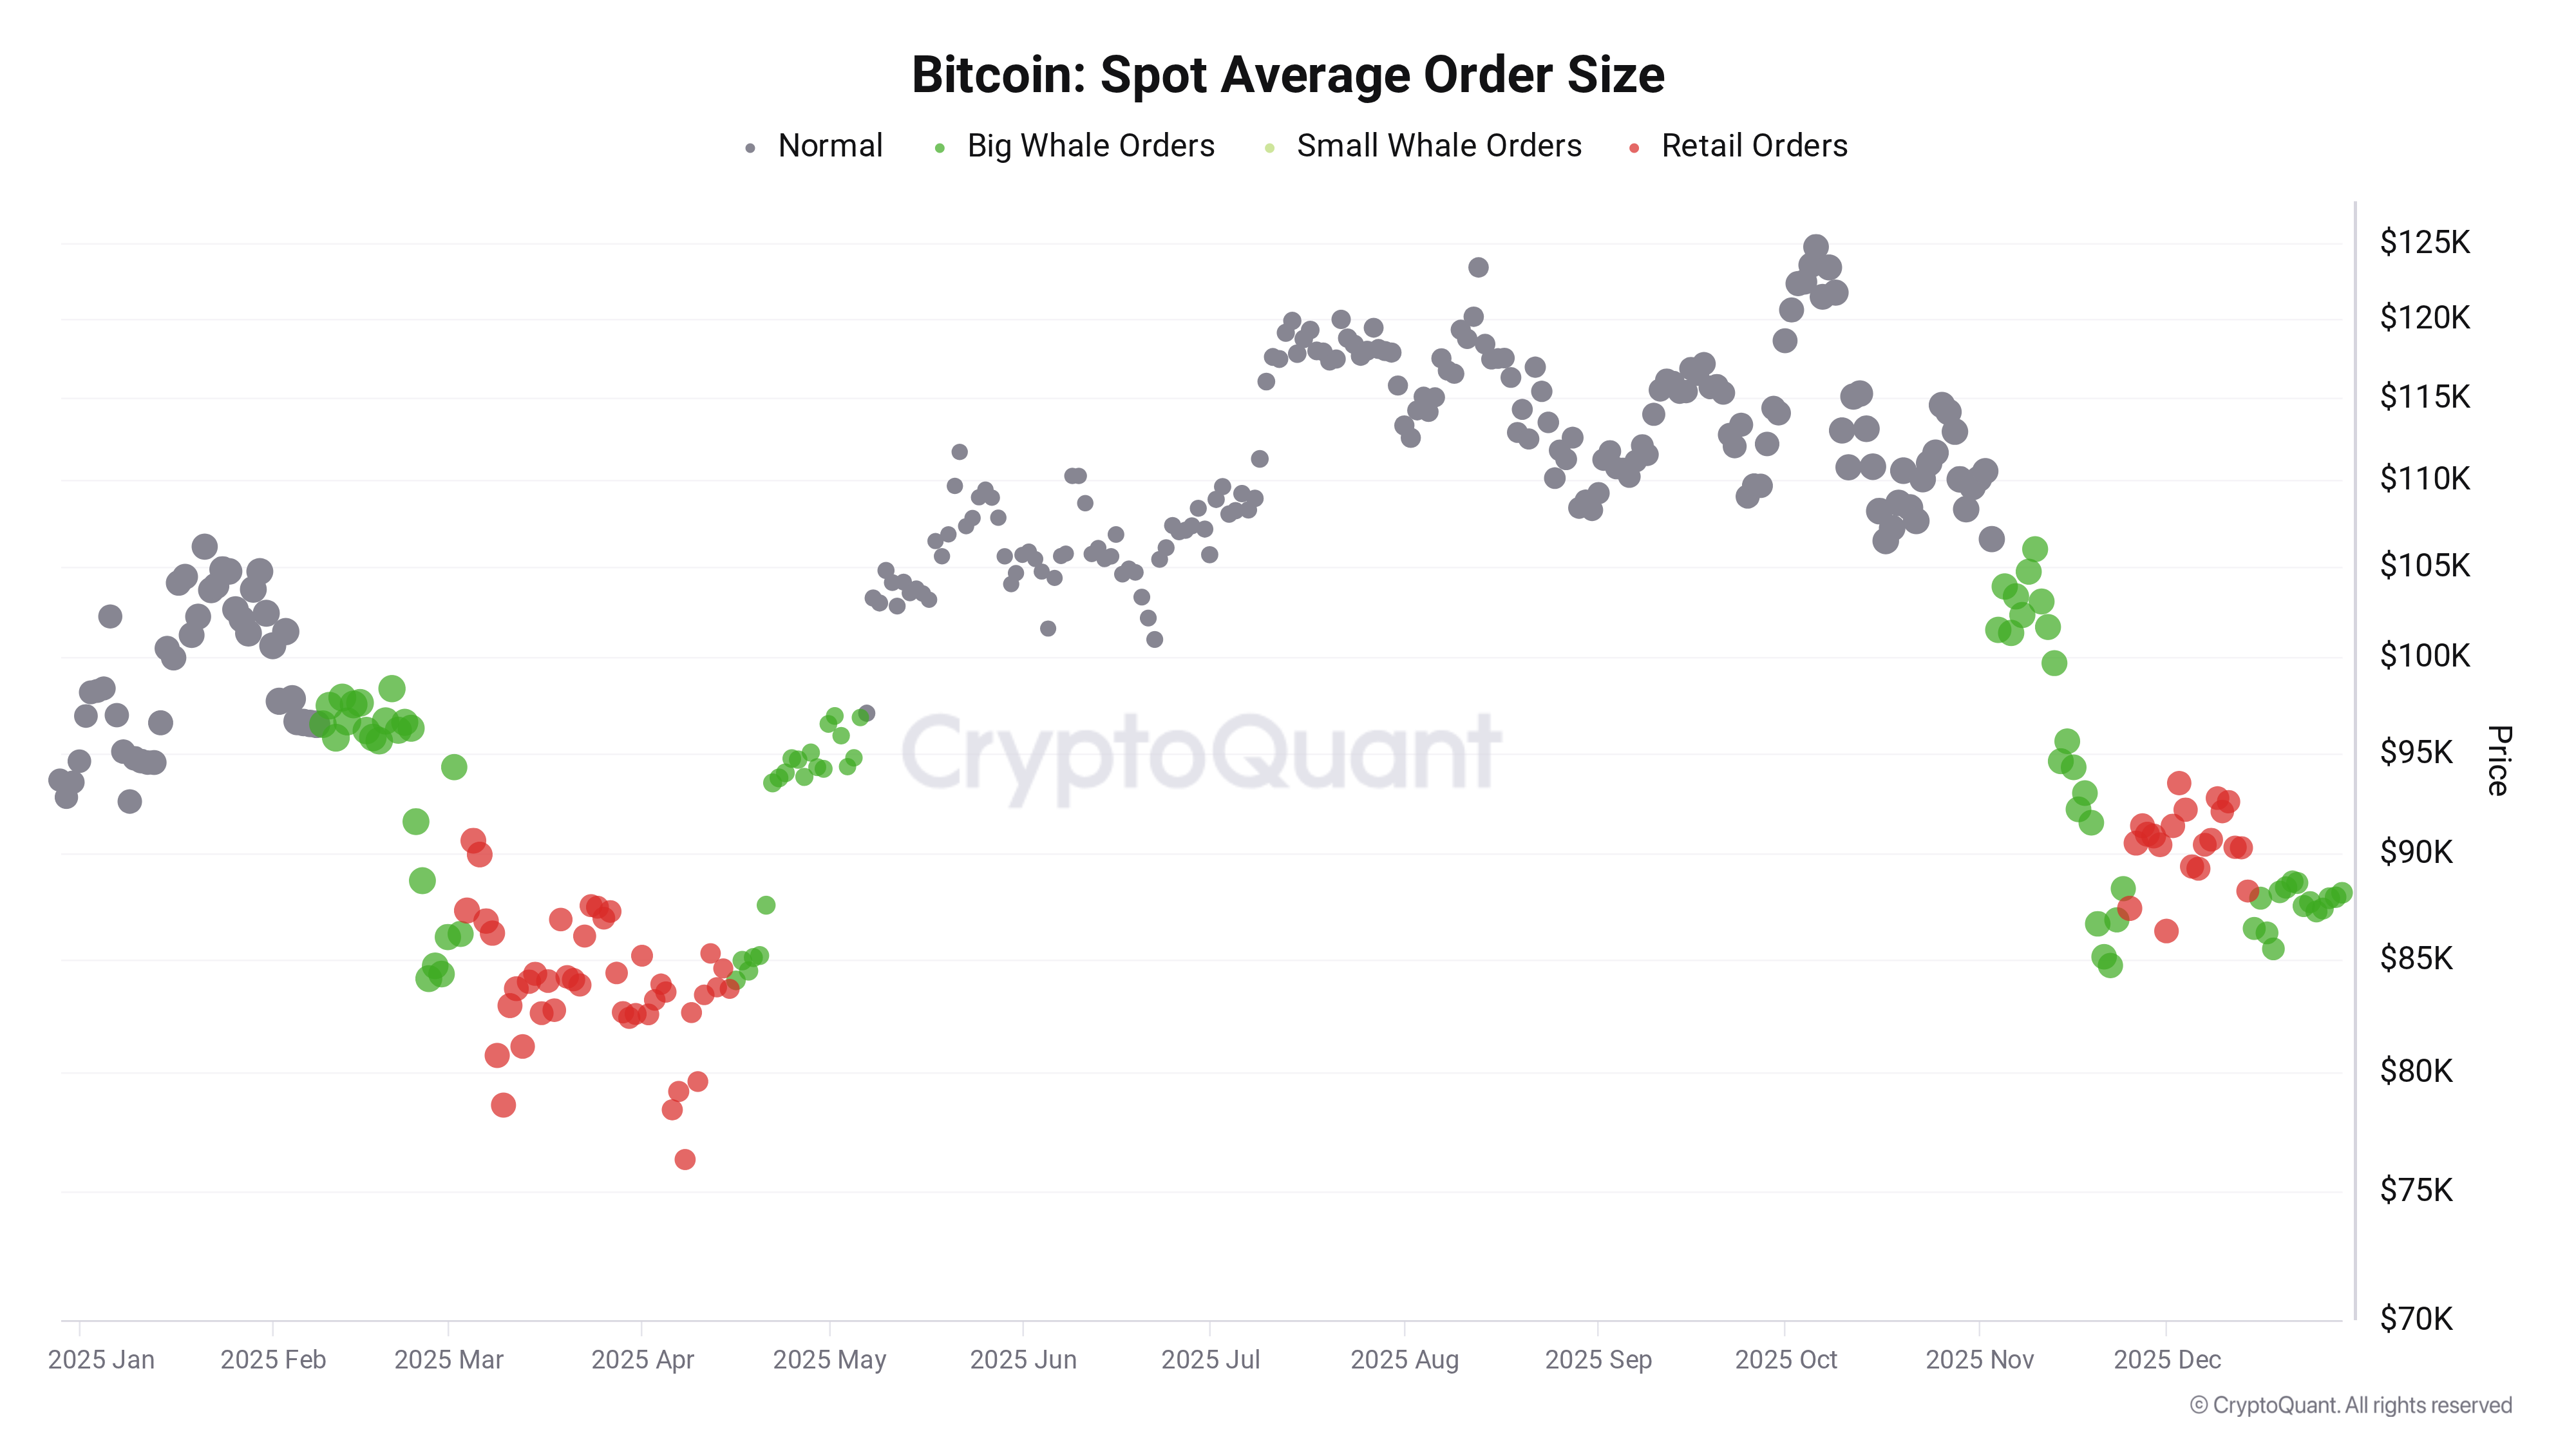
Taking broader whale demand into account, onchain analytics platform CryptoQuant, meanwhile, announced the “reemergence of whale activity.”
“Unlike retail-driven rallies, spot whale participation typically reflects longer-term positioning, especially when it appears during low-volatility, range-bound conditions,” contributor ShayanMarkets wrote in one of its “Quicktake” blog posts Monday.
“This behavior implies that downside risk may be gradually decreasing as stronger hands absorb supply.”
Bitcoin price in 2025: Not so bad after all?
Bitcoin has disappointed bulls in 2025, despite hitting new all-time highs of $126,200 just two months ago.
Related: Bitcoin ‘never’ hit $100K in real terms, SEC’s crypto ‘dream team’: Hodler’s Digest, Dec. 21 – 27
A drawdown of nearly 40% has since wiped out positive sentiment, and the yearly candle close is under 48 hours away.
As Cointelegraph reported, short-term price action has major implications for the broader Bitcoin price thesis this year. A yearly close below $95,500 will mark the first time that BTC/USD seals a “red” candle in a post-halving year.
Bitcoin has 4 days left to close the yearly candle green
If it closes in red then it would be the first in 14 years for a 3rd bull-market year….signaling a structural shift and breaking the 4-year cycle thesis pic.twitter.com/JjQ8QVtC6f
— Ajay Kashyap (@EverythingAjay) December 27, 2025
As market participants query whether Bitcoin may no longer move in four-year price cycles as a result, CryptoQuant research attempted to put recent performance in perspective.
Comparing the retracement from October’s highs to others this cycle and previously, data revealed that bulls have, in fact, avoided the worst of what bear markets can do.
“What differentiates the current cycle is the degree of drawdown compression observed so far,” contributor CryptoZeno wrote in a Quicktake post over the weekend.
“Despite a restrictive interest rate environment and persistent macro uncertainty, Bitcoin has not experienced the same depth of downside seen in prior bear phases at similar points in time.”
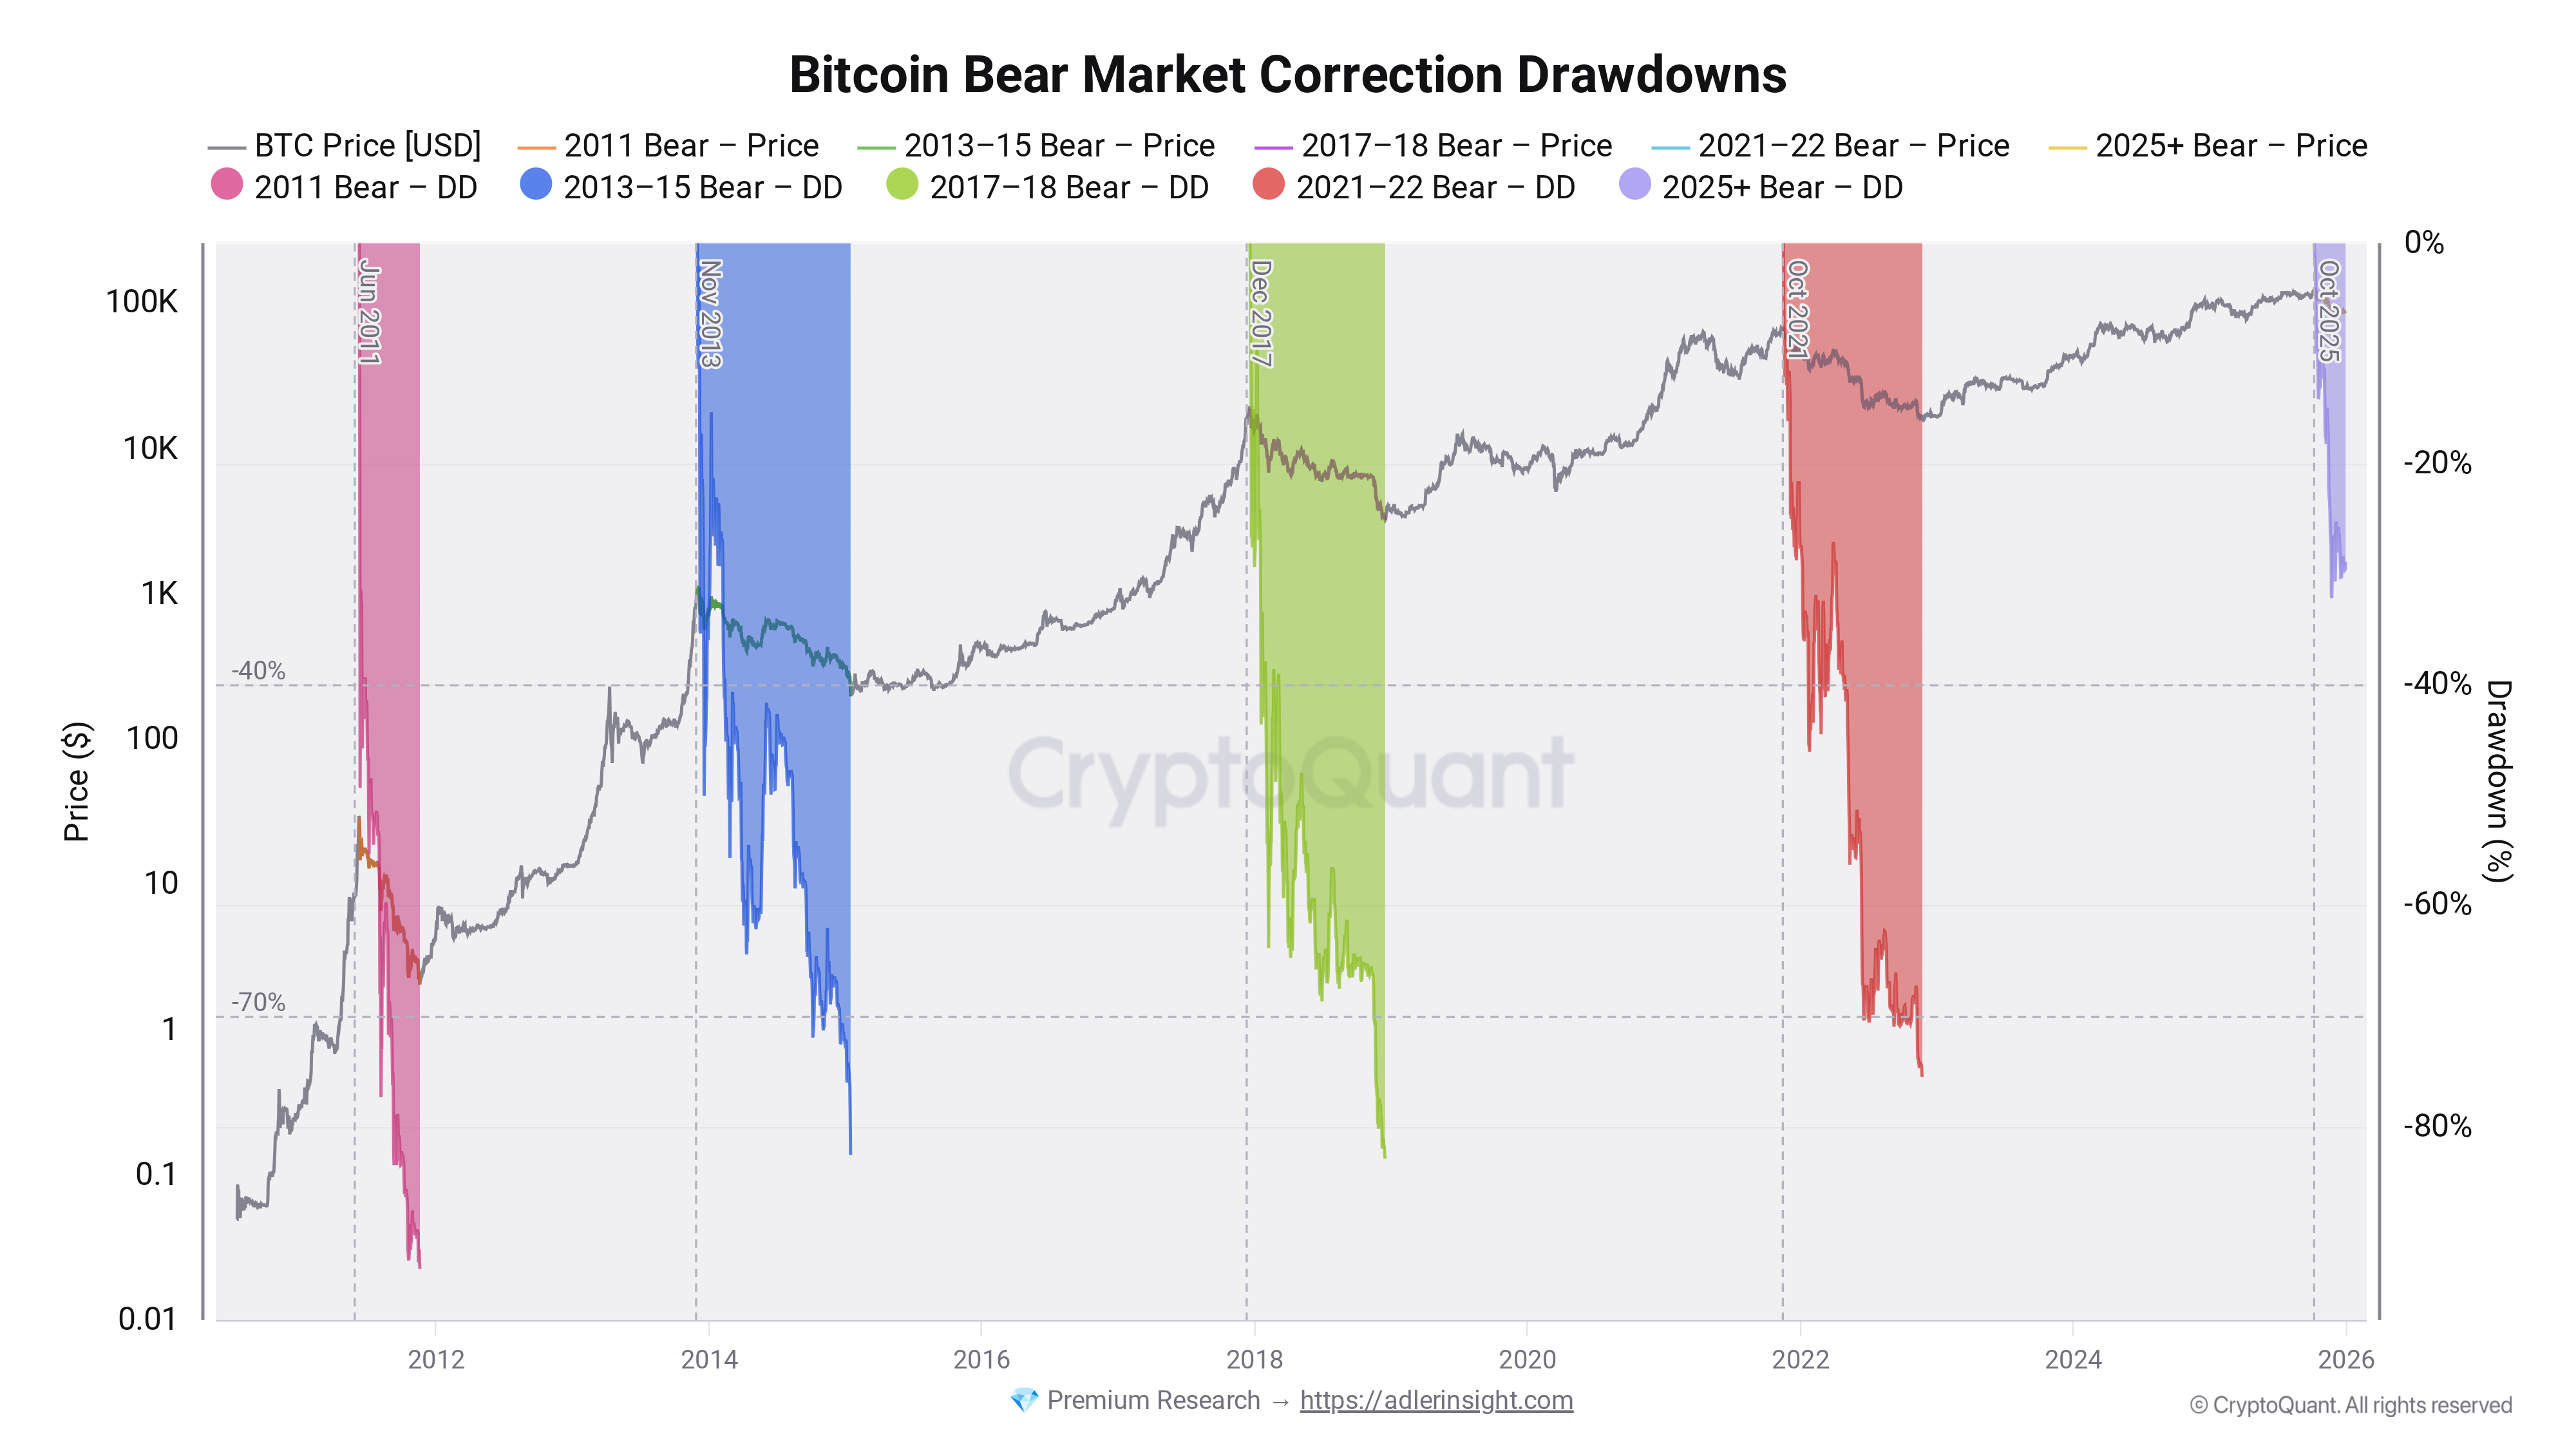
CryptoZeno sees a more mature market preventing the wild swings seen in previous long-term price downtrends.
“From an on-chain perspective, this aligns with a market structure where forced selling has been more limited, leverage excess has been materially reduced compared to the 2021 cycle, and long-term holder supply remains relatively resilient,” he added.
This article does not contain investment advice or recommendations. Every investment and trading move involves risk, and readers should conduct their own research when making a decision. While we strive to provide accurate and timely information, Cointelegraph does not guarantee the accuracy, completeness, or reliability of any information in this article. This article may contain forward-looking statements that are subject to risks and uncertainties. Cointelegraph will not be liable for any loss or damage arising from your reliance on this information.
This article does not contain investment advice or recommendations. Every investment and trading move involves risk, and readers should conduct their own research when making a decision. While we strive to provide accurate and timely information, Cointelegraph does not guarantee the accuracy, completeness, or reliability of any information in this article. This article may contain forward-looking statements that are subject to risks and uncertainties. Cointelegraph will not be liable for any loss or damage arising from your reliance on this information.
