


Bitcoin (BTC) charged toward $90,000 during the early Asia trading hours on Monday as a key market metric suggested a “tactical” upside potential for BTC price.
Key takeaways:
-
Bitcoin is up 6.5% from recent lows, fueling “Santa Rally” hopes with targets up to $120,000.
-
Short liquidations are dominating, which can provide fuel for the bulls.
-
Bitcoin price must not fall below $84,000 for a sustained recovery.
”Santa rally” talk returns as BTC gains $5,000
Data from Cointelegraph Markets Pro and TradingView showed BTC/USD hitting an intra-day high of $89,850, up 6.5% from a local low of $84,400.
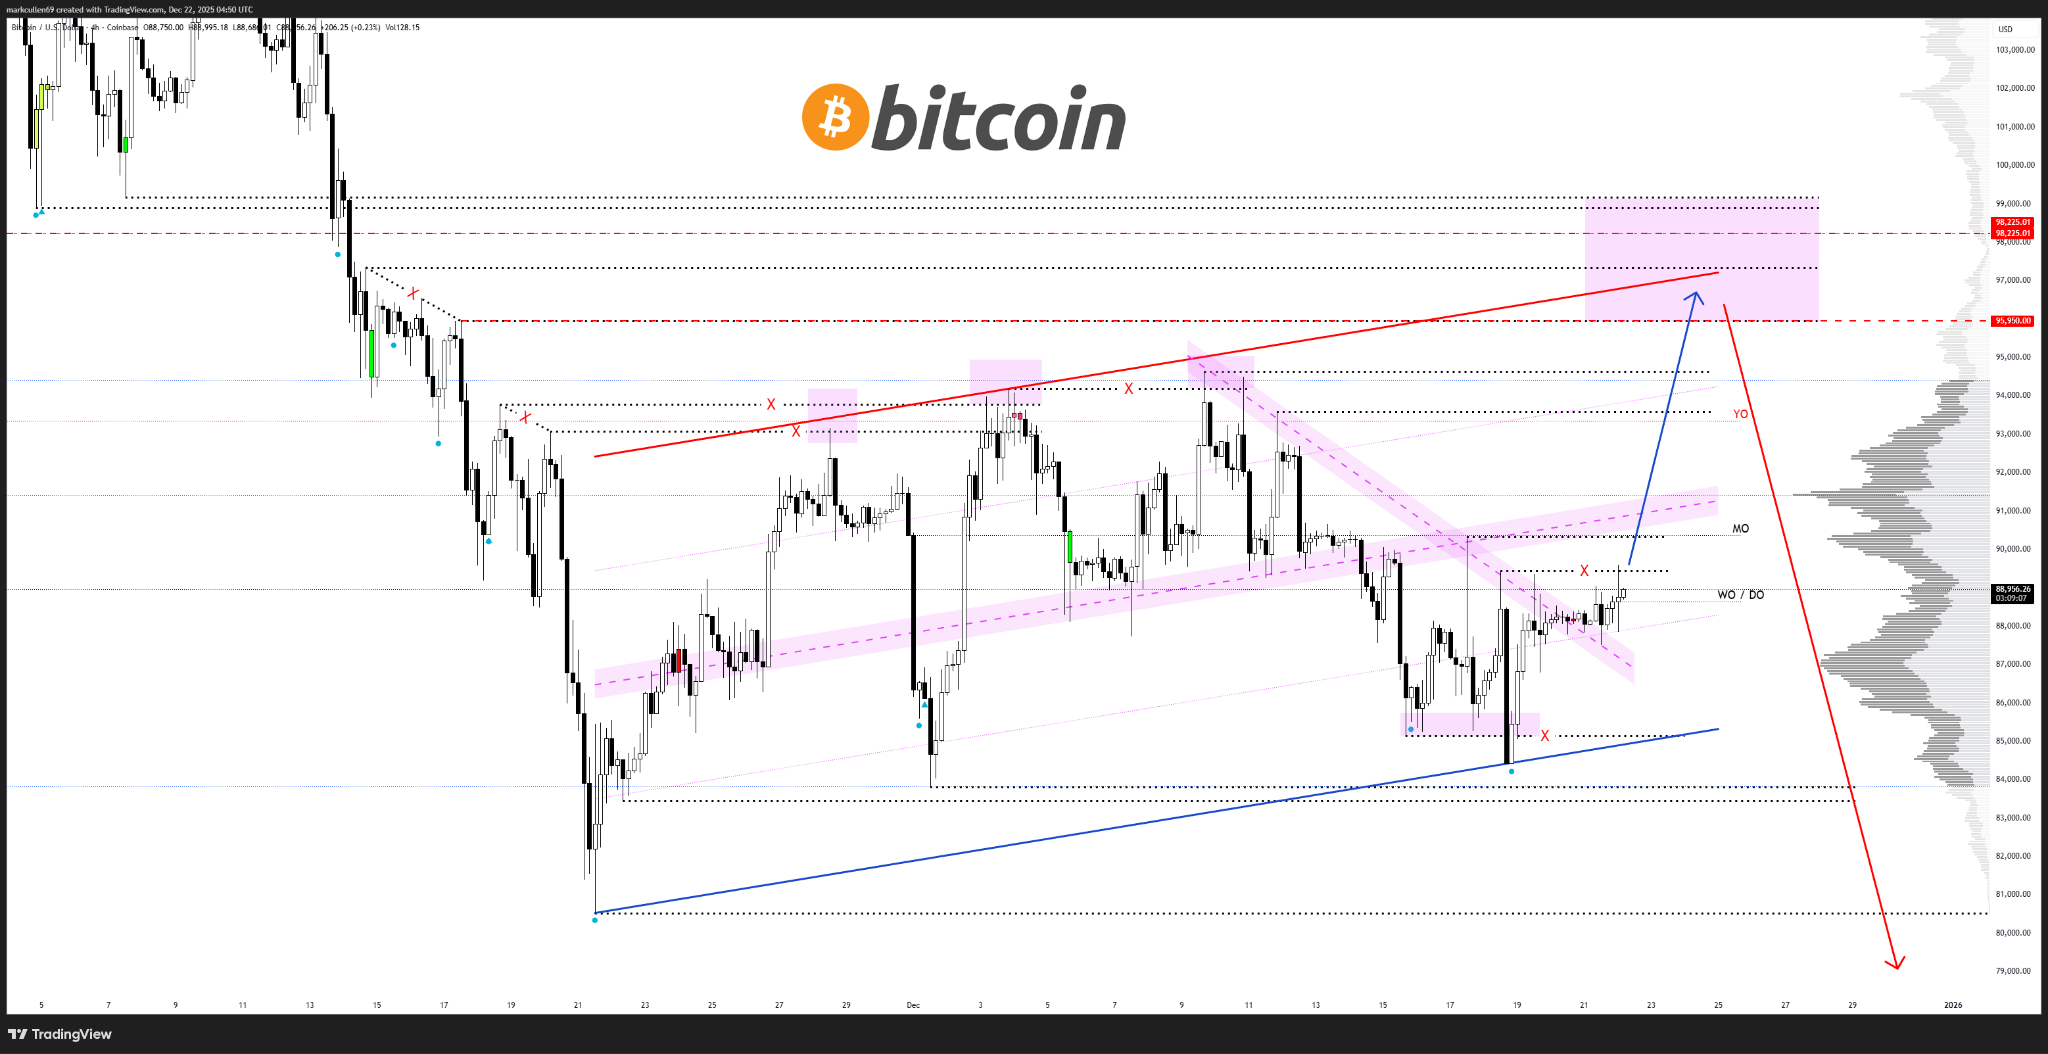
Bitcoin is “looking for a Santa Rally,” analyst AlphaBTC said in an X post on Monday.
An accompanying chart suggested that the ongoing recovery could see the BTC/USD pair rise higher, first toward the yearly open at $93,300 and later toward the $98,000 and $100,000 resistance zone.
“Give us an early X-mas present and send it to $98-$100K.”
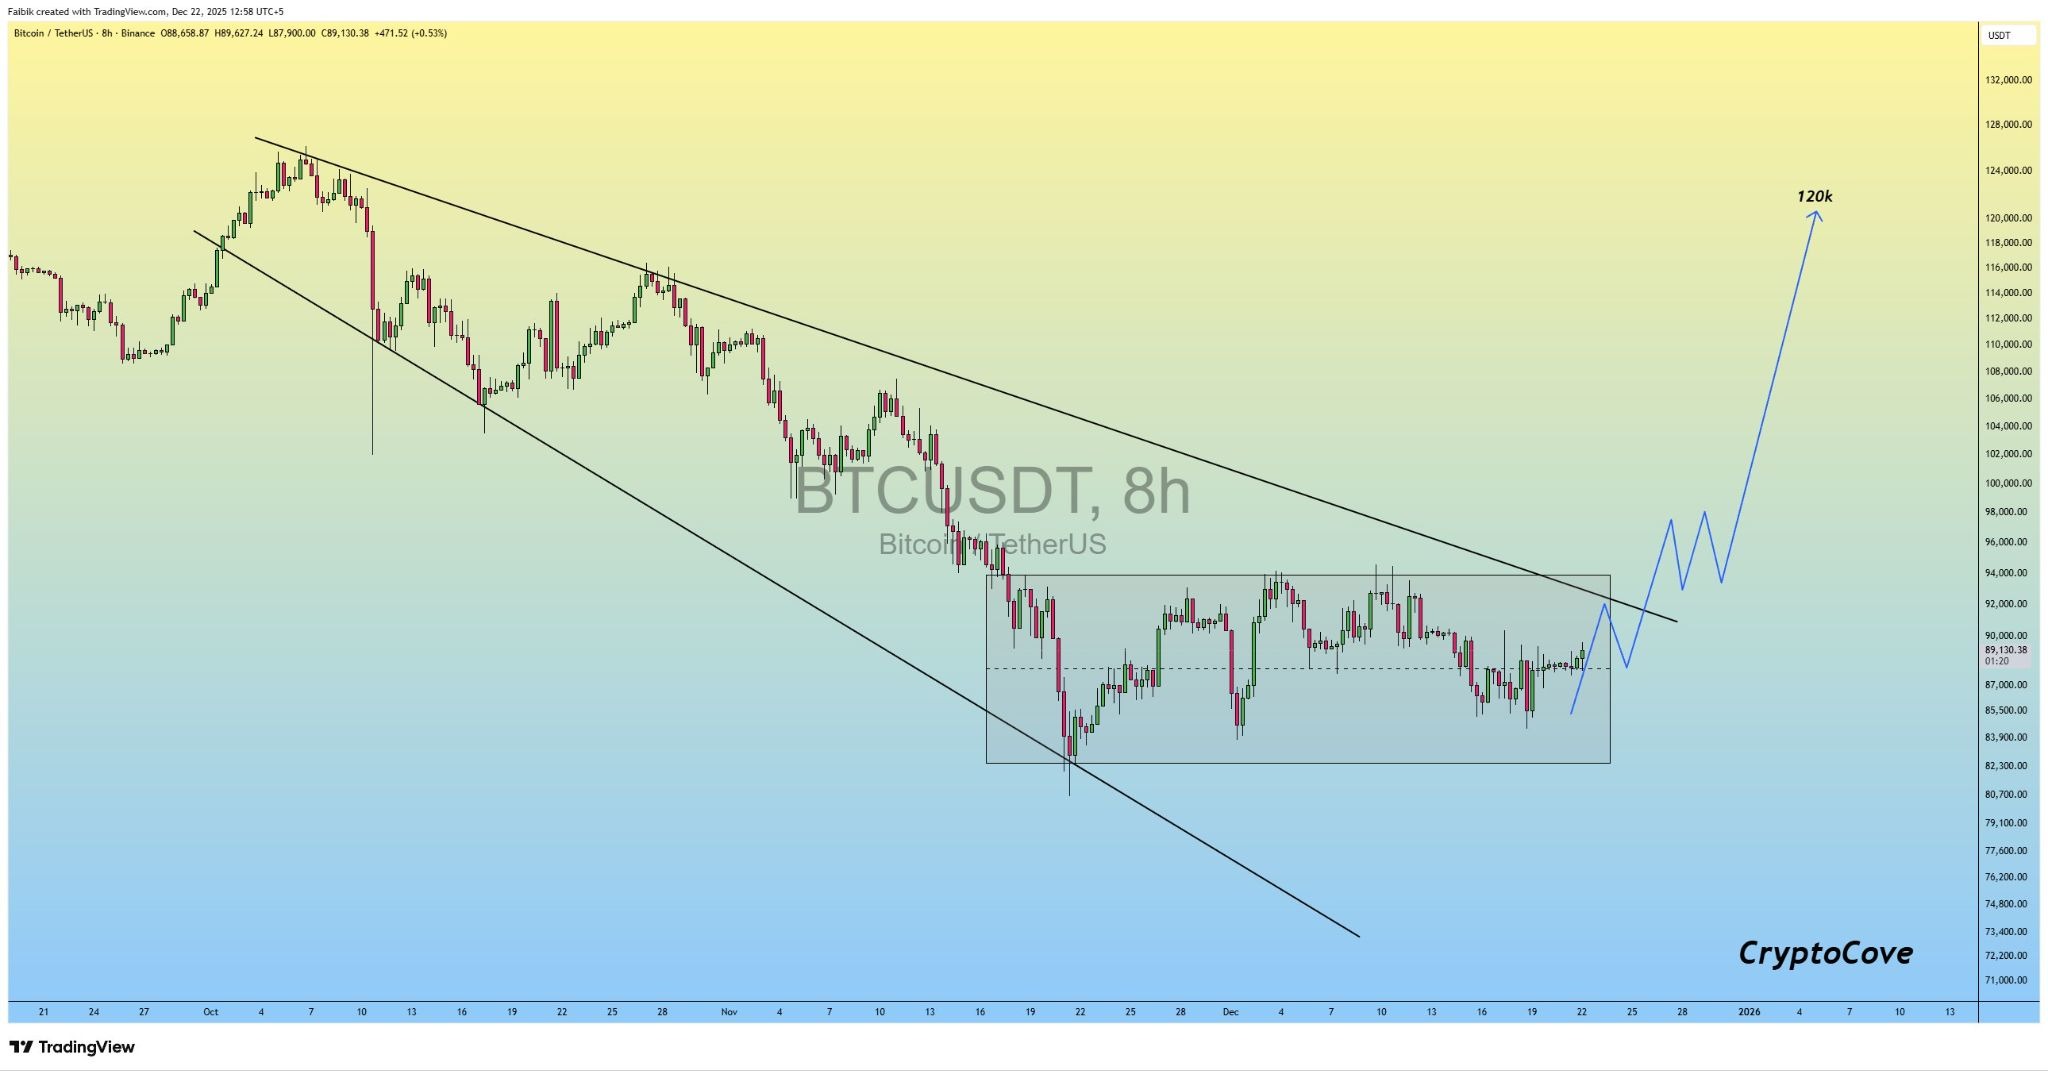
Fellow analyst Captain Faibik said Bitcoin was looking to break out of a bullish megaphone pattern after consolidating within a wide range stretching from $82,000 to $95,000 since Nov. 22.
Related: $90K BTC vs. record gold price: 5 things to know in Bitcoin this week
The “longer the consolidation, stronger and bigger the rally that follows,” the analyst added.
The measured target of the megaphone pattern is $120,000, representing a 34% rally from the current price.
Not all analysts expect the “Santa Rally” to materialize, however, as six-figure BTC price forecasts conflict with warnings of a drawdown to $70,000.
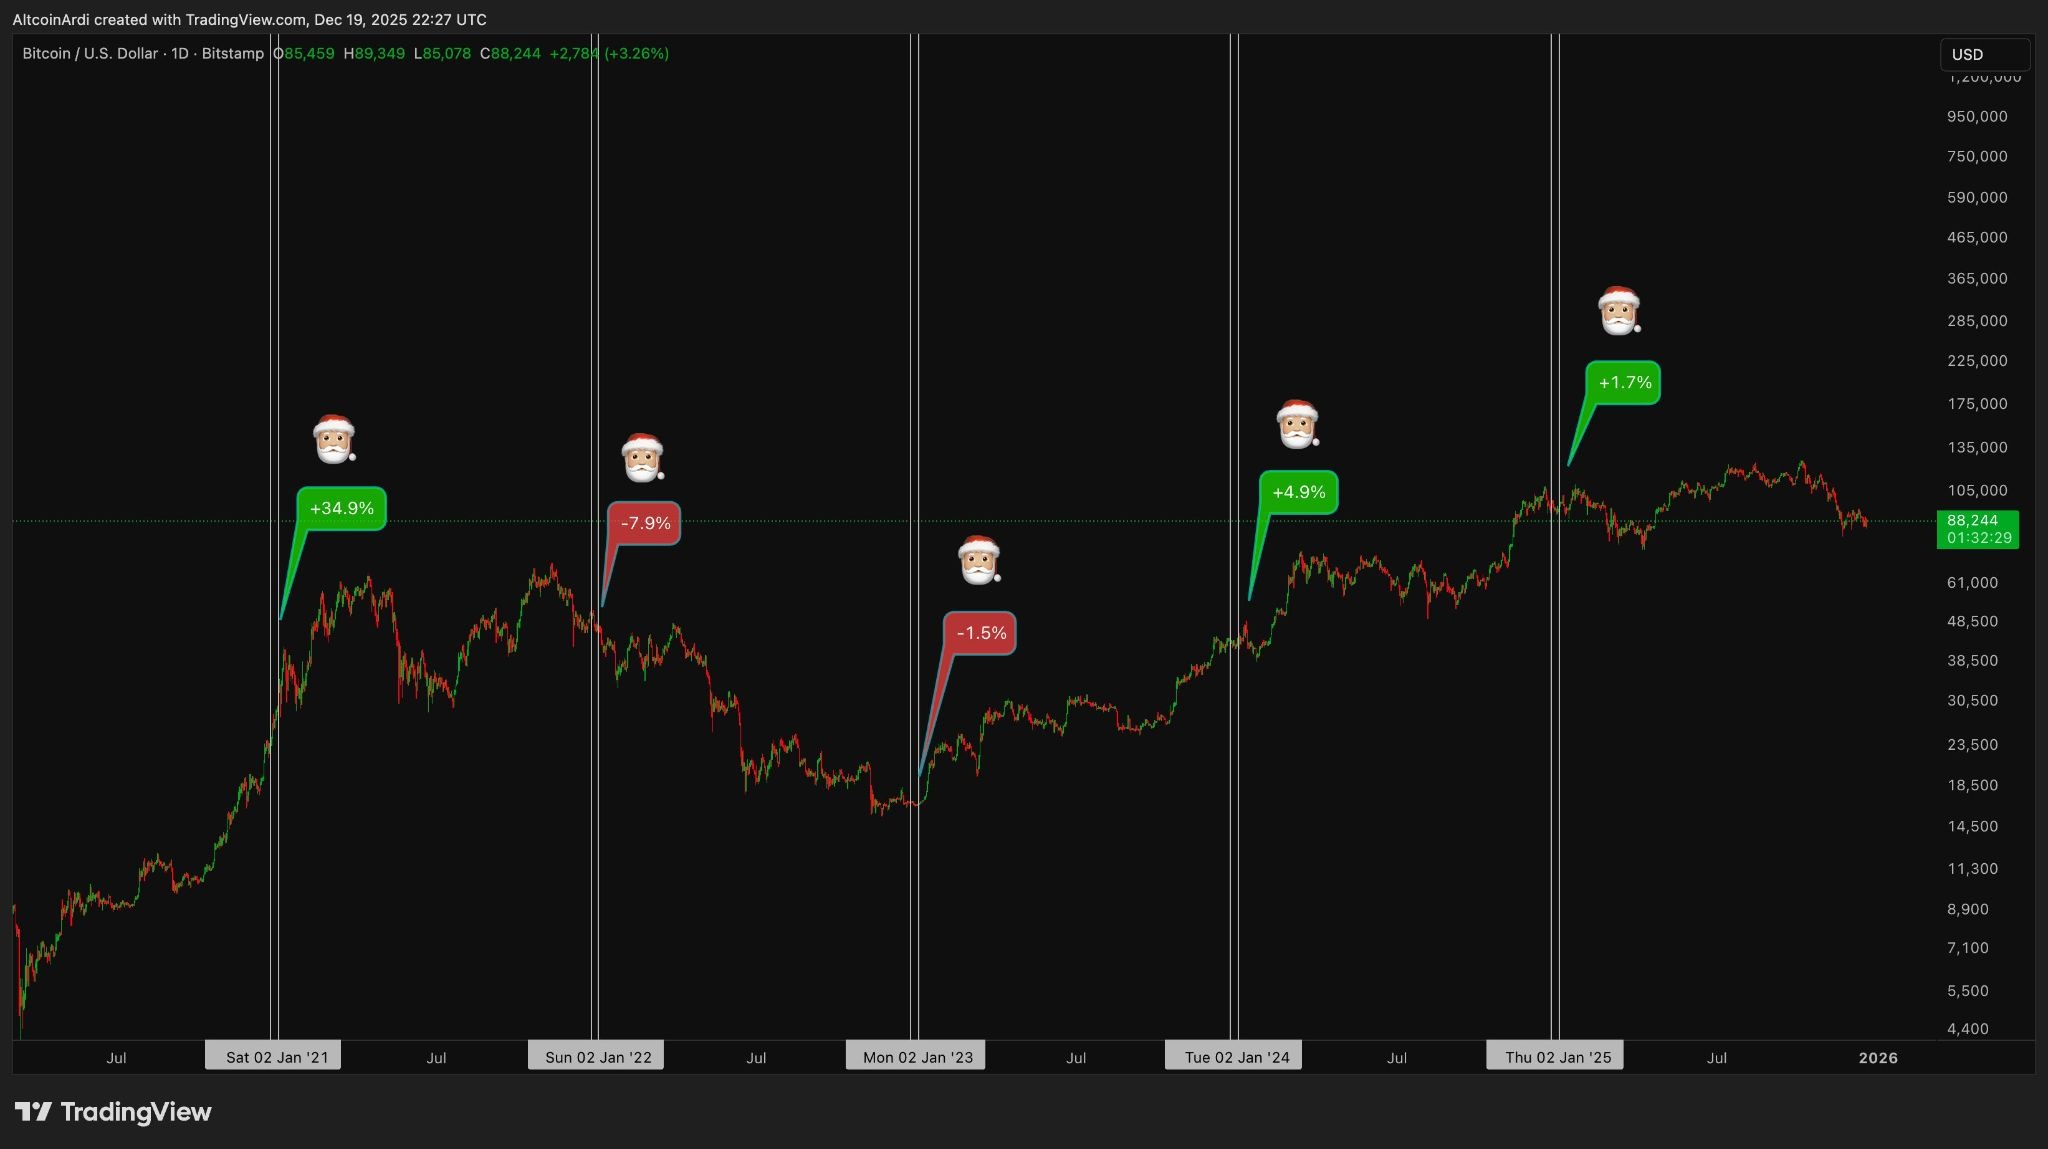
Tracking the “Santa rally” window (Dec 24 – Jan 2) over the last five years, Ardi said Bitcoin has been posting “diminishing returns and actual sell pressure,” with +34.5% gains in 2020 being an outlier.
The chart below, based on the 4-Year Cycle, shows that “2025 sits in the same post-halving position as 2021” when BTC posted -7.9% returns over this period, the analyst said, adding:
“So far in December, we are seeing the same structural signatures as 2021, with heavyweights offloading into the festive bid.”
Bitcoin’s derivatives give bulls “tactical” advantage
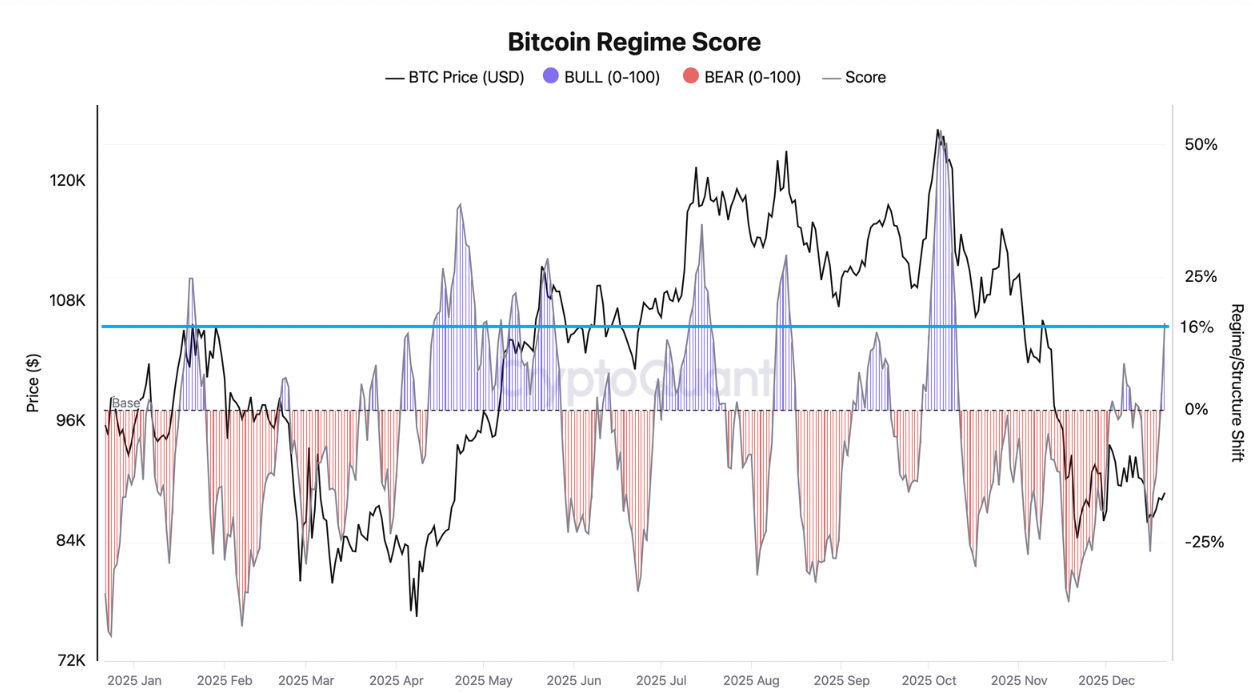
Bitcoin’s current market setup offers tactical upside potential, reinforced by a favorable derivatives structure in the futures market, according to CryptoQuant analyst Axel Adler Jr, who said in a Monday X post:
“BTC is entering a window for a Santa rally: the Regime Score is bullish but not overheated.”
The chart below shows that Bitcoin’s regime score is at 16.3%, placing the BTC/USD pair in the upper neutral zone, a historically bullish signal.
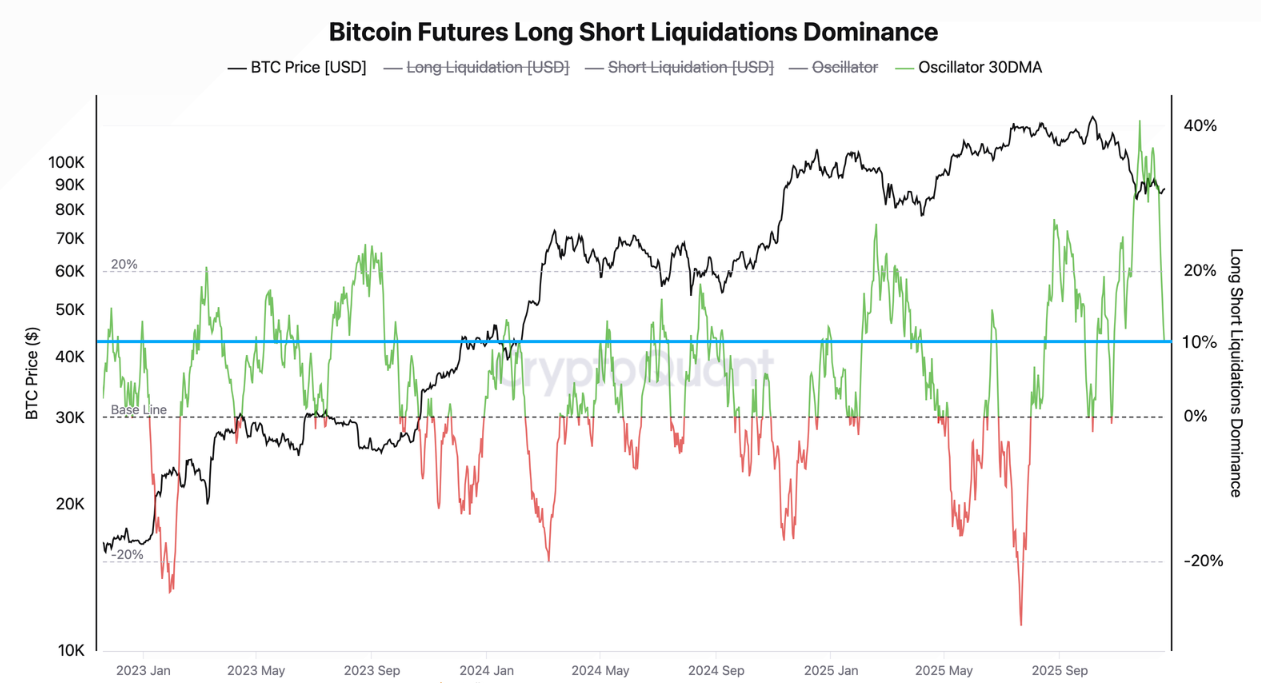
The key for the bulls comes from the derivatives liquidation structure, which indicates a predominance of short position closures, which can create upward pressure on the price.
The long/short liquidation dominance oscillator has dropped to -11%, signalling a surge in forced short position closures, while its 30-day moving average remains positive at 10%, as shown in the chart below.
“This divergence points to a recent surge in forced short position closures,” said, adding:
“The predominance of short liquidations creates tactical fuel for upside.”
Bitcoin’s key support remains $84,000
Bitcoin’s price has held successfully above the $84,000 psychological level since retesting it on Nov. 11. This has remained a critical level on traders’ radars and one that has to be defended to avoid further downside.
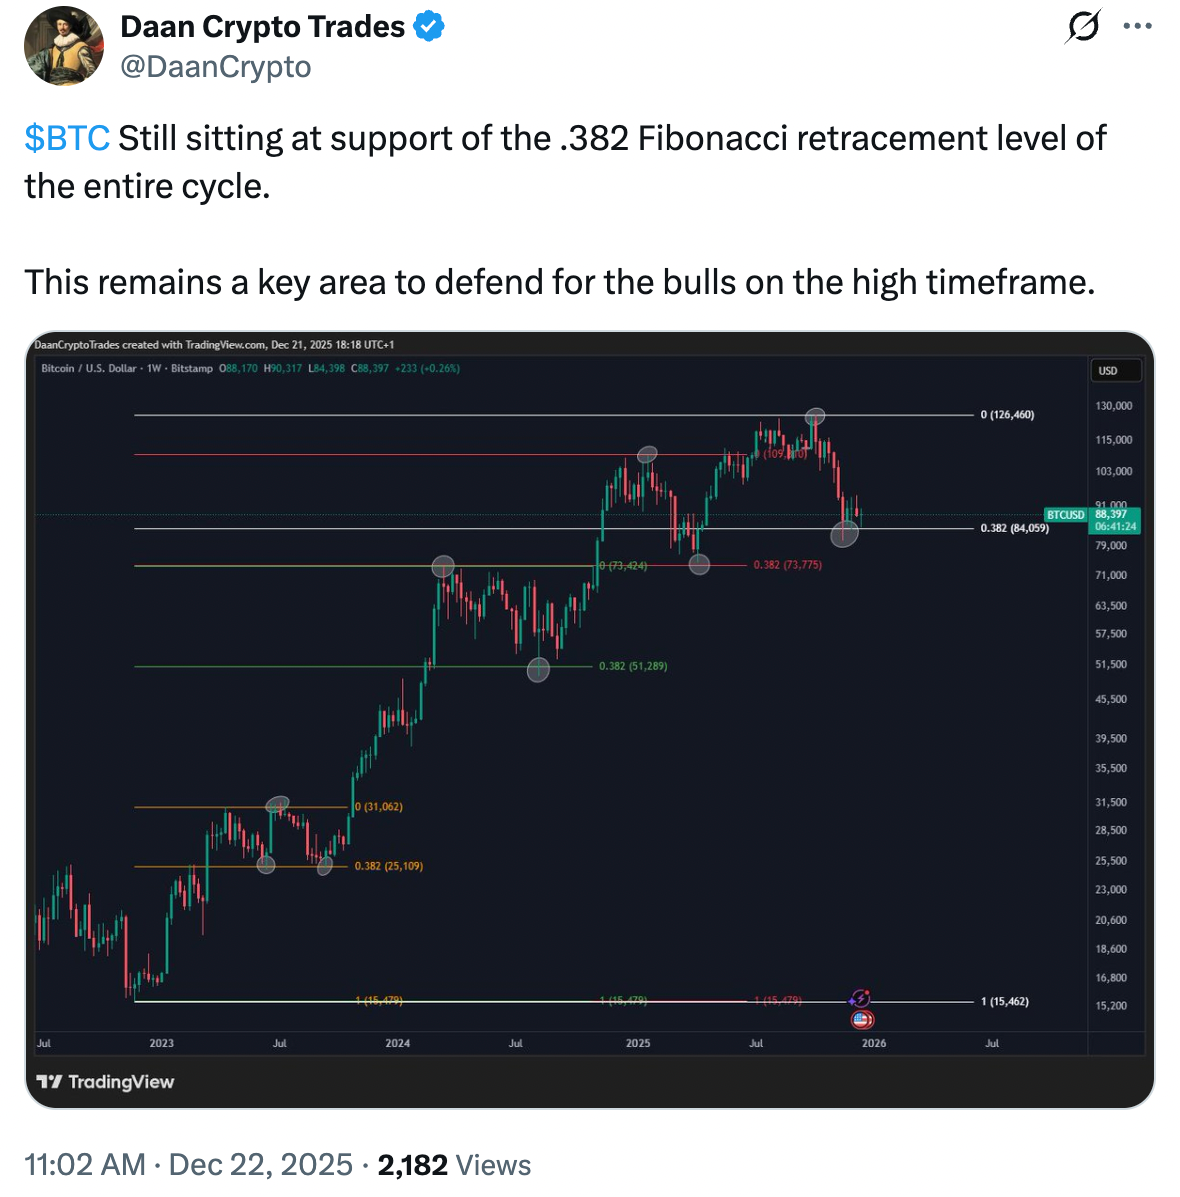
Trader and analyst Daan Crypto Trades said that $84,000 “remains a key area to defend for the bulls on the high timeframe.”
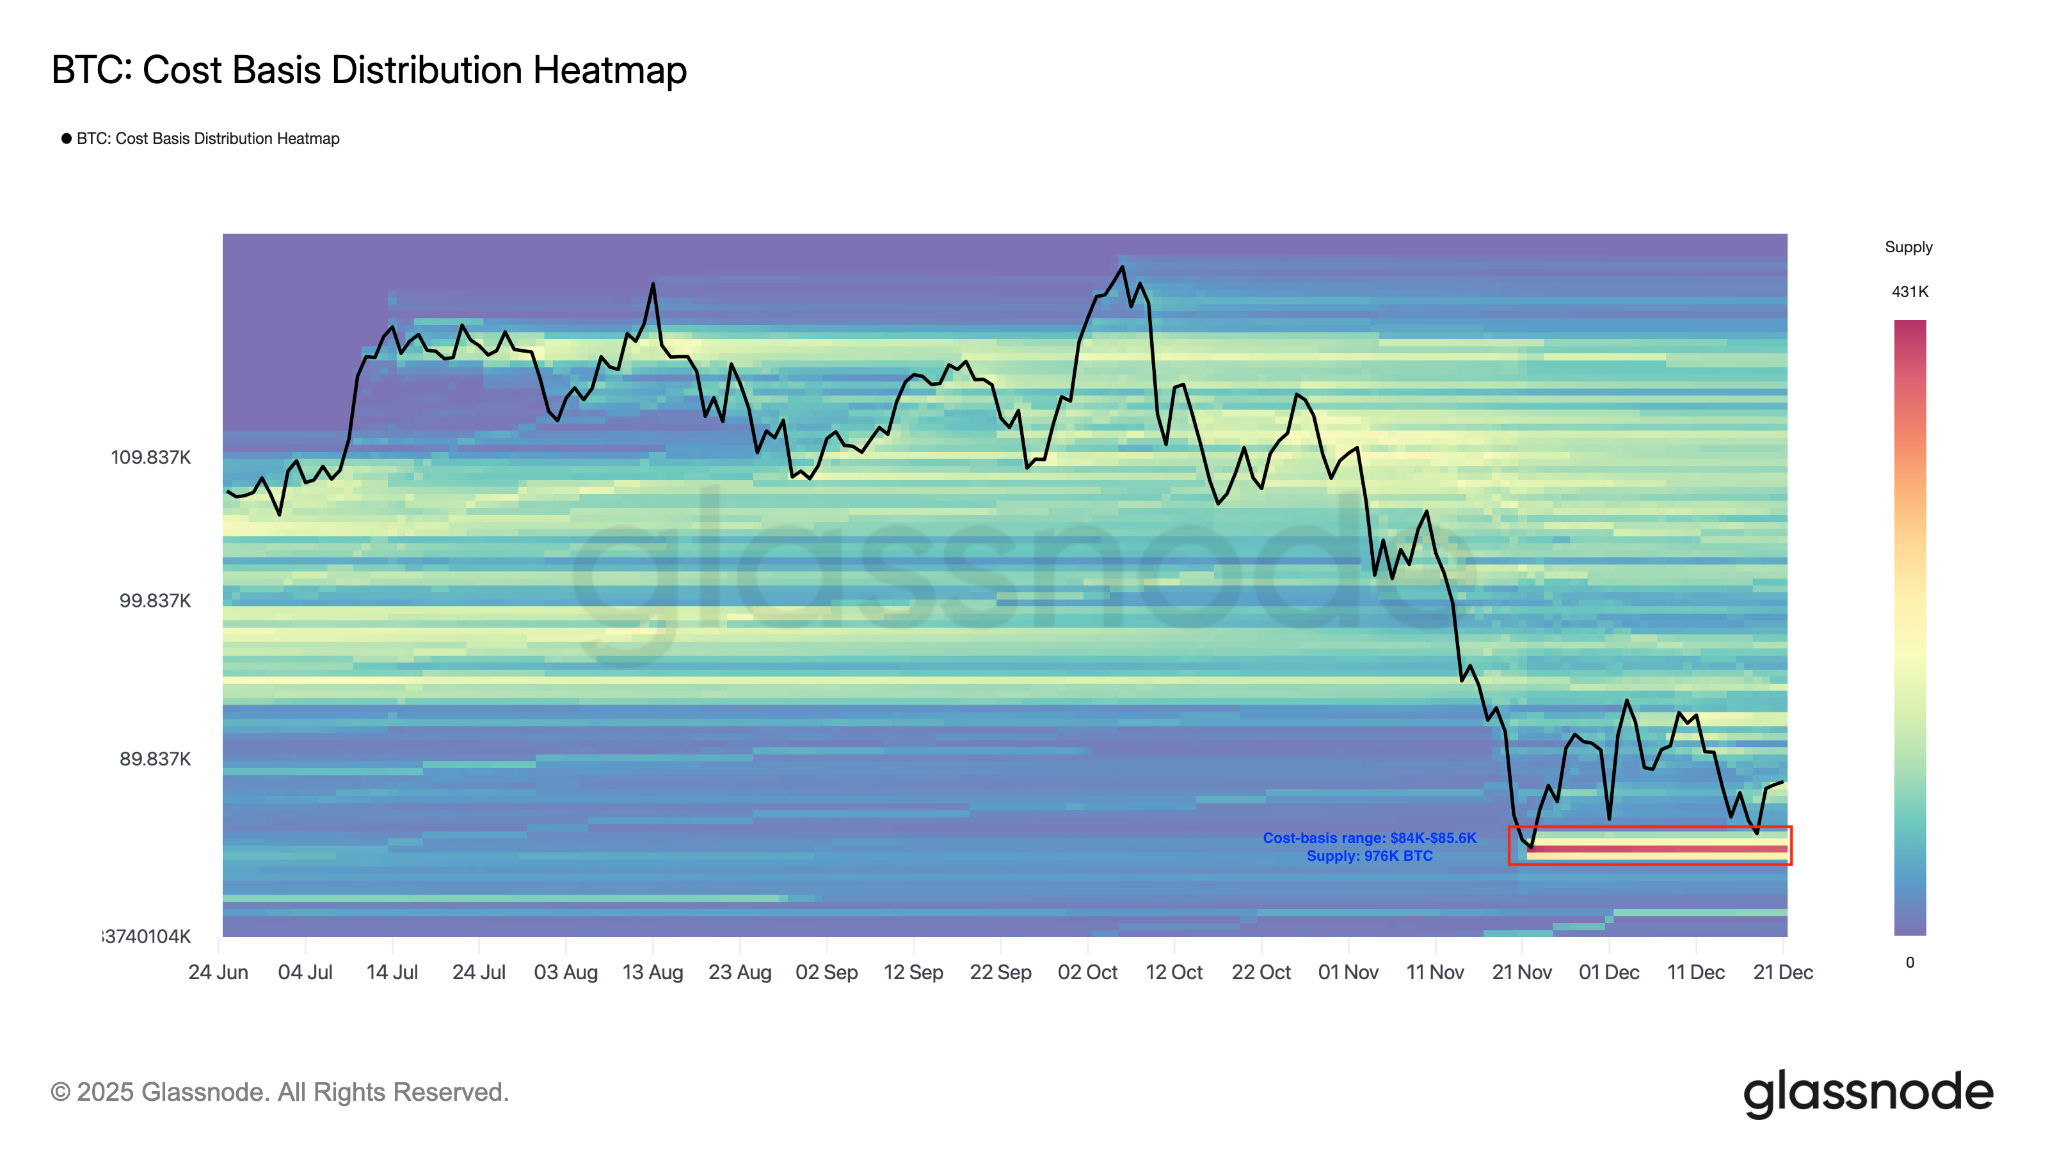
Glassode’s cost basis distribution heatmap reinforces the importance of this level. The immediate support sits at $84,000-$85,600, where investors acquired about 976,000 BTC.
Holding above this level is a key prerequisite for regaining momentum toward $100,000 or higher.
As Cointelegraph reported, the bears look to breach the support at $84,000, with their sights set on the next target at $80,000.
This article does not contain investment advice or recommendations. Every investment and trading move involves risk, and readers should conduct their own research when making a decision. While we strive to provide accurate and timely information, Cointelegraph does not guarantee the accuracy, completeness, or reliability of any information in this article. This article may contain forward-looking statements that are subject to risks and uncertainties. Cointelegraph will not be liable for any loss or damage arising from your reliance on this information.
This article does not contain investment advice or recommendations. Every investment and trading move involves risk, and readers should conduct their own research when making a decision. While we strive to provide accurate and timely information, Cointelegraph does not guarantee the accuracy, completeness, or reliability of any information in this article. This article may contain forward-looking statements that are subject to risks and uncertainties. Cointelegraph will not be liable for any loss or damage arising from your reliance on this information.
