


Key takeaways:
- Cosmos’s price is predicted to reach a maximum value of $4.90 in 2025
- In 2028, the coin could be worth between $13.75 and $16.43, with an average price of $14.23
- By 2031, Cosmos (ATOM) might touch $49.81
Cosmos (ATOM) is a blockchain ecosystem that facilitates interoperability among independent blockchains. Co-founded by Jae Kwon and Ethan Buchman in 2014, Cosmos aims to create a decentralized network of blockchains that can communicate and transact seamlessly. Its main components include the Cosmos Hub, which serves as the central chain, and multiple “zones” that operate under their own rules while connecting to the Hub.
The platform uses the Tendermint consensus algorithm and Inter-Blockchain Communication (IBC) protocol to enable fast, low-cost transactions. Fees average around $0.01, and confirmation times are approximately seven seconds. Cosmos employs a Proof-of-Stake (PoS) mechanism, allowing users to stake their ATOM tokens for network security and transaction validation.
Since its ICO in 2017, Cosmos has raised significant funding and established a growing ecosystem, including notable projects like Terra and Binance. With over 286 million ATOM tokens in circulation and a market cap exceeding $7.7 billion, Cosmos is positioned as a key player in the evolving landscape of blockchain technology, often referred to as the “Internet of Blockchains” for its ambitious goal of connecting diverse blockchain networks.
Overview
| Cryptocurrency | Cosmos |
| Token | ATOM |
| Current Price | $2.78 |
| Market Cap | $1.33B |
| Trading Volume (24-hour) | $221.44M |
| Circulating Supply | 465.48M ATOM |
| All-time High | $ 44.70 on Sept 19, 2021 |
| All-time Low | $1.13 on Mar 12, 2020 |
| 24-hour High | $3.13 |
| 24-hour Low | $2.62 |
Cosmos price prediction: Technical analysis
| Metric | Value |
| Price Volatility (30-day variation) | 6.60% (High) |
| 50-Day SMA | $ 3.28 |
| 14-Day RSI | 40.32 (Neutral) |
| Sentiment | Bearish |
| Fear & Greed Index | 11 (Extreme Fear) |
| Green Days | 12/30 (40%) |
| 200-Day SMA | $4.18 |
Cosmos (ATOM) technical price analysis
TL; DR Breakdown:
- ATOM is showing early signs of stabilization after extended downside but still lacks strong bullish momentum
- A rebound is possible if buyers hold support around $2.60 and push price back above the mid-Bollinger band
- Momentum remains weak overall, so any recovery may be gradual unless volume increases
ATOM/USD 1-Day price chart
According to the 1-day chart on November 20, Cosmos (ATOM) is showing early signs of a possible short-term rebound, but the overall structure for the day remains bearish. The chart shows a long downtrend, with candles always staying close to the lower Bollinger Band. This means that there is a lot of selling pressure. ATOM is attempting to rebound from around $2.60 to $2.70. The RSI has recovered a little from being oversold (from 24 to 44). The price is still below the 20-day and 50-day moving averages, which are still going down, though. If buyers keep up the pace, ATOM could test $2.80–$3.16 again. If it doesn’t stay above $2.60, it could drop again toward the $2.40 support zone.
ATOM/USD 4-hour price chart
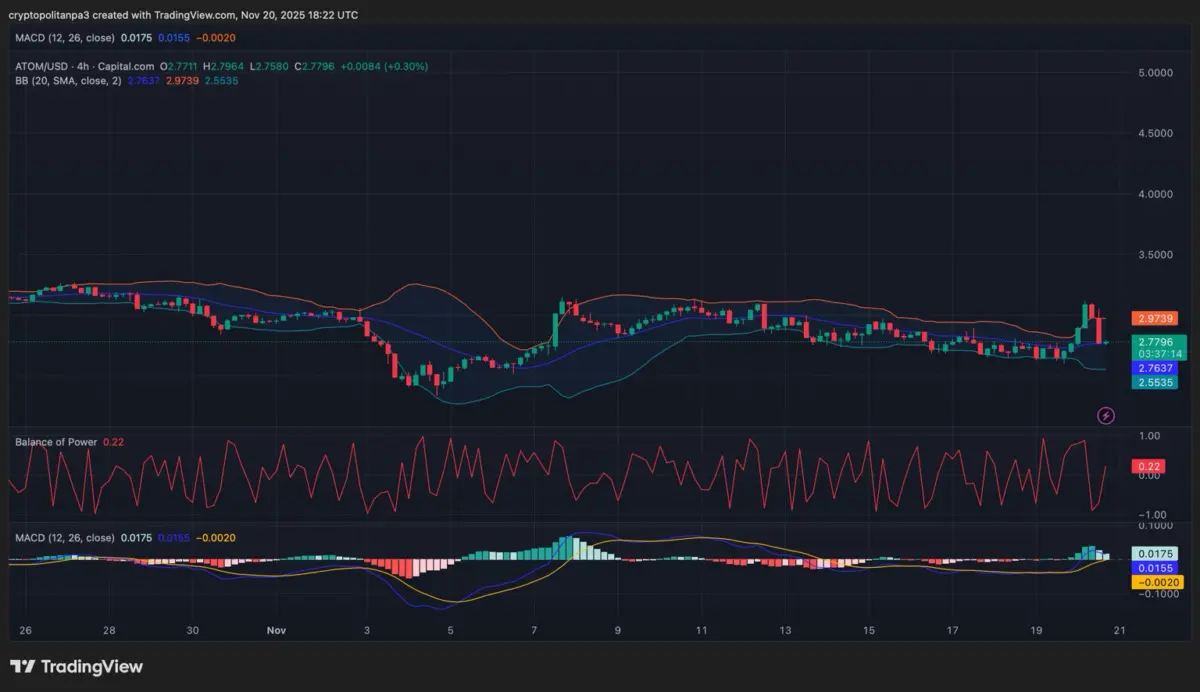
Cosmos ATOM’s 4-hour chart shows a corrective rebound after a sharp dip, but overall momentum remains weak. Price recently bounced from the lower Bollinger Band near $2.55 and briefly tested $2.97 before retracing, showing strong overhead selling pressure. The RSI sits near mid-range, indicating neutral but fragile momentum, while the MACD is attempting a shallow bullish crossover, suggesting only a mild recovery attempt. Balance of Power remains unstable, reflecting inconsistent buyer conviction. If ATOM holds above $2.76 support, it may attempt another push toward $2.95. Failure to hold support risks a pullback toward $2.60.
Cosmos technical indicators: Levels and action
Daily simple moving average (SMA)
| Period | Value | Action |
| SMA 3 | $ 3.36 | SELL |
| SMA 5 | $ 3.16 | SELL |
| SMA 10 | $ 3.08 | SELL |
| SMA 21 | $ 2.95 | SELL |
| SMA 50 | $ 3.28 | SELL |
| SMA 100 | $ 3.87 | SELL |
| SMA 200 | $4.18 | SELL |
Daily exponential moving average (EMA)
| Period | Value | Action |
| EMA 3 | $ 3.01 | SELL |
| EMA 5 | $ 3.23 | SELL |
| EMA 10 | $ 3.63 | SELL |
| EMA 21 | $ 4.01 | SELL |
| EMA 50 | $ 4.27 | SELL |
| EMA 100 | $ 4.38 | SELL |
| EMA 200 | $4.64 | SELL |
What to expect from ATOM price analysis next?
Cosmos (ATOM) is starting to stabilize, but the overall trend is still bearish. ATOM is still below the 20-day and 50-day moving averages on both the 1-day and 4-hour charts, which shows that the downward pressure is still there. Recent spikes in volatility and long wicks show that people are trying hard to recover, but buyers don’t have enough momentum to keep going. The RSI is in the mid-40s on both timeframes, which means that sentiment is weak but getting better. If ATOM stays above $2.55–$2.60, it could try to bounce back up to $2.90–$3.05. If you don’t protect this area, you could go back to lower supports. Overall, consolidation with cautious upside attempts appears most likely next.
Is Cosmos a good investment?
Cosmos (ATOM) shows potential as an investment due to its innovative approach to blockchain interoperability and recent upgrades like ATOM 2.0. Analysts predict long-term price growth, but the crypto market is highly volatile. Investors should conduct their research and consider risks before investing in ATOM.
Why is Comsos Atom down today?
Cosmos (ATOM) is down today because the 1-day and 4-hour charts show that the market is still going down. The 1-day chart shows that ATOM has been trading below the 20-day and 50-day moving averages for a long time, which means that the price is going down. Bollinger Bands are still wide, and the price is following the lower band, which shows that selling pressure is still strong. RSI stays low, which shows that buyers are losing interest. On the 4-hour chart, lower highs and lower lows that happen over and over again confirm a bearish structure in the short term. The MACD, on the other hand, stays flat to negative, showing that there isn’t a lot of strong reversal momentum. When you put all of these technical signals together, they show that prices are going down because of weak demand, trend exhaustion, and a lack of bullish volume.
Is Cosmos a safe Network?
The Cosmos network is built on the Tendermint consensus protocol, offering robust security and interoperability features. However, like all blockchain systems, it faces potential risks, requiring users to remain cautious and well-informed about emerging vulnerabilities and challenges.
Will Cosmos reach $50?
Based on Cosmos’ current market trends and growth projections, Cosmos (ATOM) is expected to reach a value of approximately $33.53 by 2030.
Will Cosmos reach $100?
Current predictions suggest that Cosmos (ATOM) will likely reach $110.10 in 2033. Analysts estimate it would require a significant increase of over 900% to hit that price.
Does Cosmos have a good long-term future?
Cosmos (ATOM) promises a strong long-term future, with forecasts indicating significant price increases over the next decade. Analysts predict that ATOM could reach values as high as $33.53 by 2030, driven by its unique position in the blockchain ecosystem and ongoing developments in interoperability and scalability. The Cosmos Hub is well-established and supported by a dedicated community, enhancing its growth and adoption prospects in the evolving cryptocurrency landscape. Thus, the cosmos network could expand to a wider user base.
Recent news/opinion on Cosmos
Cosmos Labs announced a plan to make Cosmos stronger in the blockchain market, especially in payments and tokenization. Cosmos CEO said that the new Cosmos Stack will focus on five main areas: performance, connectivity, EVM compatibility, developer control, and user experience. Improvements in CometBFT and other new technologies are expected to make Cosmos a top choice for real-world blockchain applications by making it easier to scale and work with other systems.
Cosmos Price Prediction November 2025
As for November 2025, Cosmos (ATOM) is forecast to reach a lowest price of $4.25, a maximum of $4.72, and an average of $4.46.
| Month | Potential Low | Potential Average | Potential High |
| November 2025 | $4.25 | $4.46 | $4.76 |
Cosmos Price Prediction 2025
According to our deep technical analysis on past price data of ATOM, in 2025 the price of Cosmos is forecasted to reach a minimum of $4.47, a maximum of $4.90, and an average trading value of $4.64. This projection is supported by moderate ecosystem growth, continued adoption of IBC for cross-chain communication, and consistent validator participation, while overall market consolidation and reduced speculative momentum keep ATOM’s price within this stable range.
| Year | Potential Low | Average Price | Potential High |
| 2025 | $4.47 | $4.64 | $4.90 |
Cosmos price predictions 2026-2031
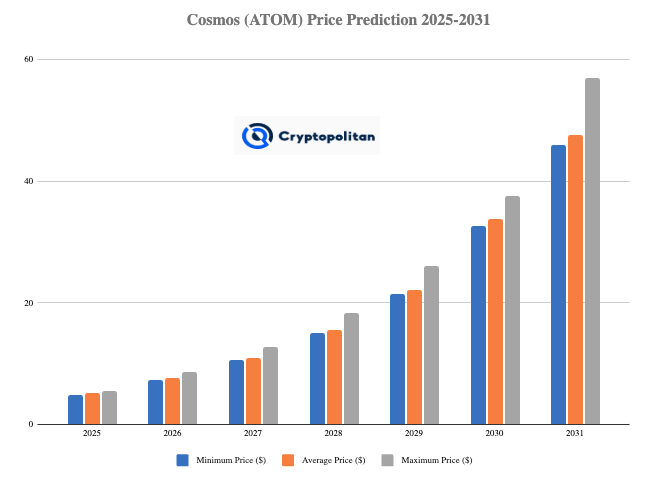
| Year | Potential Low ($) | Average Price ($) | Potential High ($) |
| 2026 | $6.07 | $6.30 | $7.74 |
| 2027 | $9.45 | $9.70 | $10.66 |
| 2028 | $13.75 | $14.23 | $16.43 |
| 2029 | $19.52 | $20.09 | $23.72 |
| 2030 | $28.38 | $29.18 | $33.53 |
| 2031 | $42.19 | $43.65 | $49.81 |
Cosmos Price Prediction 2026
The price of 1 Cosmos (ATOM) is expected to reach a minimum level of $6.07 in 2026, with a maximum of $7.74 and an average of $6.30. This forecast is fueled by the expansion of IBC-connected blockchains, rising DeFi integrations within the Cosmos ecosystem, and improved scalability through ongoing upgrades, supporting steady growth while broader market consolidation limits sharp breakouts.
Cosmos Price Prediction 2027
The price of Cosmos (ATOM) is predicted to reach a minimum level of $9.45 in 2027, with a maximum of $10.66 and an average of $9.70. This projection is driven by increasing adoption of interchain solutions, stronger validator participation, and the expansion of cross-chain DeFi projects, which enhance network utility and long-term token value.
Cosmos Price Prediction 2028
The price of Cosmos (ATOM) is predicted to reach a minimum value of $13.75 in 2028, with a maximum of $16.43 and an average trading price of $14.23. This anticipated rise is supported by broader adoption of interchain communication, expansion of Cosmos-based projects, and institutional interest in interoperable blockchain infrastructure driving sustained demand and ecosystem growth.
Cosmos price forecast 2029
Cosmos price is forecast to reach a lowest possible level of $19.52 in 2029. As per findings, the ATOM price could reach a maximum possible level of $23.72 with the average forecast price of $20.09. This growth is expected as interchain adoption accelerates globally, with more blockchains leveraging Cosmos’s IBC technology and modular SDK framework, boosting utility and network value while institutional participation strengthens long-term demand.
Cosmos Price Prediction 2030
The price of Cosmos (ATOM) is predicted to reach a minimum value of $28.38 in 2030, with a maximum of $33.53 and an average trading price of $29.18. This projection is driven by Cosmos’s evolution into a core hub for blockchain interoperability, which is expected to strengthen long-term ecosystem value and price stability.
Cosmos Price Prediction 2031
As per the forecast and technical analysis, in 2031 the price of Cosmos (ATOM) is expected to reach a minimum of $42.19, a maximum of $49.81, and an average of $43.65. This bullish outlook is supported by Cosmos’s full-scale interoperability, increased institutional adoption, and its position as a foundational layer for interconnected blockchains, driving sustained demand and long-term value appreciation.
Cosmos price prediction: Analysts’ ATOM price forecast
| Firm Name | 2025 | 2026 |
| Coincodex | $ 2.58 | $2.56 |
| DigitalCoinPrice | $5.66 | $ 6.47 |
Cryptopolitan’s Cosmos price prediction
According to Cryptopolitan’s price prediction for Cosmos (ATOM) in 2025, the cryptocurrency is projected to exhibit a price range from a potential low of $3.64 to a high of $8.93.
Cosmos historic price sentiment
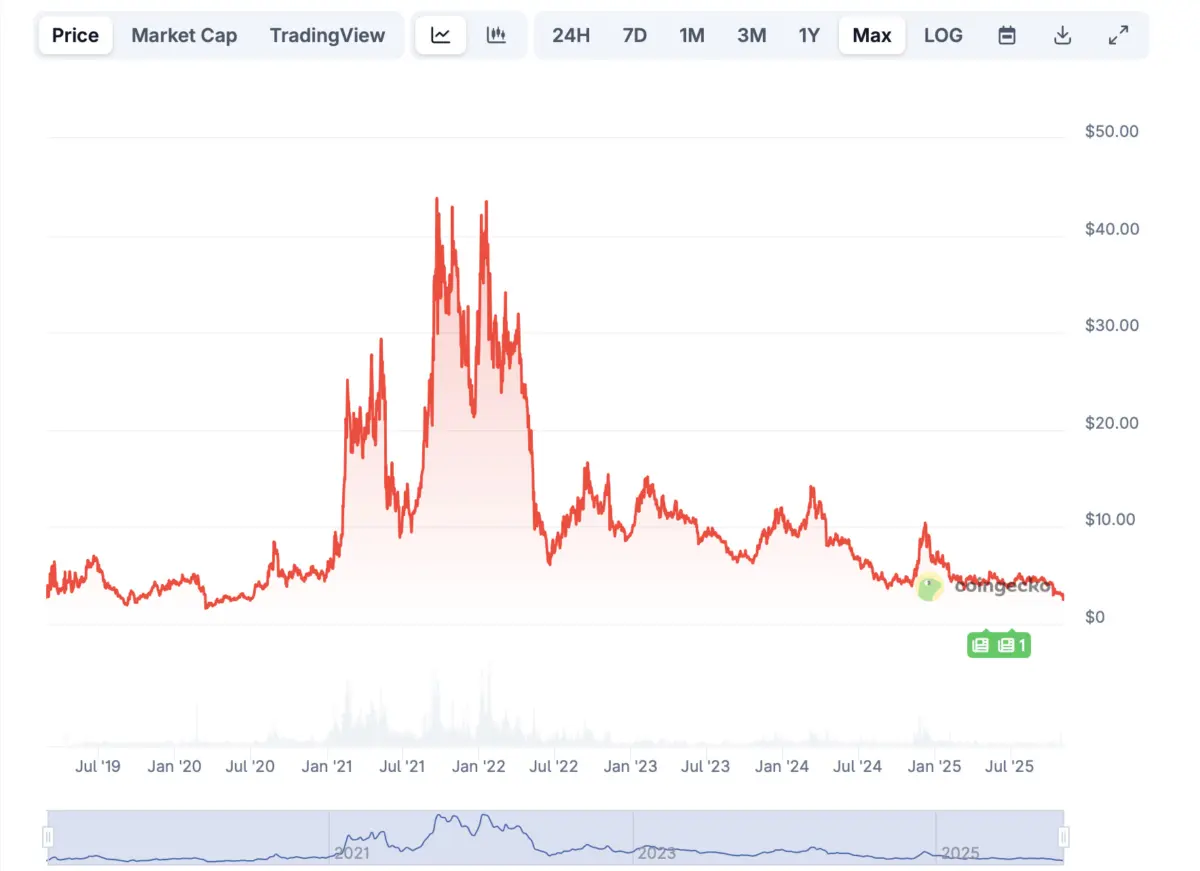
- Cosmos launched after its 2017 ICO and mainnet release in 2019, reaching a peak of $44 during the 2021 bull market.
- After April 2022, ATOM entered a long consolidation phase, mostly trading between $6 and $16.
- Throughout 2024, the price weakened further, dropping to the $4–$6 range and reaching lows near $4 as bearish sentiment grew.
- Early 2025 saw continued volatility, with ATOM fluctuating mostly between $4 and $5 despite brief rebounds.
- From July to September 2025, ATOM traded narrowly between $4.30–$4.70, showing limited momentum and ongoing market indecision.
- ATOM was trading around $4.40–$4.70, but bearish pressure pushed the price downward as broader market sentiment weakened.
- The price declined further, moving into the $4.00–$4.30 range, with repeated failed attempts to break above resistance.
- From the beginning of November, ATOM continued to trade sideways between $3.90–$4.20, showing low momentum, weak buyer strength, and consolidation near support levels.
