


Key takeaways:
-
Long-term investors have been selling 45,000 ETH daily, increasing sell-side pressure.
-
Ether’s 50-week EMA and bear flag breakdown target $2,500.
Ether’s (ETH) drop toward $3,000 on Friday was preceded by a significant amount of offloads from long-term holders, which some analysts said may lead to a deeper price correction.
Long-term holders are offloading
Ether long-term holders, entities holding ETH (ETH) for more than 155 days, have intensified their sell-side activity as the price dropped below key support levels.
Analyzing ETH spent volume by age, using a 90-day moving average, Glassnode analysts said that 45,000 ETH, worth about $140 million, is leaving three-to-10-year holder wallets daily.
Related: Ether’s chance of turning bullish before 2025 ends depends on 4 critical factors
Glassnode wrote:
“This marks the highest spending level by seasoned investors since February 2021.”
This aligns with a surge in spot Ethereum exchange-traded funds (ETF) outflows, which further suppresses ETH price. These investment products recorded $259 million in net outflows on Thursday, marking their worst day since Oct. 10, according to data from SoSoValue.
This marked the fourth consecutive day of outflows for the Ethereum ETFs, as the end of the 43-day US government shutdown failed to reignite investor appetite.
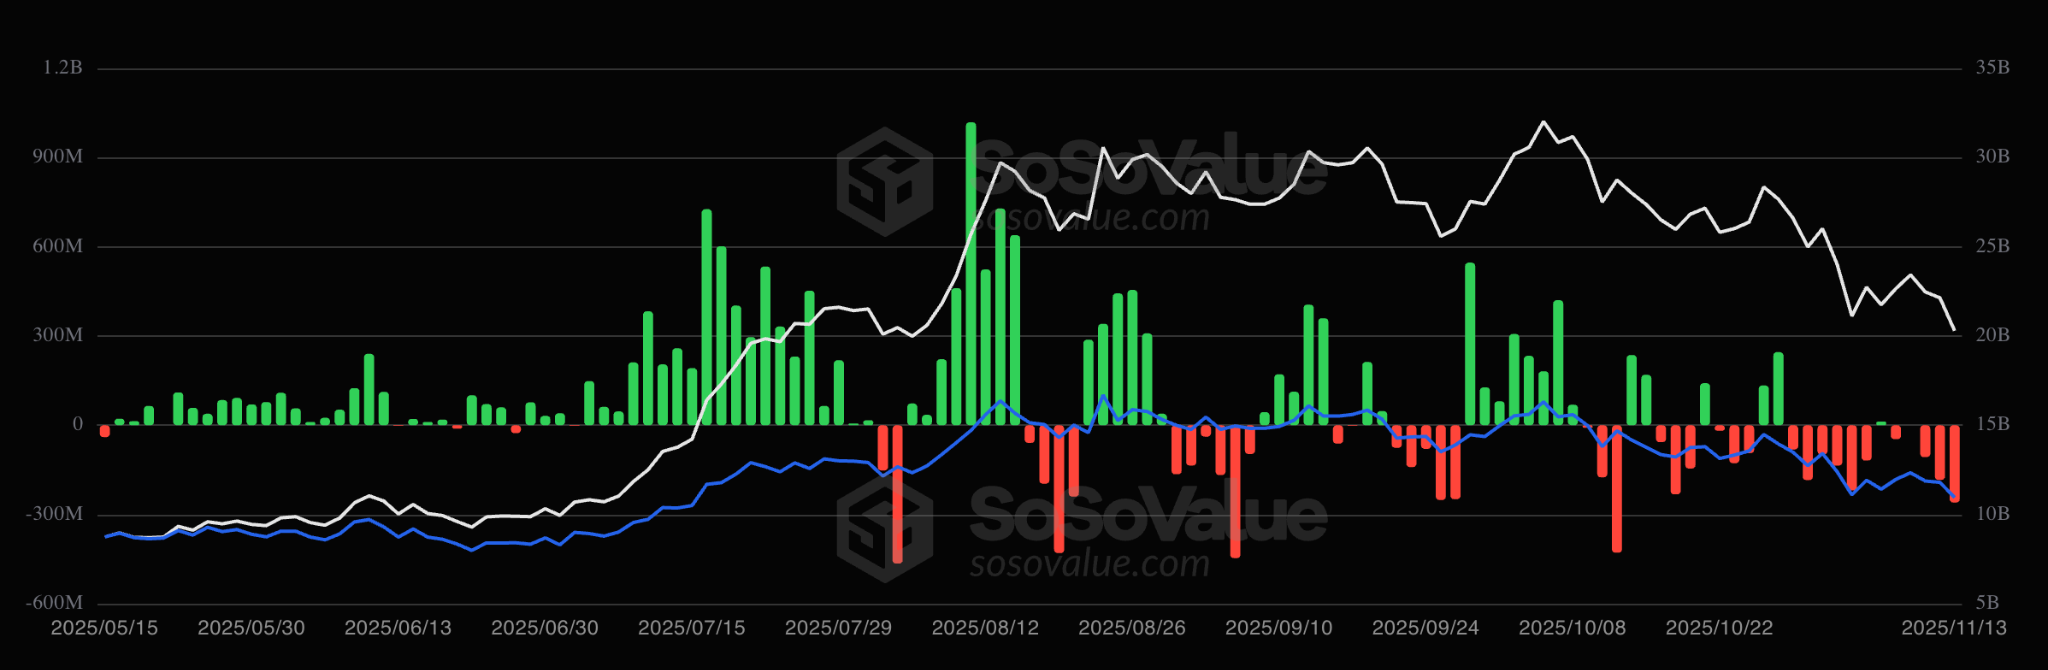
A cumulative net outflow of $1.42 billion from Ethereum ETFs since early November signals strong institutional selling pressure, fueling fears of a deeper correction.
Ethereum onchain data signals waning demand
Onchain activity over the last seven days paints a worrying picture. While Ethereum continues to lead its competitors, securing roughly 56% of the market’s total value locked (TVL), this metric has dropped by 21% over the last 30 days, according to DefiLlama.
Even more concerning is the decline in network fees, reflecting waning demand for blockspace, which reinforces Ether’s price weakness around $3,000.
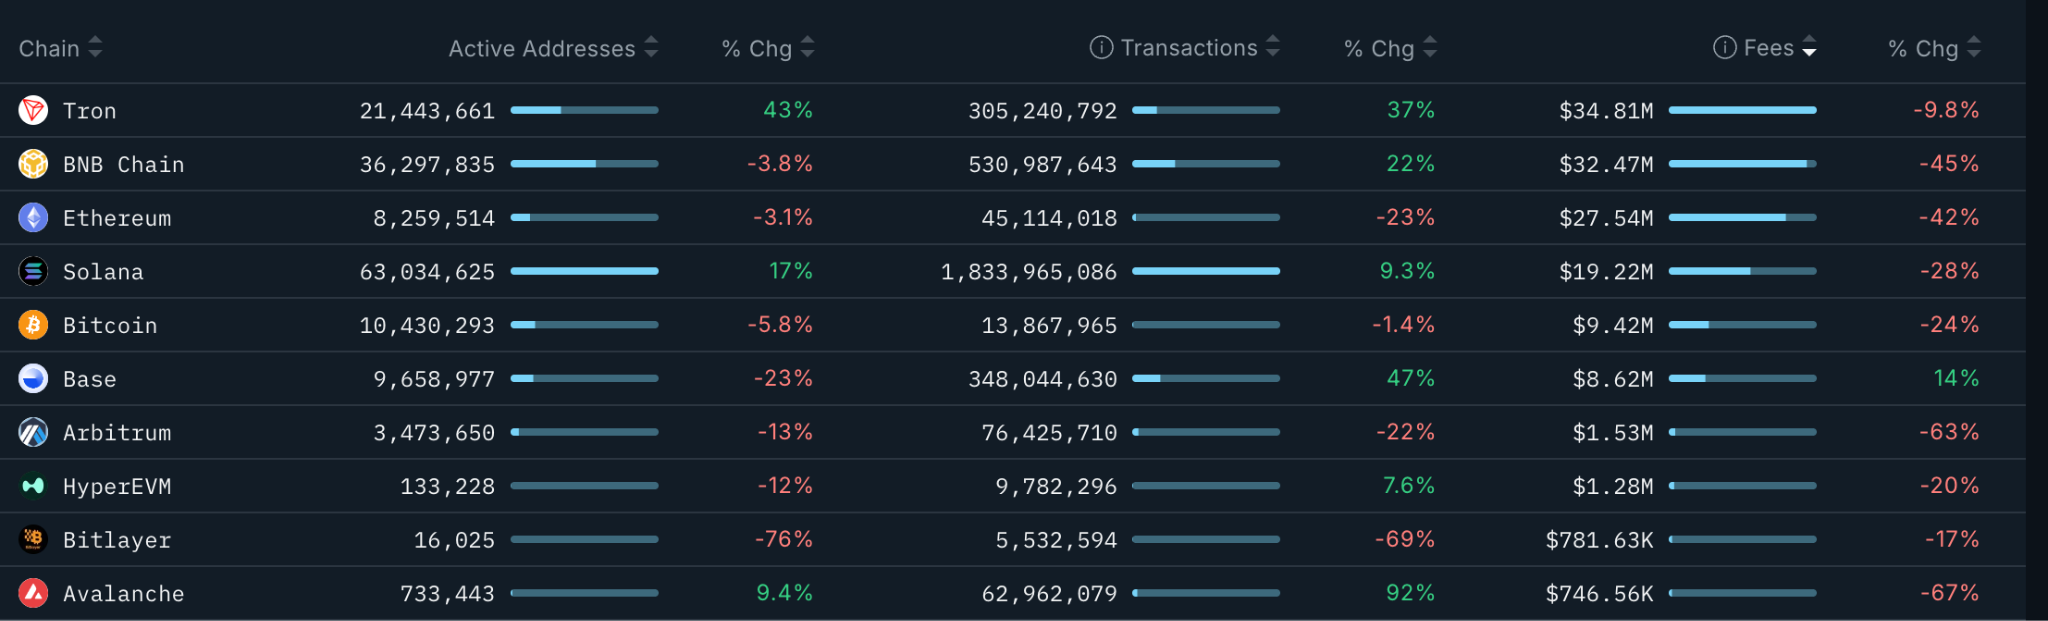
Ethereum’s fees over the past 30 days dropped to $27.54 million on Friday, representing a 42% decrease. Solana’s fees declined just 9.8% while BNB Chain revenue dropped by 45%, reinforcing the bearishness in the market.
This may continue to pressure Ether’s price in the coming weeks, particularly when coupled with rising market fear, which has returned to levels last seen during the sell-off led by US President Donald Trump’s tariff announcements in April.
ETH price bear flag targets $2,500
Many analysts warn that the current downtrend could accelerate unless a clear bullish shift occurs, possibly adding pressure on day traders and small holders.
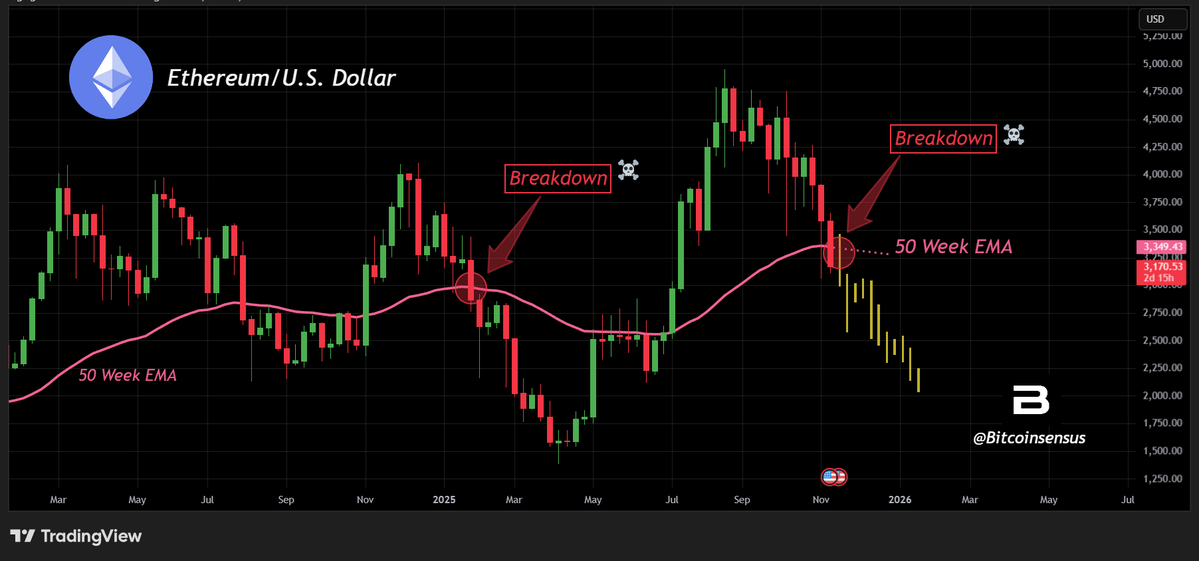
“Ethereum loses the 50-week EMA, a key macro support,” said analyst Bitcoinsensus in a Friday X post, referring to the $3,350 level.
Past breakdowns triggered major downside moves, with the last one resulting in a 60% drop to $1,380 from $3,400 between late January and early April.
Bitcoinsensus added:
“Trend remains bearish unless price reclaims this level fast.”
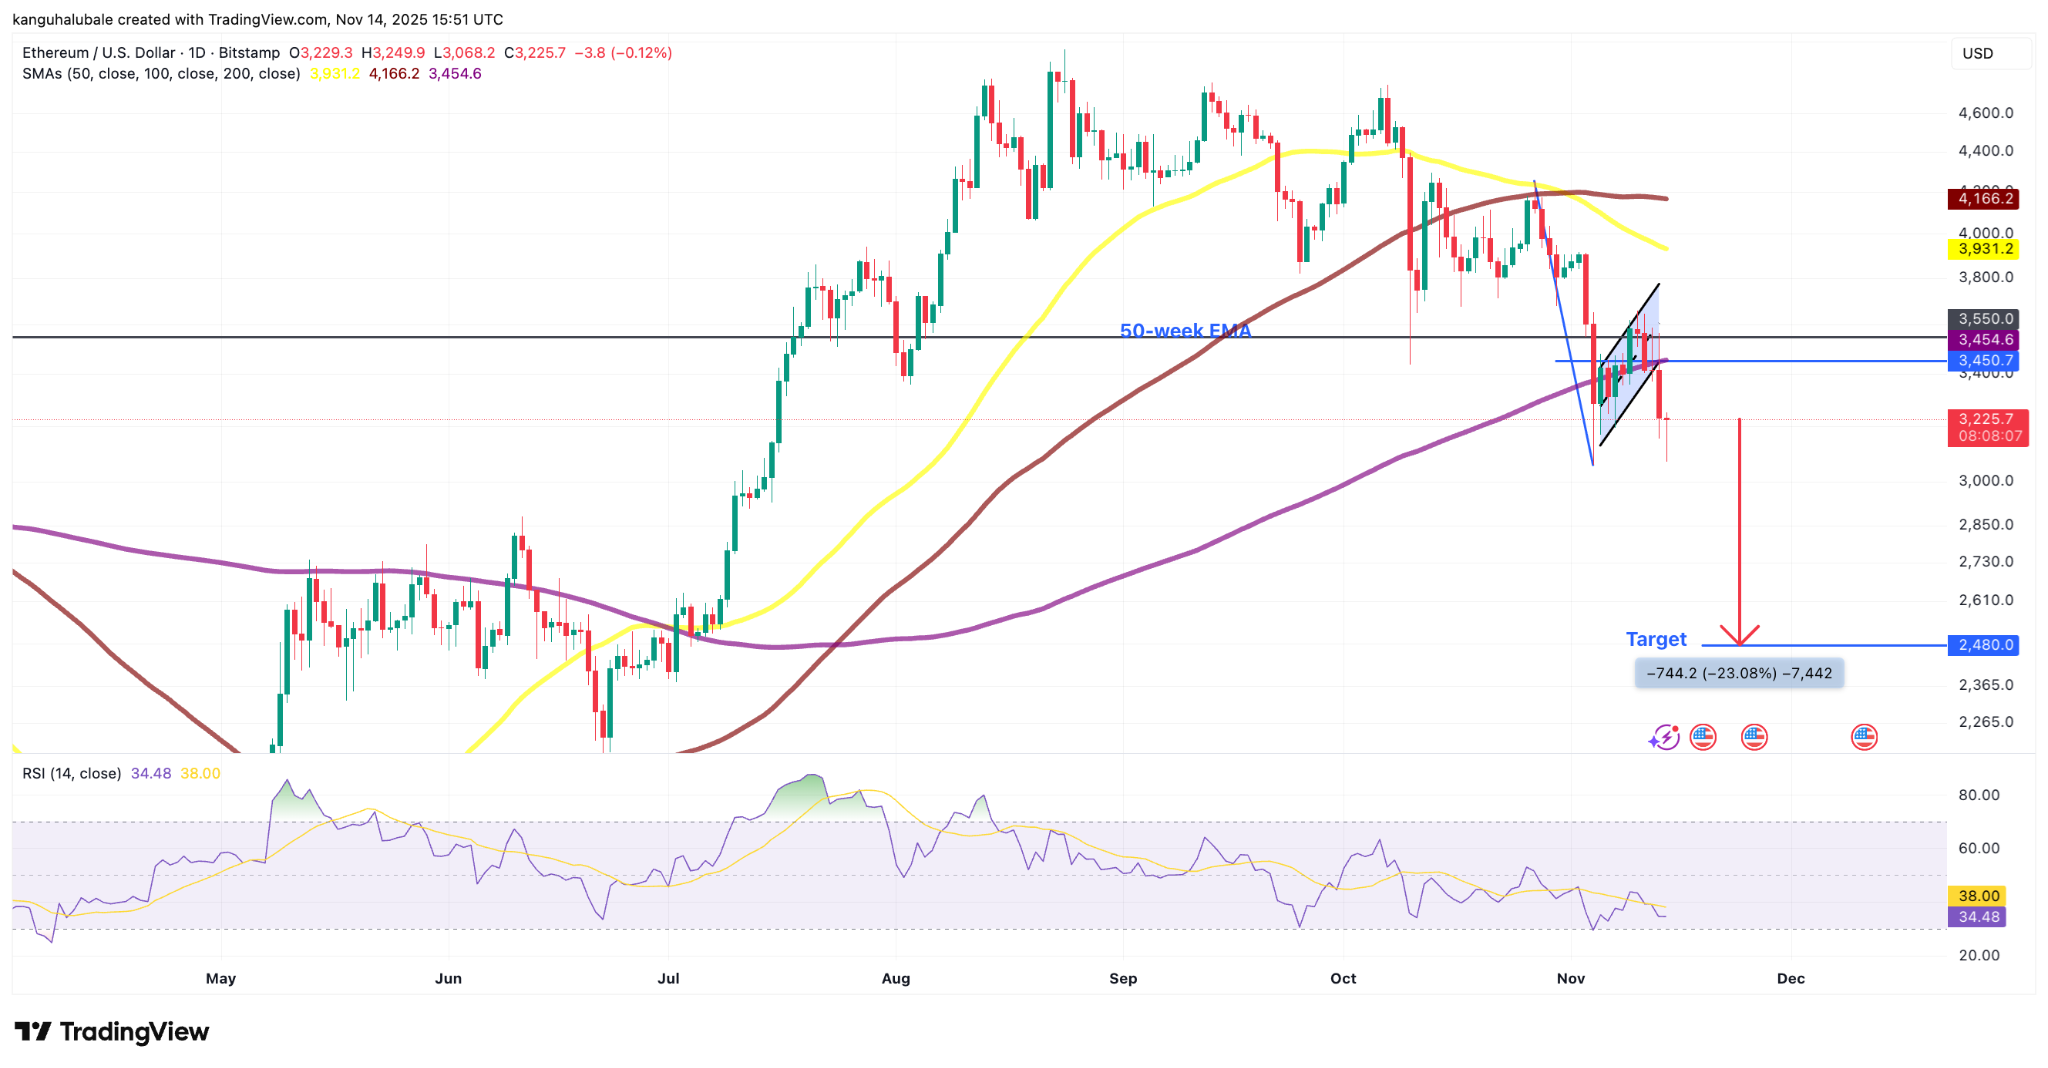
Ether’s price action in the daily time frame has validated a bear flag once it broke below $3,450, coinciding with the 200-day SMA and the lower boundary of a bear flag.
The next major support sits at the $3,000 psychological level, which bulls must defend aggressively.
Losing this level would clear the way for a fresh downward leg toward the measured target of the pattern at $2,280, or a 23% drop from the current level.
As Cointelegraph reported, $3,000 remains a key support zone for the ETH/USD pair, and holding it is crucial to avoiding further losses.
This article does not contain investment advice or recommendations. Every investment and trading move involves risk, and readers should conduct their own research when making a decision.
