


Key takeaways:
-
The spot Solana ETFs have recorded inflows for 13 consecutive days.
-
SOL broke its multi-year uptrend, slipping below a key moving average.
Spot Solana (SOL) exchange-traded funds continued to attract investor interest, recording their thirteenth straight day of inflows, underscoring institutional demand for the network’s native asset.
According to data from SoSoValue, Solana ETFs added $1.49 million on Thursday, bringing cumulative inflows to $370 million and total assets to over $533 million. The Bitwise Solana ETF (BSOL) was the only one that recorded inflows on Thursday, marking the weakest since its launch on Oct. 28.
The weakening SOL ETF inflows reflected the bearish sentiment across the market, with spot Bitcoin (BTC) ETFs recording $866 million in daily net outflows on the same day, the second-worst day since launch.
Spot Ether (ETH) ETFs also posted $259.2 million in outflows, reducing their cumulative inflows to $13.3 billion. The funds shed $183.7 million on Thursday and $107.1 million on Wednesday.
Related: SOL traders’ every wish came true, except for new all-time highs: What gives?
The persistent demand for Solana ETFs has, however, failed to hold SOL above key levels, with the technical setup indicating a potential for a deeper correction.
SOL price breaks key support levels
In line with the waning ETF inflows, SOL’s price action turned sharply bearish last week, falling over 34% over the last two weeks to $142 on Friday, its lowest level since June 23. The correction also broke a 100-week SMA and the multiyear uptrend that began in January 2023, with the $95 level serving as the yearly low.
Solana is currently testing a daily order block around $140, a level with limited support, according to data from Glassnode.
Glassnode’s UTXO realized price distribution (URPD) — a metric that shows the average prices at which SOL holders bought their coins — reveals that there is little clustering of these buy levels below $140. This means there are a few holders who are defending the price there.
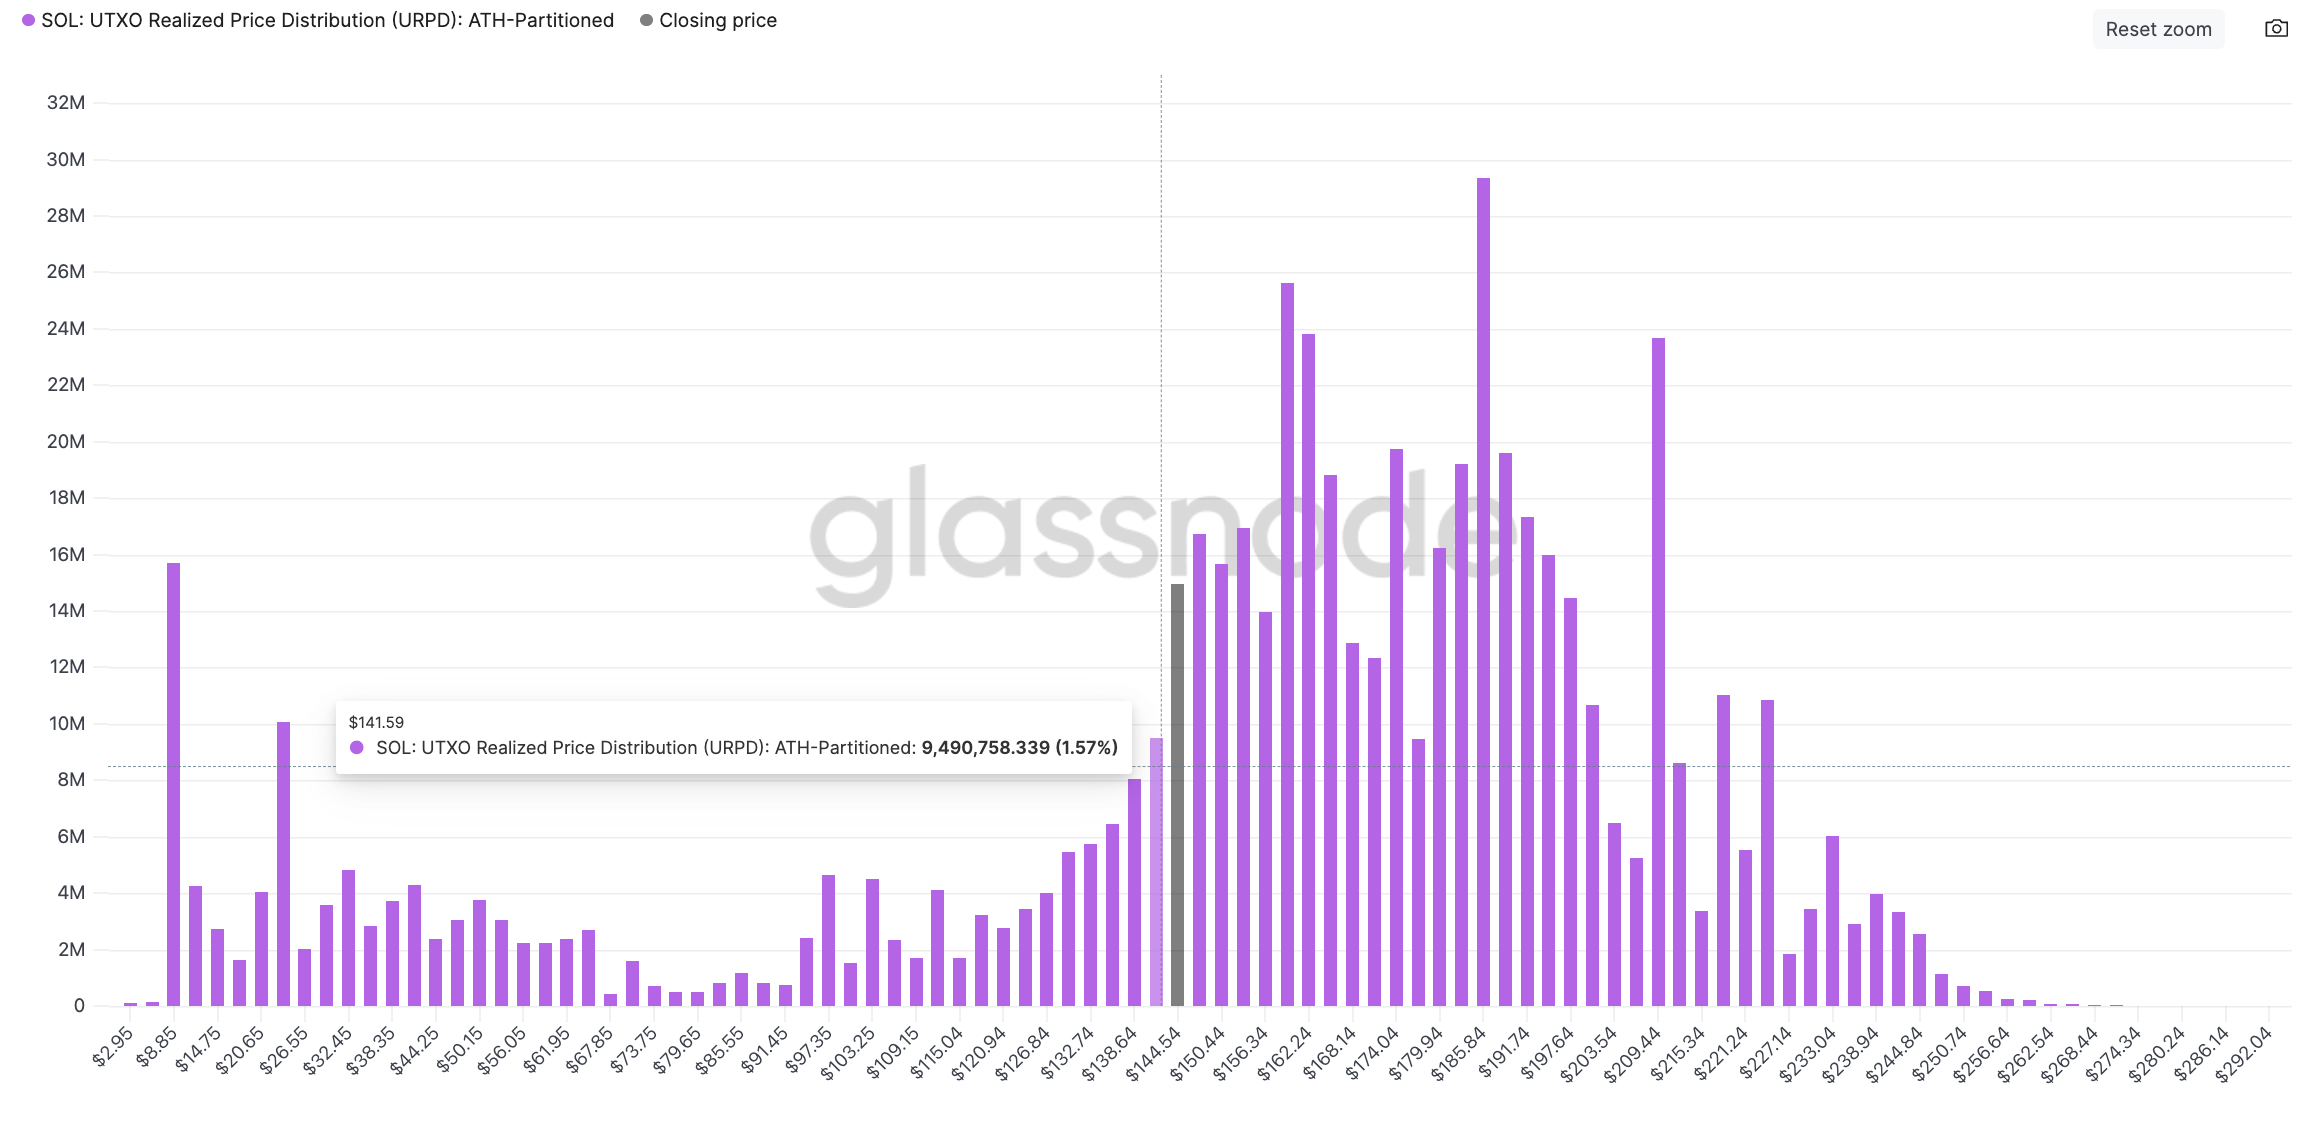
If the price breaks below this level, it could drop toward the 200-week SMA at $100, which represents the last line of defense for SOL price.
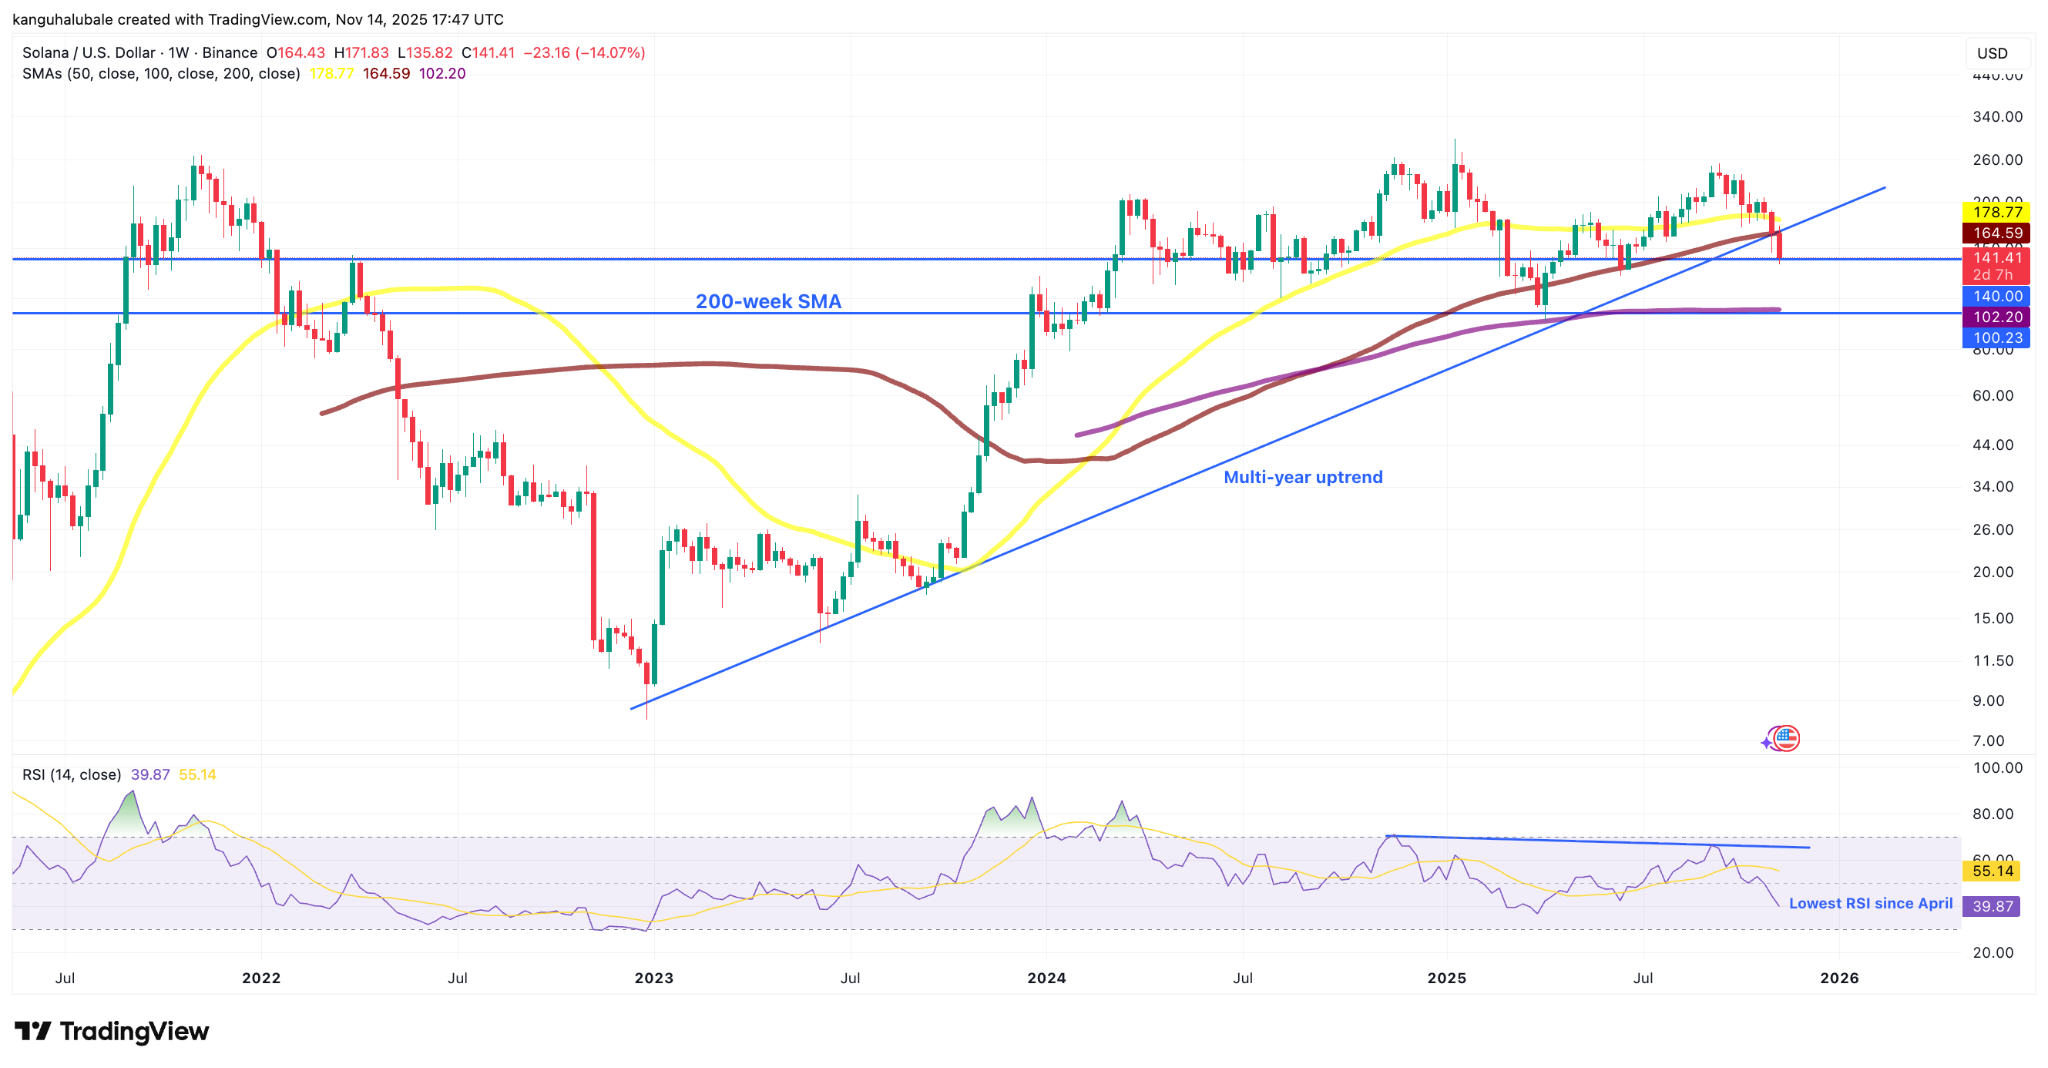
Solana’s downside is backed by weakness in the relative strength index, which has hit its lowest level since April 2025.
As Cointelegraph reported, a break below $150 will see the SOL/USDT pair extend the decline to $126 and subsequently to the solid support at $100.
This article does not contain investment advice or recommendations. Every investment and trading move involves risk, and readers should conduct their own research when making a decision.
