


Key takeaways:
-
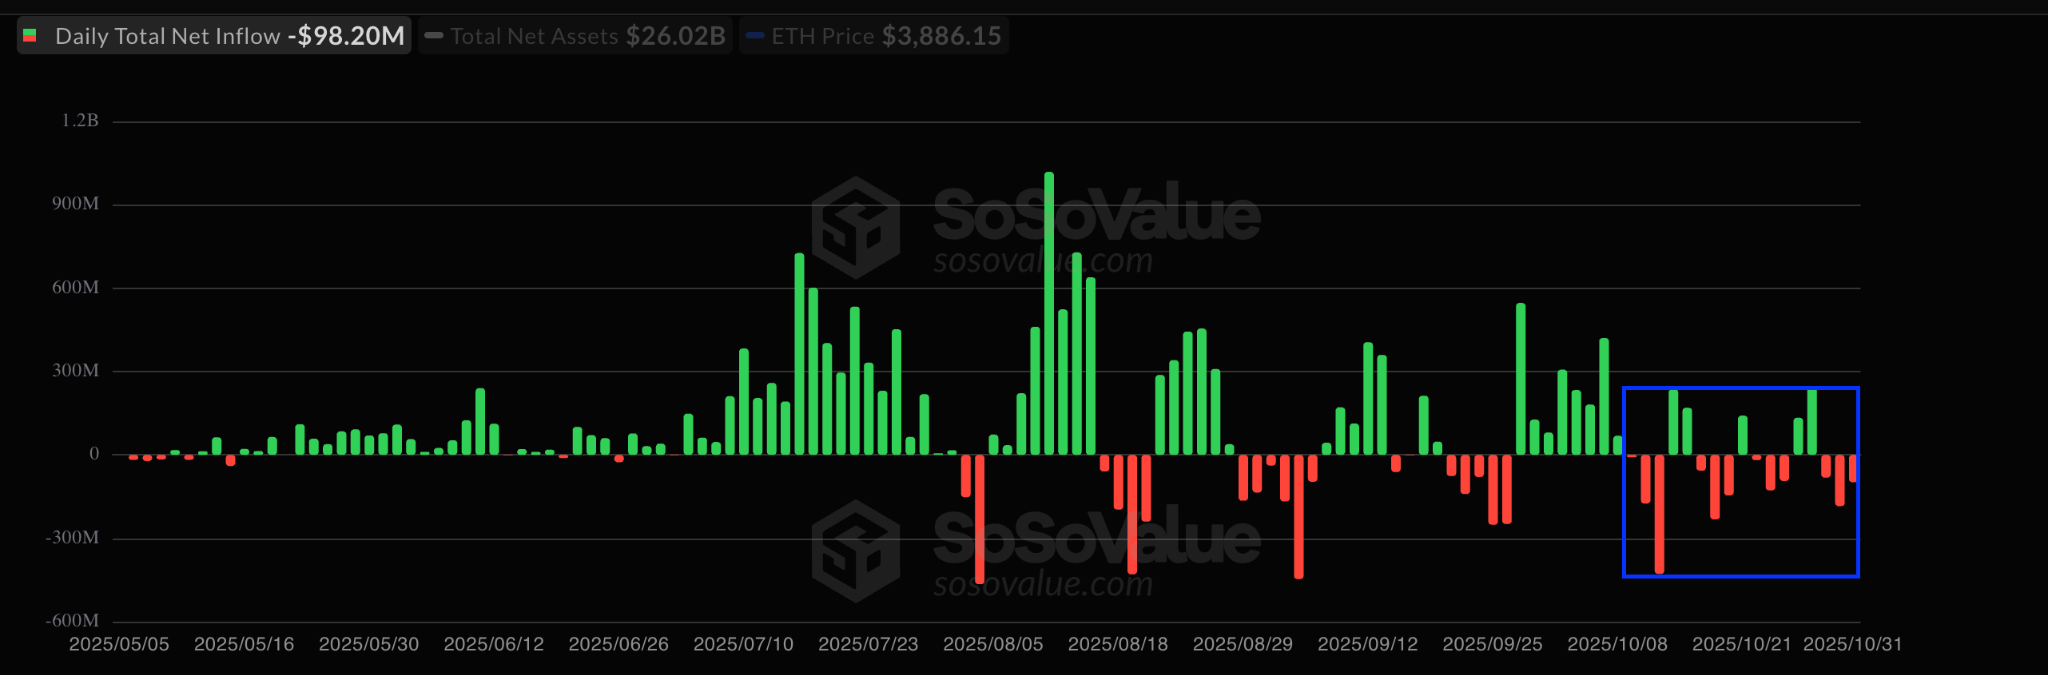
Ethereum ETFs experienced outflows for three consecutive days, totaling $364 million.
-
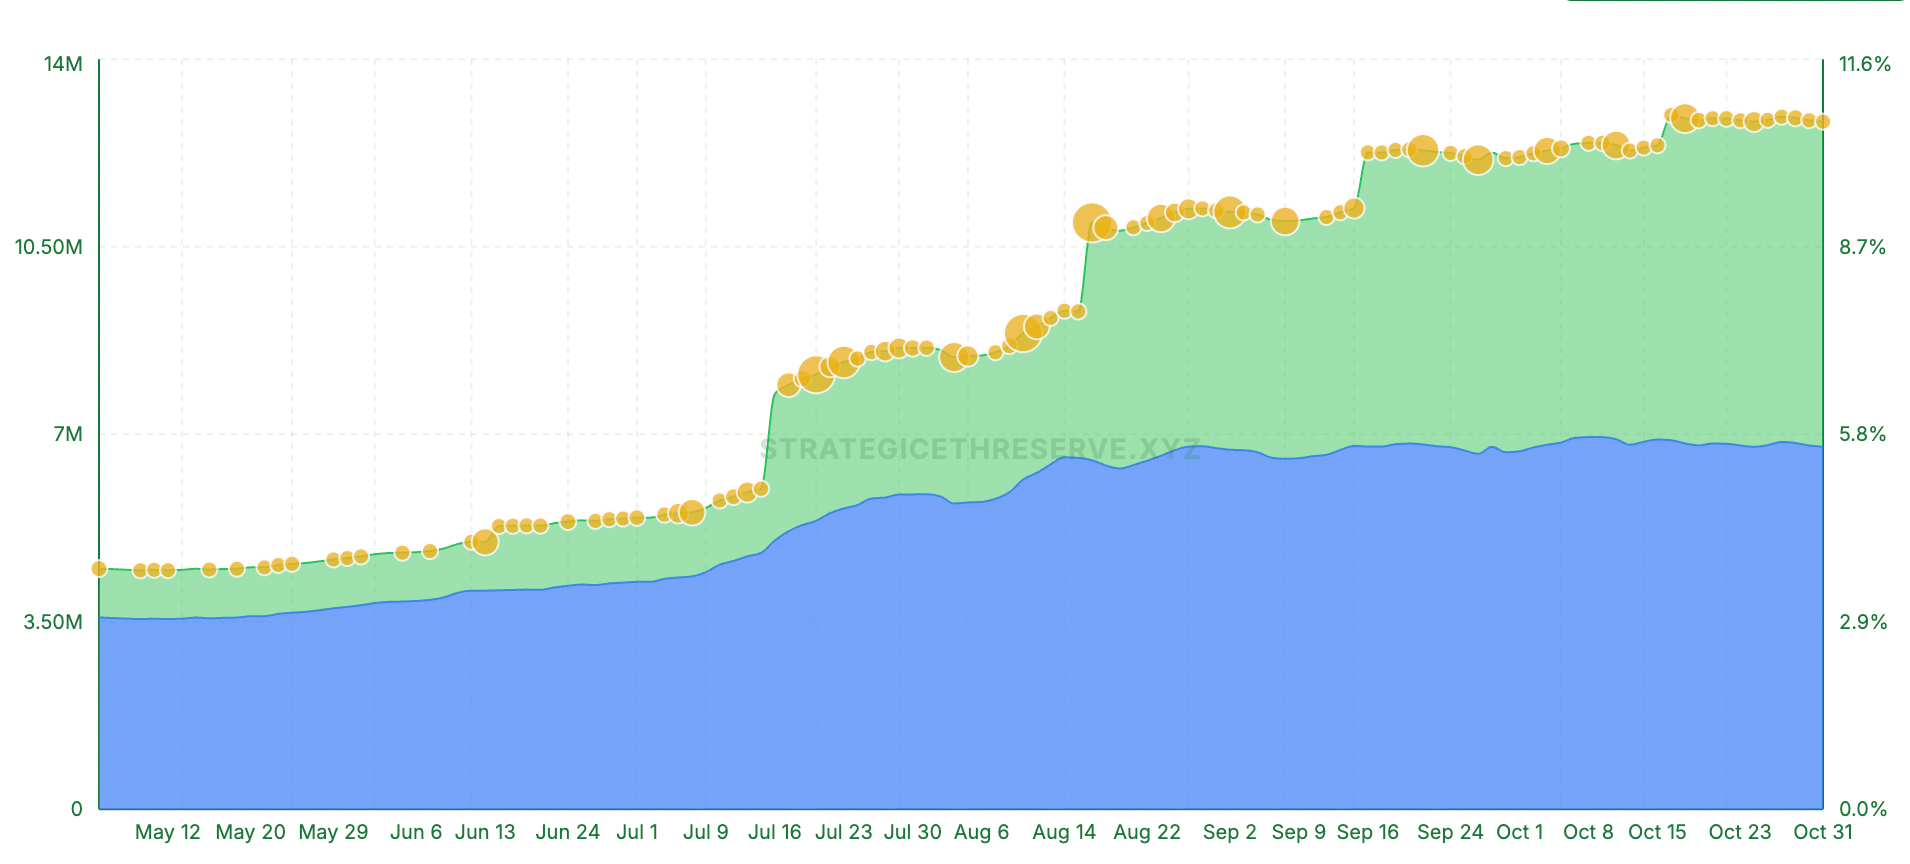
Strategic Ether reserves and ETF holdings have dropped by 124,060 ETH since mid-October.
-
Ether’s descending triangle is in play on the eight-hour chart, targeting $2,870 ETH price.
Ether (ETH) fell 14% over the past 30 days, dropping below $4,000 to trade at $3,724 on Monday. However, technical and ETF data are not showing much bullishness, increasing the odds of a further correction below $3,000.
Waning institutional demand pulls down ETH price
The decrease in Ether’s price can be attributed to investors’ de-risking behavior, which is visible across the spot Ethereum exchange-traded funds (ETFs). Traders have been withdrawing capital from these investment products over the last two weeks.
Related: ETFs will usher institutions into altcoins, just like Bitcoin: Analyst
US-based spot Ether ETFs have recorded a streak of outflows over the past three days, totaling $363.8 million, according to data from SoSoValue.
As Cointelegraph reported, the four-day inflow streak into the new US-based spot Solana ETFs implies continued capital rotation from Bitcoin and Ether funds.
Data from StrategicETHreserve.xyz indicates that collective holdings of strategic reserves and ETFs have dropped by 124,060 ETH since Oct. 16.
The decrease highlights a drop in demand among major institutional and corporate players.
“Ethereum treasury companies are still going down,” with BitMine being the only meaningful buyer, said analyst Ted Pillows in a Monday X post, adding, “I don’t think it’ll continue for long.”
With price going down, “treasury companies will soon run out of money to buy $ETH,” the analyst wrote, adding:
“Until these stocks recover, I don’t see a possibility of ETH price recovery.”
Descending triangle projects a 22% drop
Since Oct. 7, the ETH price has been forming a descending triangle pattern on its eight-hour chart, characterized by a flat support level mixed with a downward-sloping resistance line.
A descending triangle chart pattern that forms after a strong uptrend is seen as a bearish reversal indicator. As a rule, the setup resolves when the price breaks below the flat support level and falls by as much as the triangle’s maximum height.
“ETH has broken below the descending triangle pattern and is currently testing the breakdown level,” said analyst CryptoBull_360 in an X post on Monday, adding:
“If the retest of the breakdown level is successful, it confirms that the downtrend will continue.”
The measured target of the triangle is $2,870, or a 22% drop from current price levels.
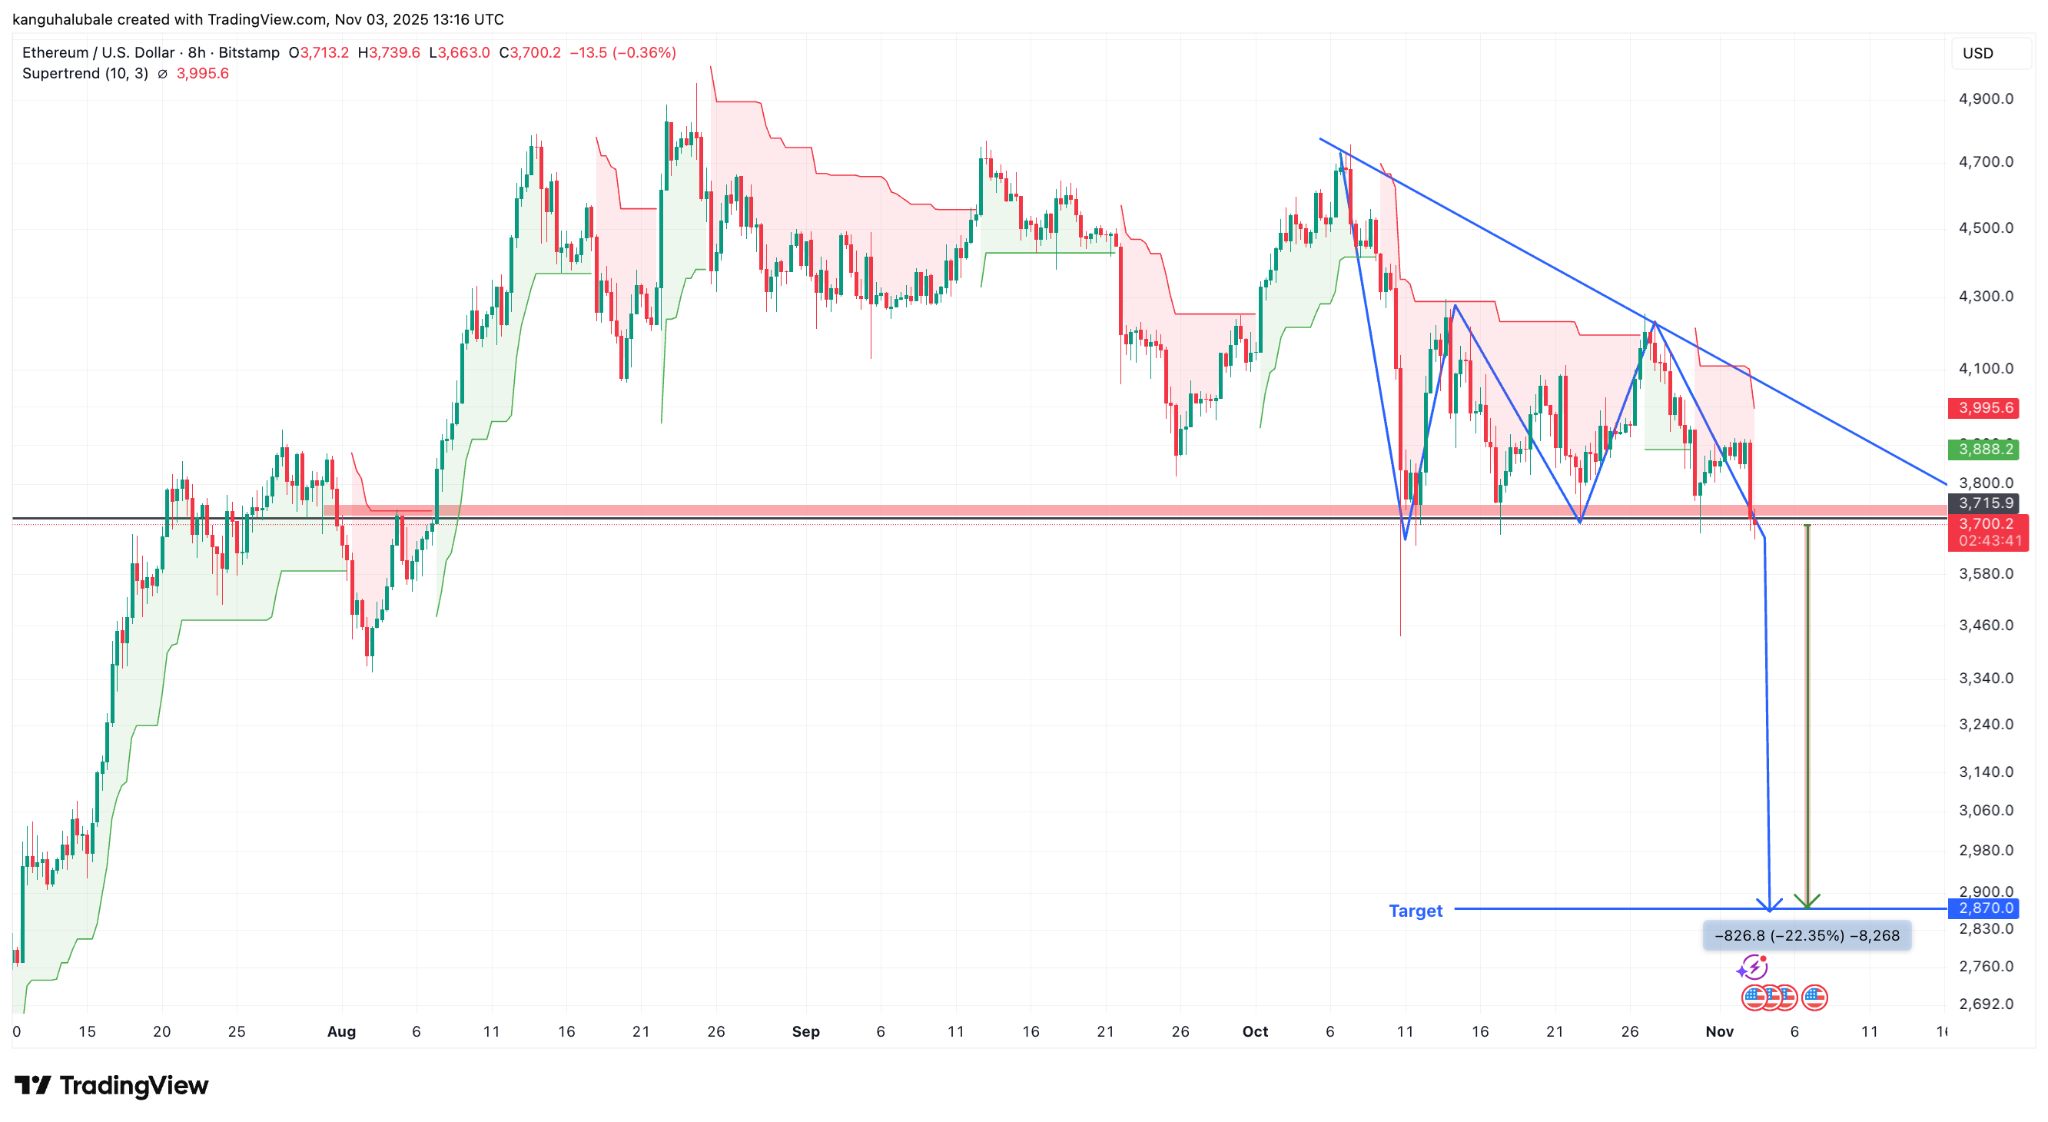
Adding to Ether’s downside is the SuperTrend indicator, which flashed a bearish signal when it reversed from green to red and moved above the price on Thursday.
This indicator overlays the chart while tracking the ETH price trend, like the moving averages. It incorporates the average true range in its calculations, which helps traders identify market trends.
The most recent sell signal from this indicator came on Oct. 7 and was followed by a 22% drop in price to $3,700 from $4,750.
Pillows said that ETH price is at a “crucial support zone” around $3,700, adding that a deeper drop to $3,500 was possible if $4,000 is not quickly reclaimed.
As Cointelegraph reported, the ETH/USD pair may drop to $3,350 if the support level at $3,700 is breached.
This article does not contain investment advice or recommendations. Every investment and trading move involves risk, and readers should conduct their own research when making a decision.
