


Key takeaways:
-
Declining spot buying and mounting spot Ethereum ETF outflows signal weak demand, risking further losses for Ether.
-
Ether’s bear flag projects a 20% price drop to $3,100.
Ether (ETH) fell to $3,800 on Tuesday, failing to hold $4,000 as spot Ethereum ETF investors continued their net redemptions. This came as the technical setup pointed to a deeper correction for ETH price.
Ether price faces “strong resistance” at $4,000
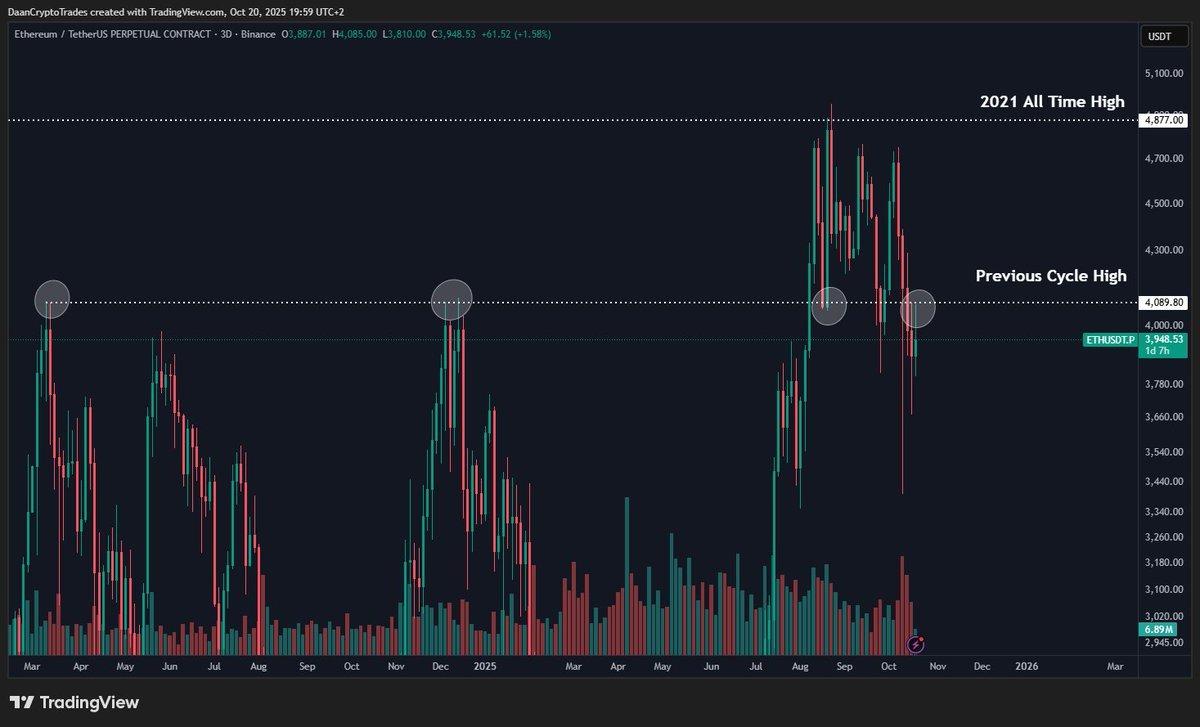
Ether’s 16% recovery from a $3,500 low reached on Oct. 11 was curtailed by selling around the $4,000 psychological barrier.
This showed that “there is a strong resistance at $4K,” said trader Philakone in an X post on Monday.
Related: BitMine’s Lee says Ether’s ‘price dislocation’ is a signal to buy
Note that the last time the ETH/USD pair was rejected from this zone was in December 2024, before a 66% price drop, as shown in the chart below.
Bulls must, therefore, push and sustain the price above $4,000 to secure the recovery.
“This has been a hard level to break for the bulls and is pretty critical in the short/mid term going forward,” said analyst Daan Crypto Trades in a recent X post.
A decisive daily candlestick close above this level will get ETH “back into the previous price range and leave these lows behind,” the analyst wrote, adding:
“It’s going to be an interesting battle around that ~$4.1K level.”
This level “defines whether this pullback becomes a deeper correction or a brief reset, said fellow analyst Jas Crypto, adding:
“If bulls defend $4K, momentum could rebuild toward $5K.”
As Cointelegraph reported, bulls will have to drive the Ether price above the $4,000-$4,300 supply zone to signal the start of a new uptrend.
Lack of new buyers keeps ETH below $4,000
Ether’s ability to hold above $4,000 appears limited for now due to the absence of buyers.
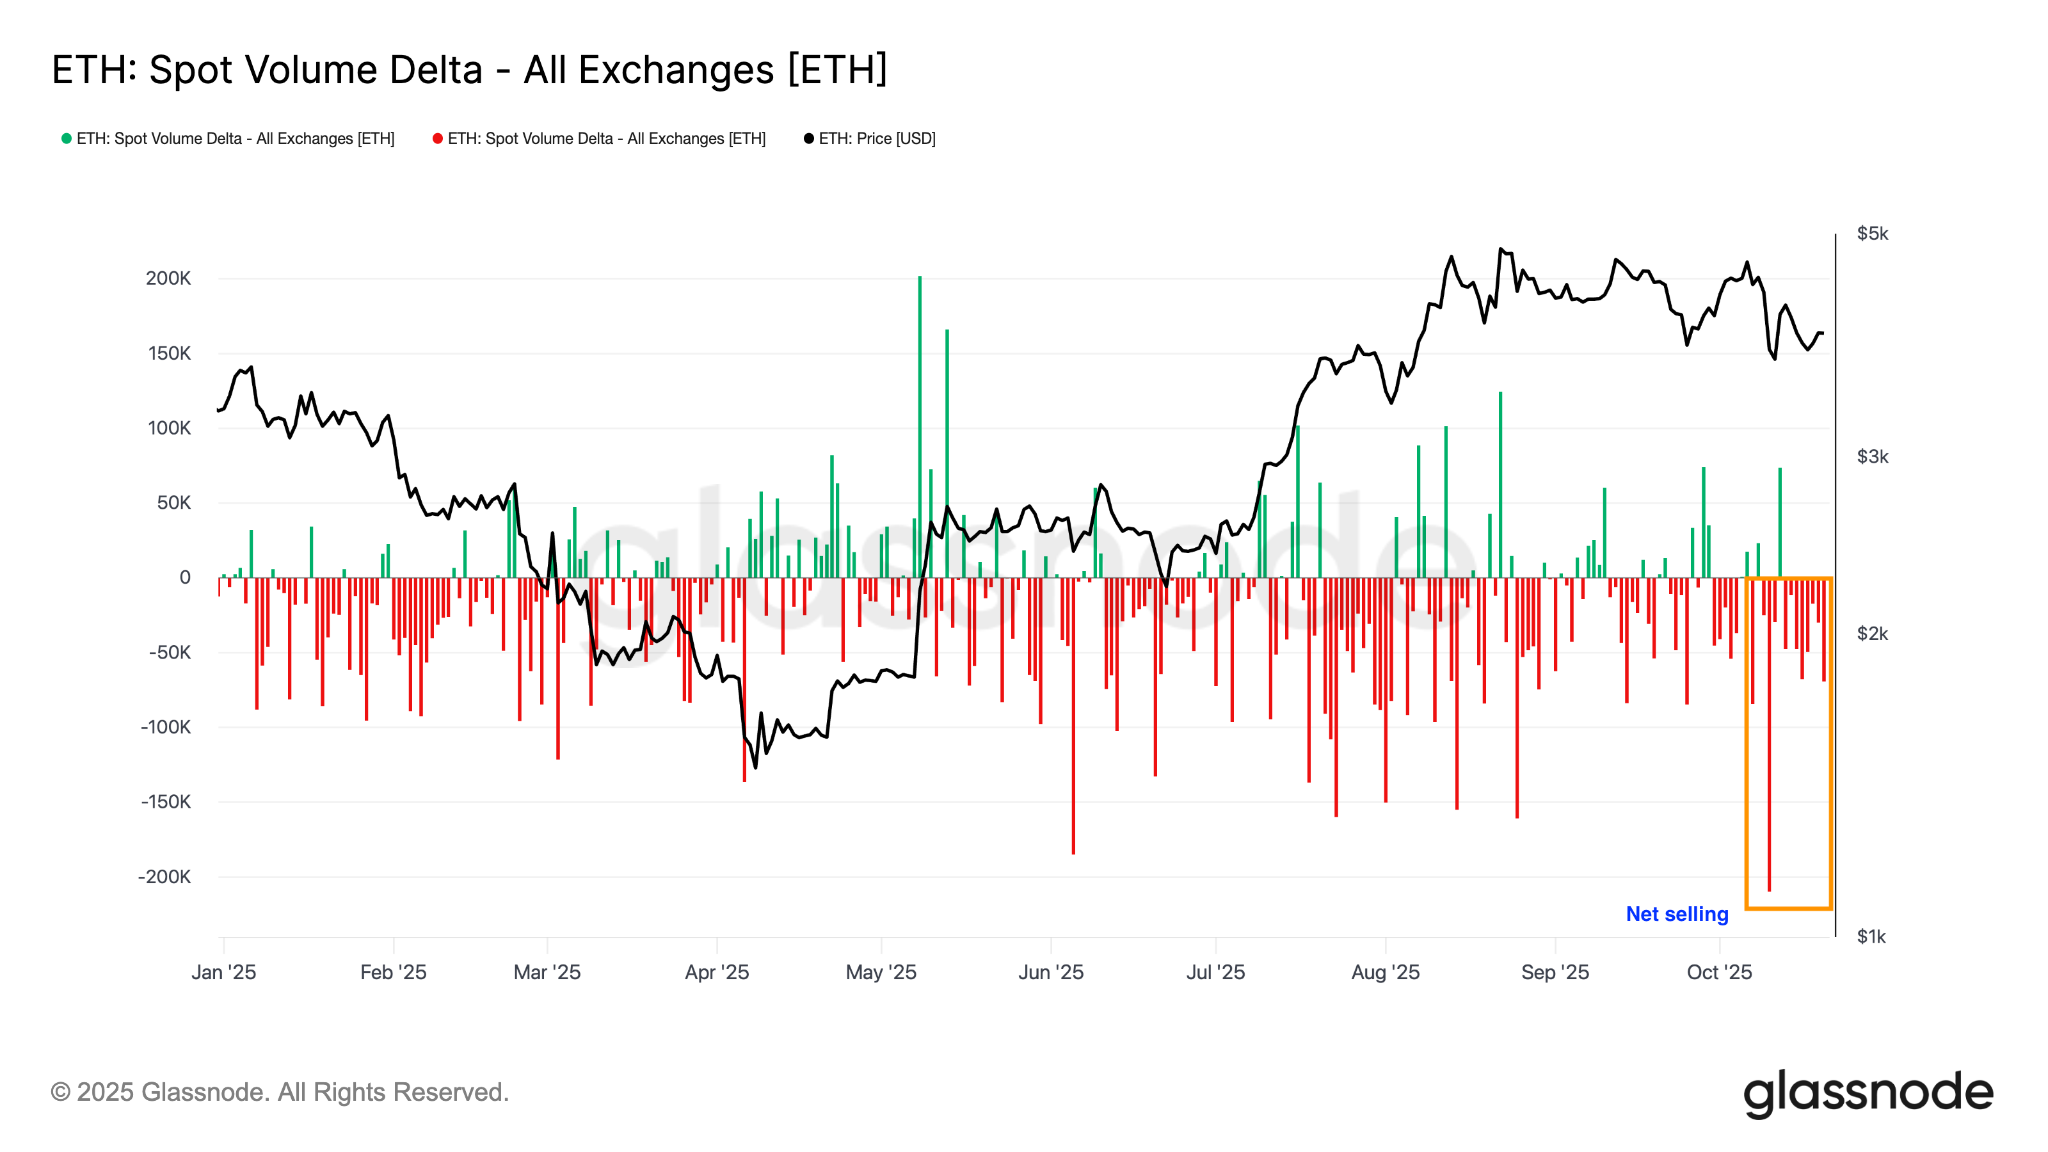
The spot volume delta metric, an indicator that measures the net difference between buying and selling trade volumes, reveals that net spot buying on exchanges remains negative, despite the recent attempts at recovery.
This suggests that a price rebound may lack the momentum derived from consistent buying pressure, potentially leading to a deeper pullback.
Without real demand, any breakout attempt might lack the strength required to push ETH above key levels.
Demand for spot Ethereum ETFs has also been decreasing, with these investment products posting outflows six out of the last eight days, data from SoSoValue showed.
Monday alone saw Ether ETFs shed $145.7 million, bringing total net outflows over the past eight days to $640.5 million.
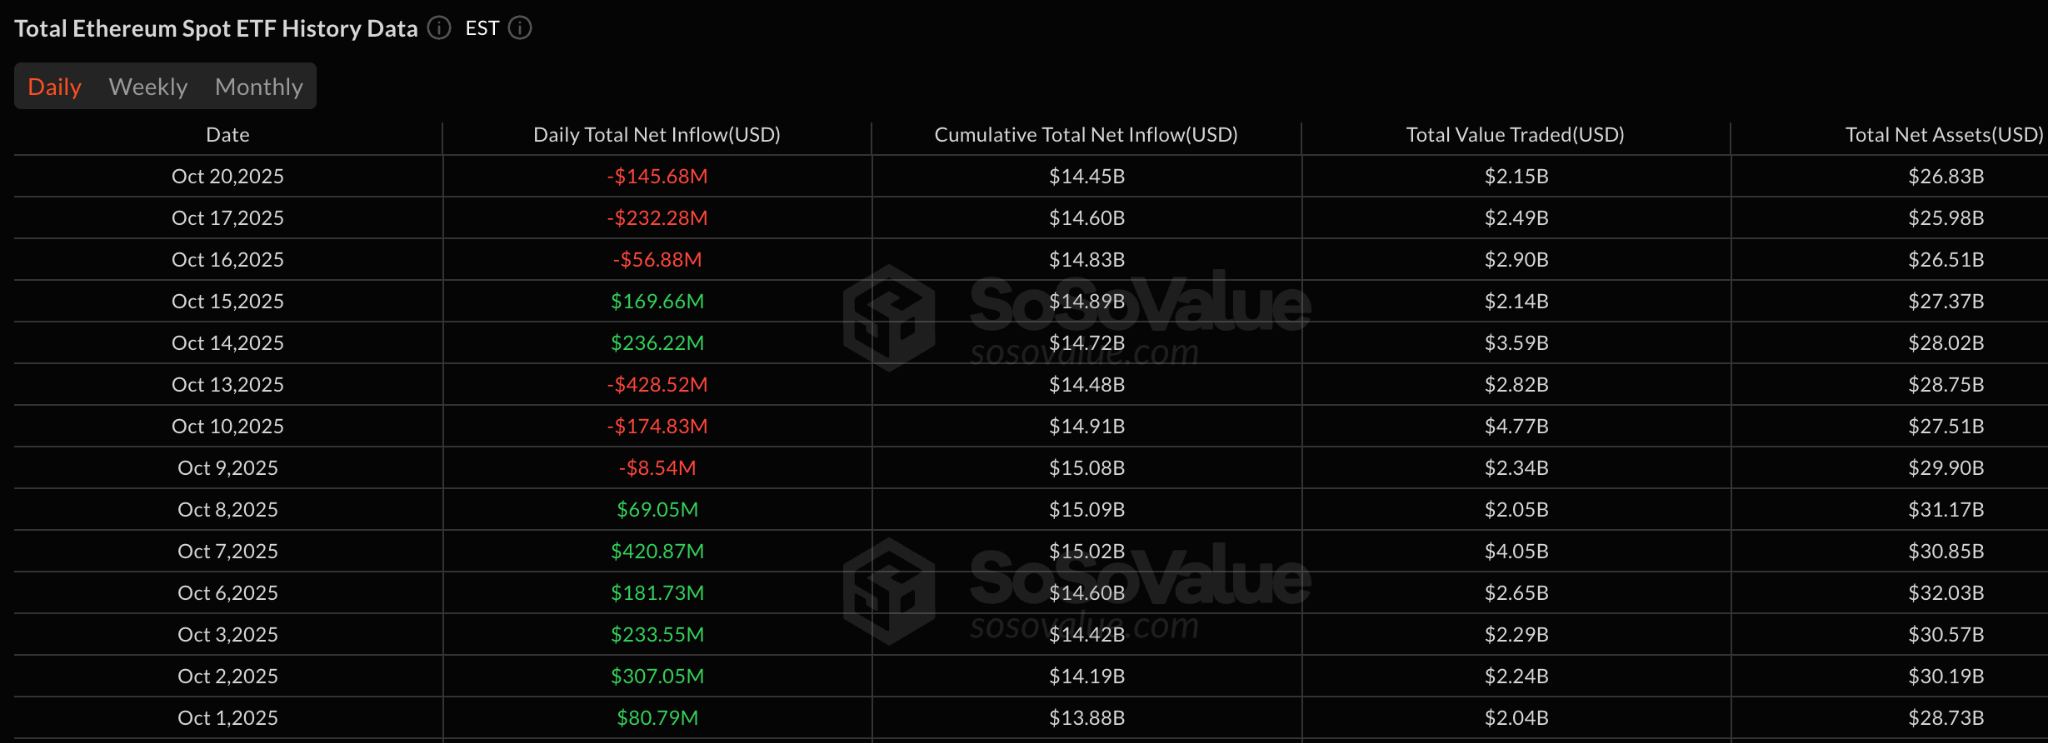
ETF inflows must return and new ETH buyers must step in for the bulls to have a shot at getting back to $5,000.
Ether’s bear flag breakdown targets $3,100
ETH price is expected to resume its prevailing bearish momentum after the confirmation of a classic bearish pattern.
Ether’s price action over the past 14 days has led to the formation of a bear flag pattern on the 12-hour chart, as shown in the figure below. The price dropped below the lower boundary of the flag at $4,000 on Tuesday, signaling the start of a significant breakdown.
The measured target from the flagpole’s height comes to be around $3,120, about a 20% drop from the current price.
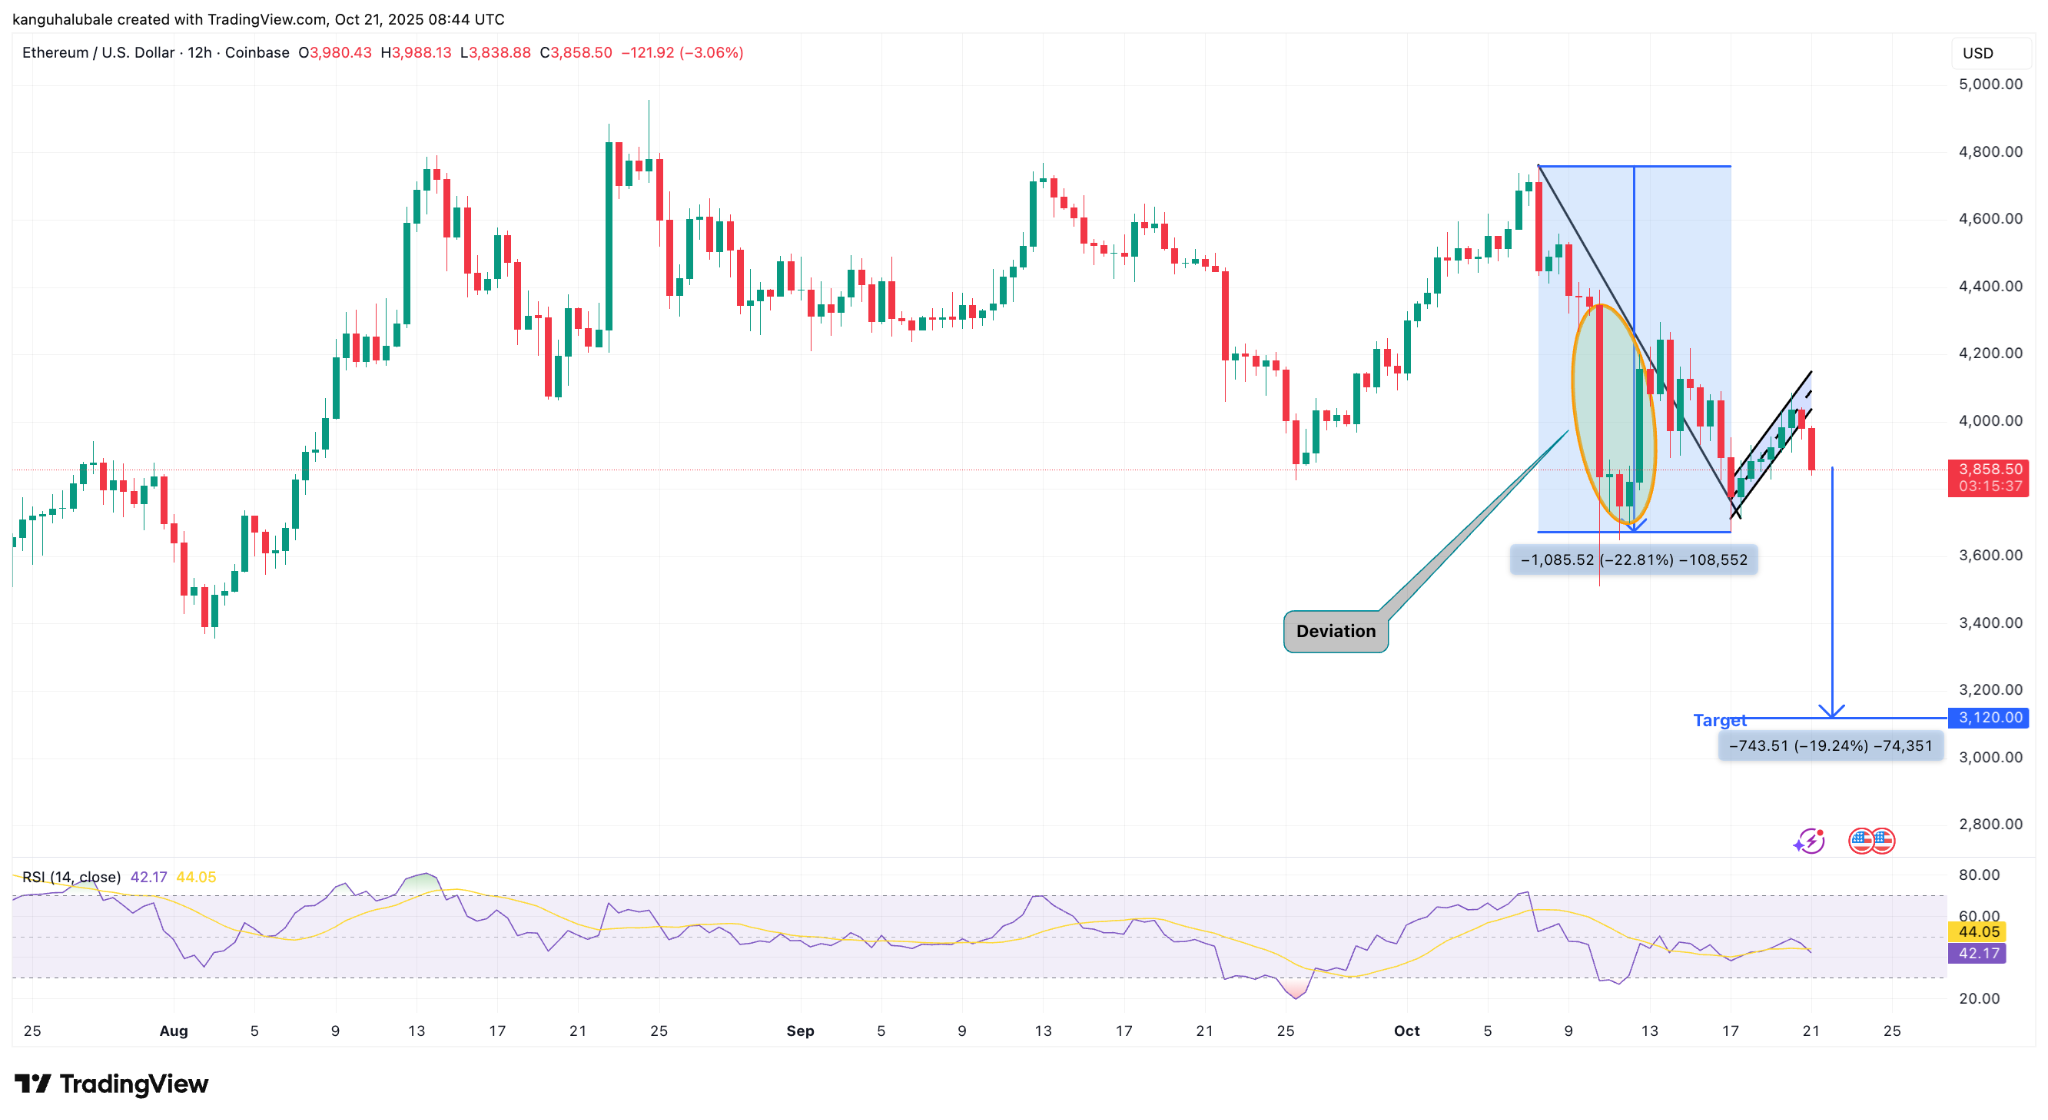
The relative strength index is still below the 50 mark, suggesting that market conditions still favor the downside.
Despite this bearish outlook, traders remain optimistic about Ether’s upside potential, citing bullish signals from credit conditions and persistent buying by Ethereum treasury companies.
Analyst Jelle said that Ether is just retesting a key breakout level around $4,000 before resuming its uptrend.
“This looks very ready for a rapid expansion higher.”
Judging from sentiment on CT, you’d think $ETH was in the gutter – but it’s just holding the breakout area as support.
This looks very ready for a rapid expansion higher.
Shakeouts are working, it seems. pic.twitter.com/IUpfnpf5VQ
— Jelle (@CryptoJelleNL) October 15, 2025
This article does not contain investment advice or recommendations. Every investment and trading move involves risk, and readers should conduct their own research when making a decision.
