


Key takeaways:
Zcash (ZEC) has soared over 520% in the past month, even defying the broader crypto sell-off that wiped out $20 billion in leveraged positions over the weekend.
The privacy coin’s surge brought it within striking distance of the $300 level, a price not seen since December 2021, positioning ZEC among the market’s standout performers.
Can ZEC’s price rise any further from its current levels, or is a cooldown overdue?
ZEC technicals hint at another 25% rally
Zcash’s explosive uptrend appears to be consolidating within a classic bull flag pattern, a continuation setup that typically precedes another leg higher.
The latest candle on the four-hour chart has formed a gravestone Doji near the upper trendline resistance, suggesting a possible short-term pullback toward the flag’s lower boundary around $237.
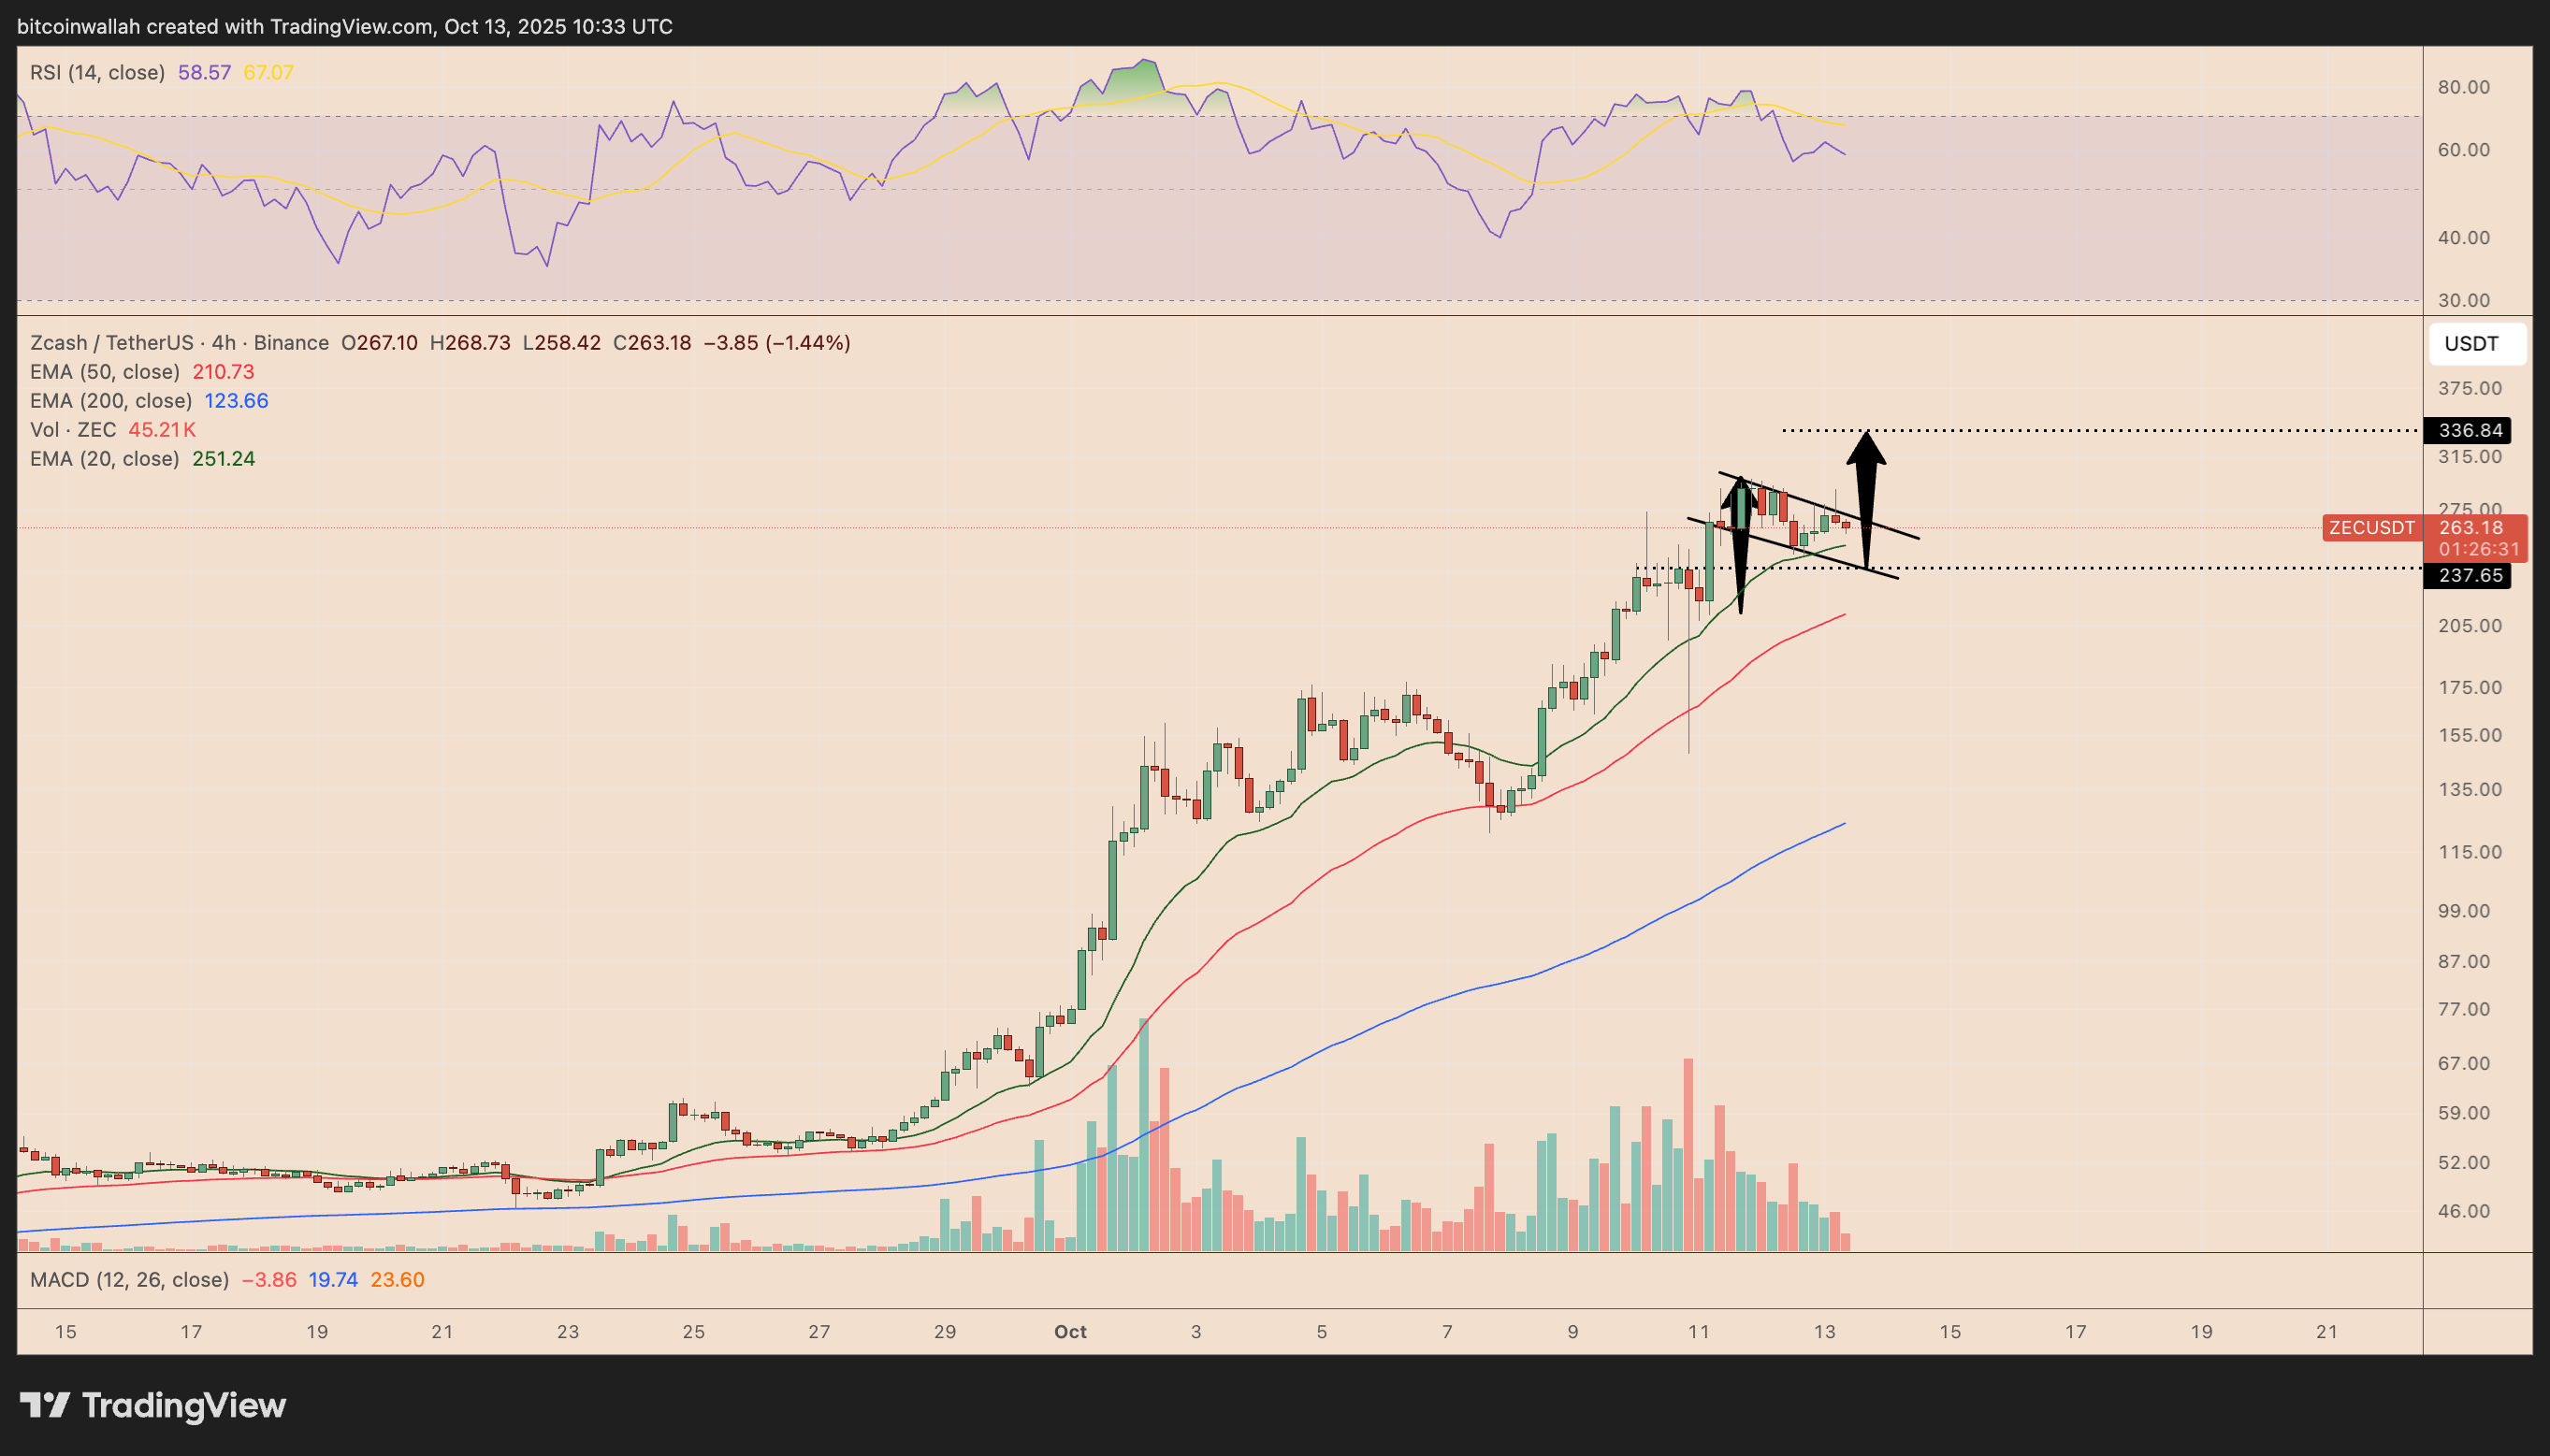
ZEC could confirm a bullish breakout if buyers push the price above the flag’s upper trendline. Such a move would establish a technical price target for October near $336, about 25% higher than current levels.
The setup further aligns with healthy consolidation above the 20-period (green) and 50-period (red) exponential moving averages (EMA), indicating that the broader bullish momentum remains intact despite signs of short-term overheating.
Bearish scenario includes $210 ZEC price
The ZEC price plunging between the supports, i.e., the flag’s lower trendline and the 20-period EMA, increases the odds of a decline toward the 50-period EMA at around $210.75 in October.
About $5.36 million in cumulative long liquidations stacked near the $244 level makes it a key risk zone for the bulls, as the CoinGlass chart below shows.
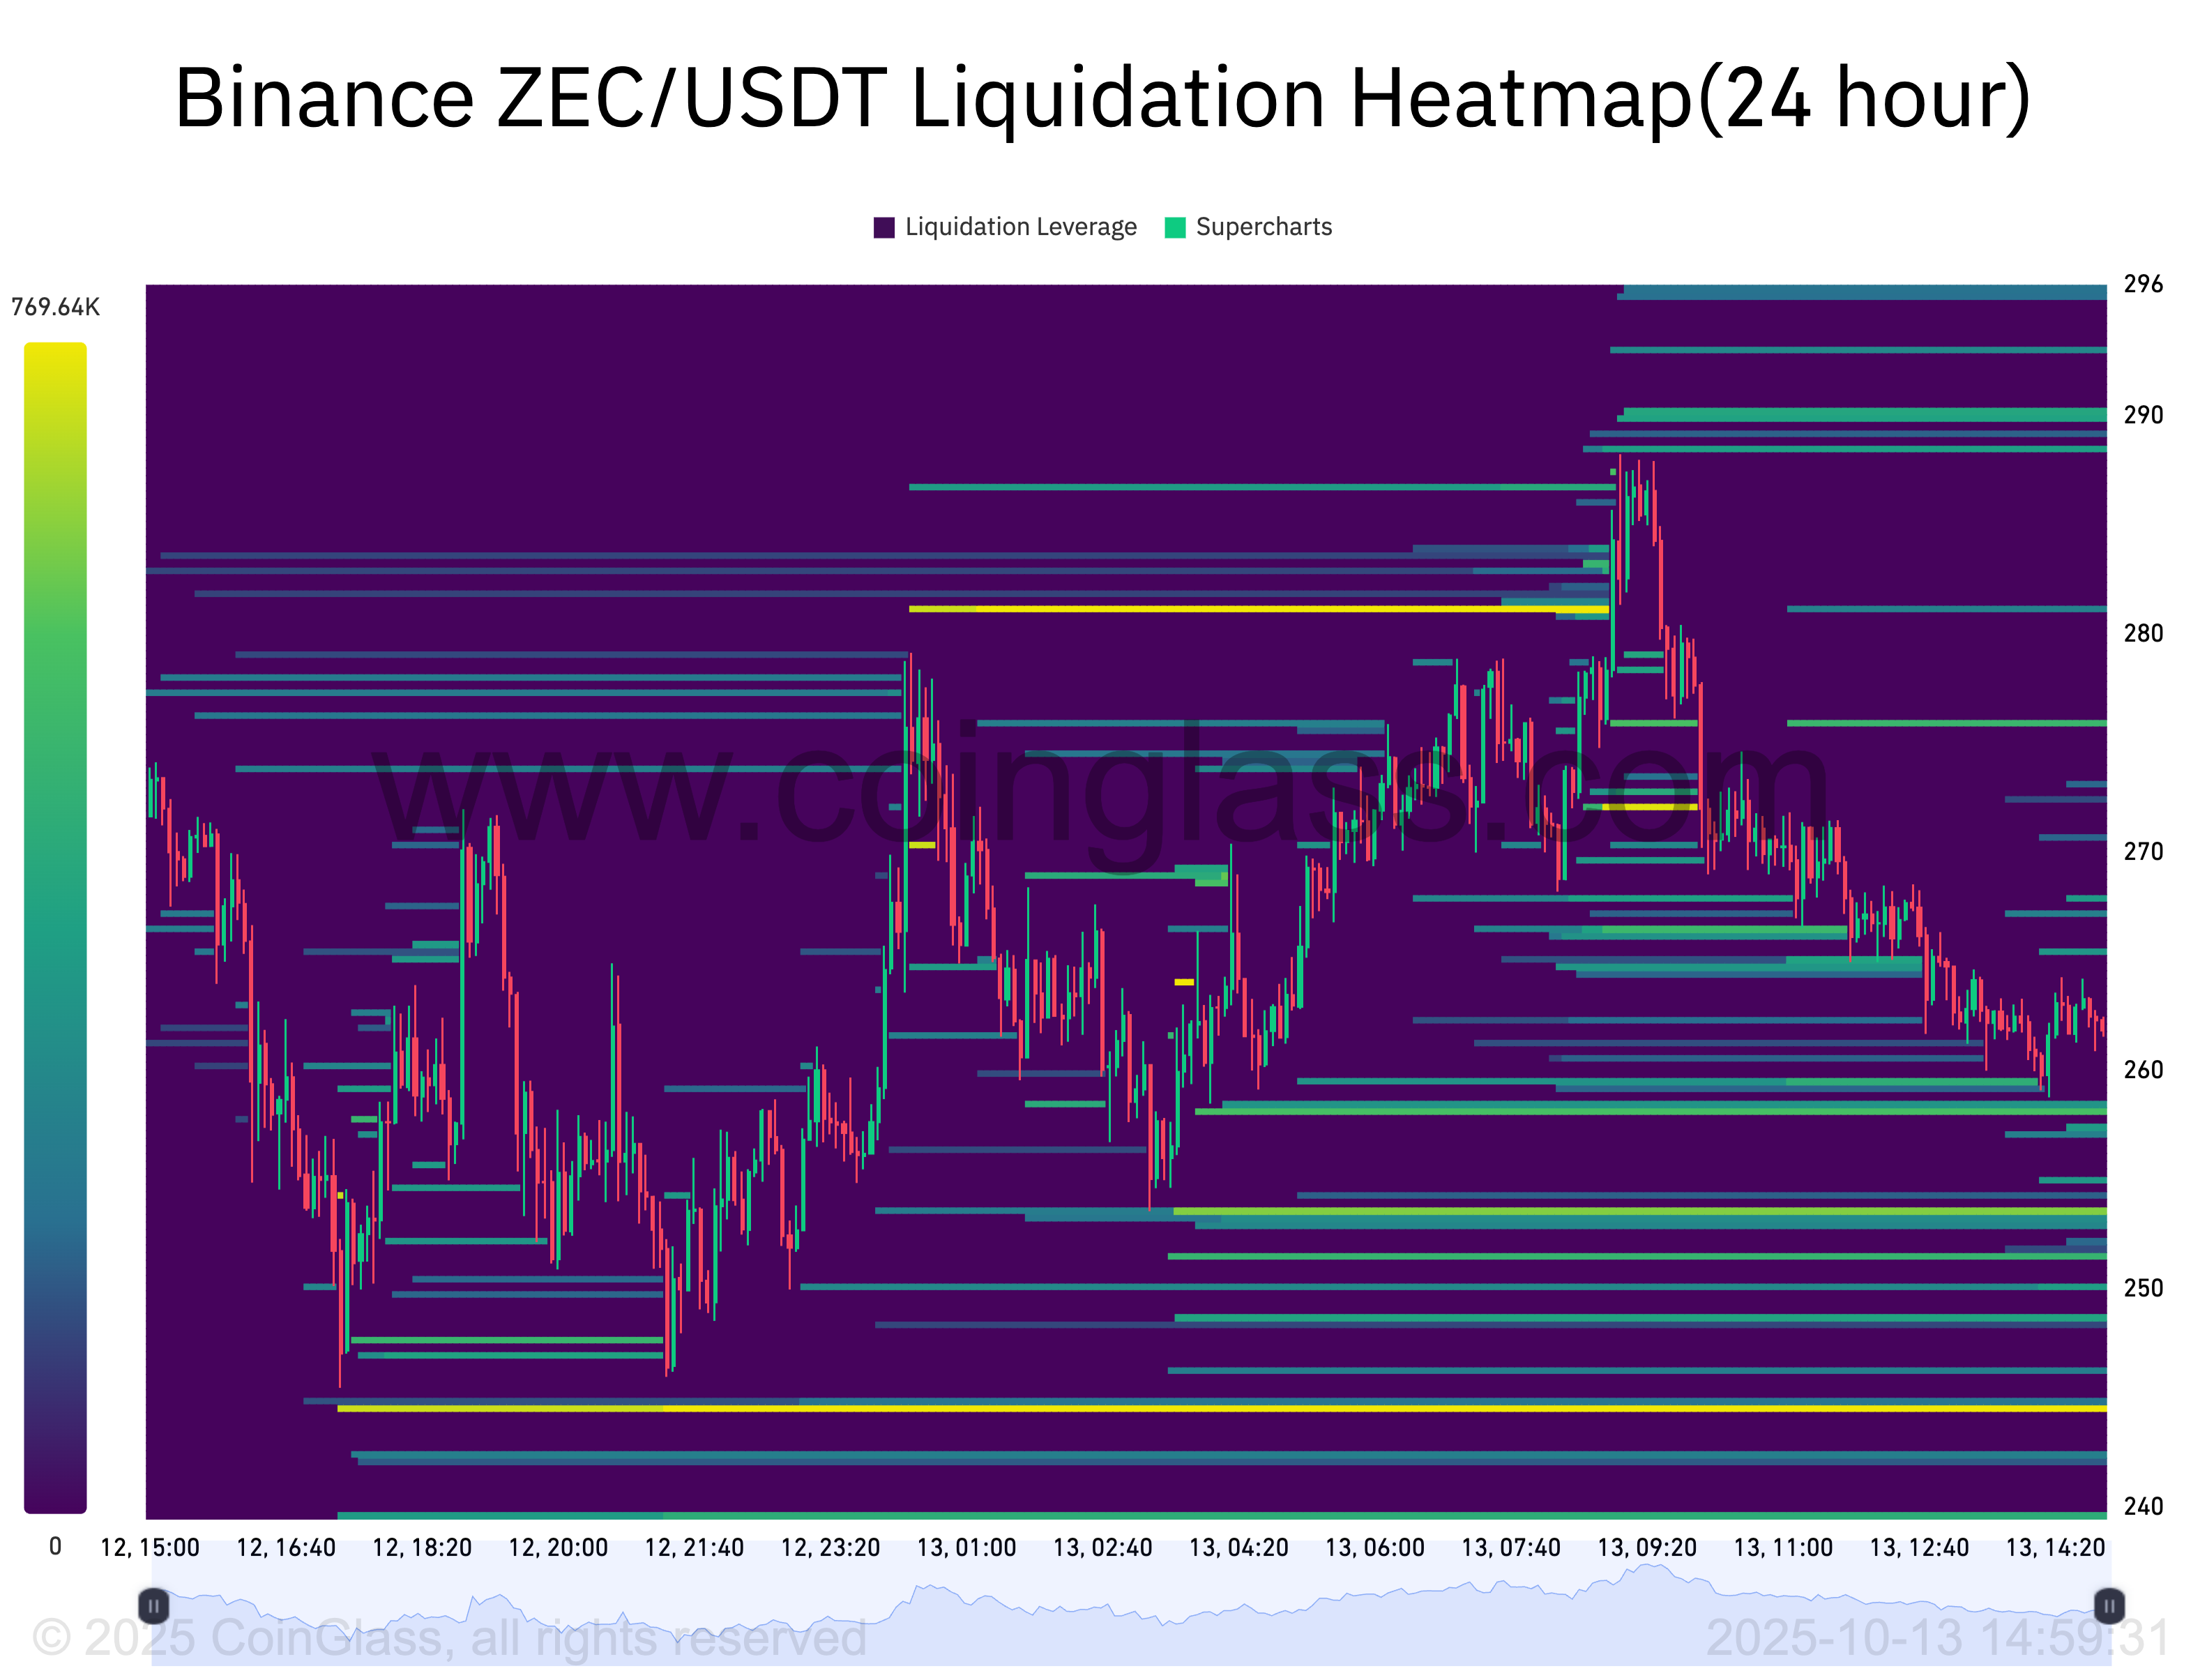
ZEC’s decline below the $244 threshold risks triggering a cascade of forced long liquidations, deepening the pullback before any potential rebound.
In simple terms, that’s where many traders’ stop-losses, or liquidation points, are waiting to be triggered, which may send ZEC prices toward the $210.75 target highlighted above.
ZEC hits record “overbought” levels
The bearish case also leans on Zcash reaching its most overbought levels on the weekly chart, which may lead to a short-term pullback in the weeks ahead.
As of Monday, ZEC’s weekly relative strength index (RSI) stood above 92, its highest level on record.
The previous peak RSI was 78 in April 2021, and ZEC’s price fell by nearly 70% over the next few months.
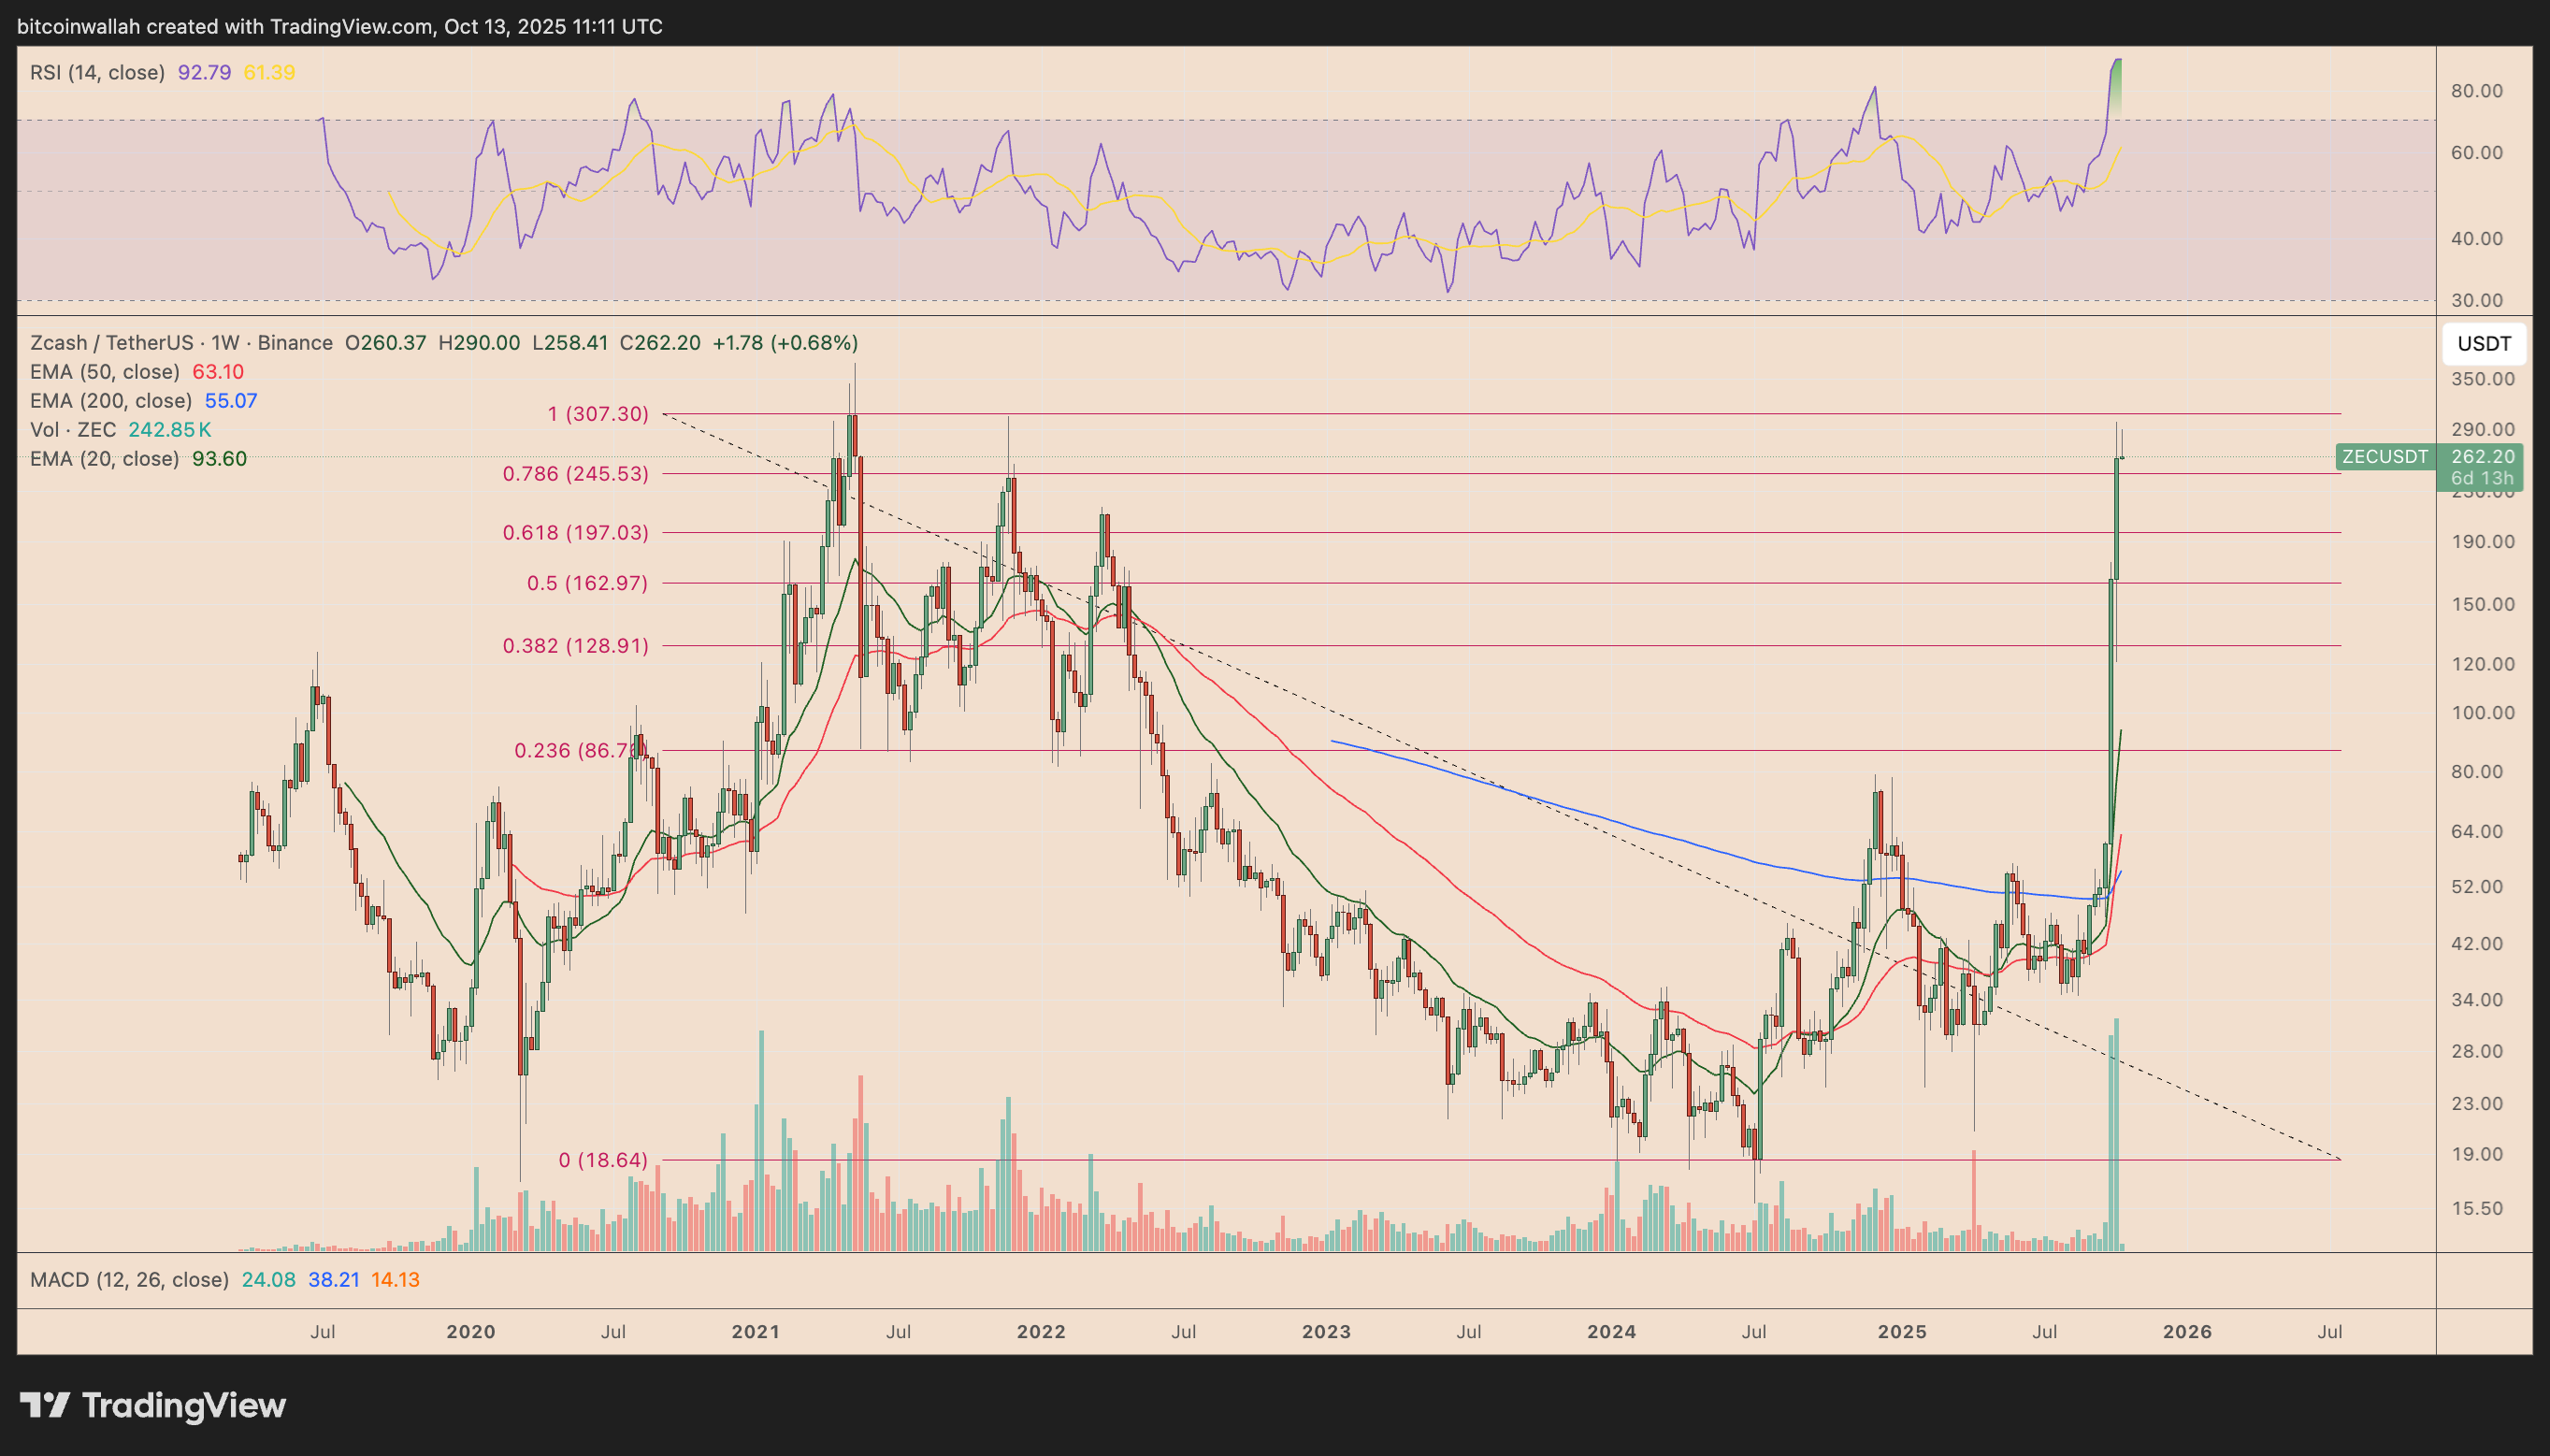
A similar cooling-off phase could follow, particularly if the price fails to establish firm support near the 0.786 Fib retracement level at $245.
On the other hand, a bounce from $245 support could send the price rallying toward $307, or higher, to retest ZEC’s 2021 high at around $375.
Related: EU to ban anonymous crypto accounts and privacy coins by 2027
Analyst Altcoin Sherpa said that any declines toward $200 may be a “buy,” suggesting that these lower levels could form the bottom over the next few days.
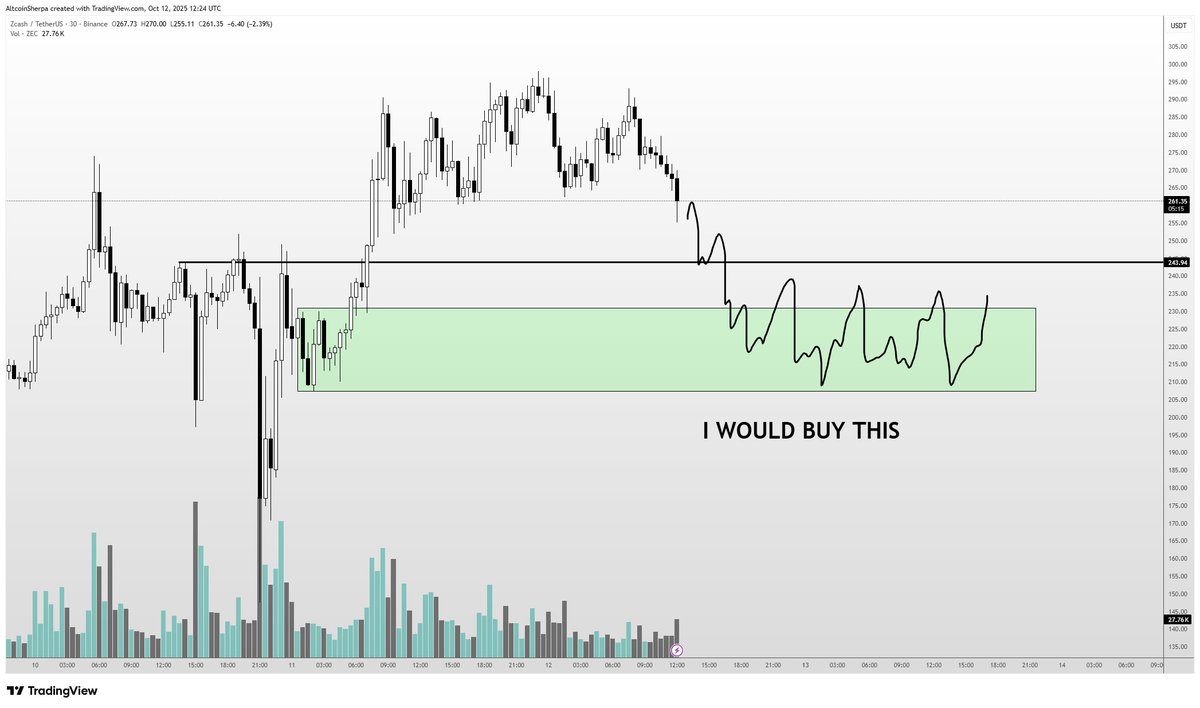
“I’ll be interested around $230 or lower if it comes,” he added.
This article does not contain investment advice or recommendations. Every investment and trading move involves risk, and readers should conduct their own research when making a decision.
