


Key takeaways:
XRP (XRP) has repeatedly broken above the $3 level since its November 2024 boom, but each attempt has ended in a fakeout followed by deeper corrections.
On Saturday, its price once again slipped below its $3 support, coinciding with its 200-4H exponential moving average (EMA; green wave).
Can the XRP price decline even further in the coming days? Let’s examine.
XRP chart fractal puts 15% correction in play
XRP is mirroring a bearish fractal that may trigger a 15% drop toward $2.60 in the coming days.
In September, the token’s price formed a rounded top, then slipped into a period of symmetrical triangle consolidation before breaking down sharply. That move sent XRP prices tumbling toward the $2.70 area.
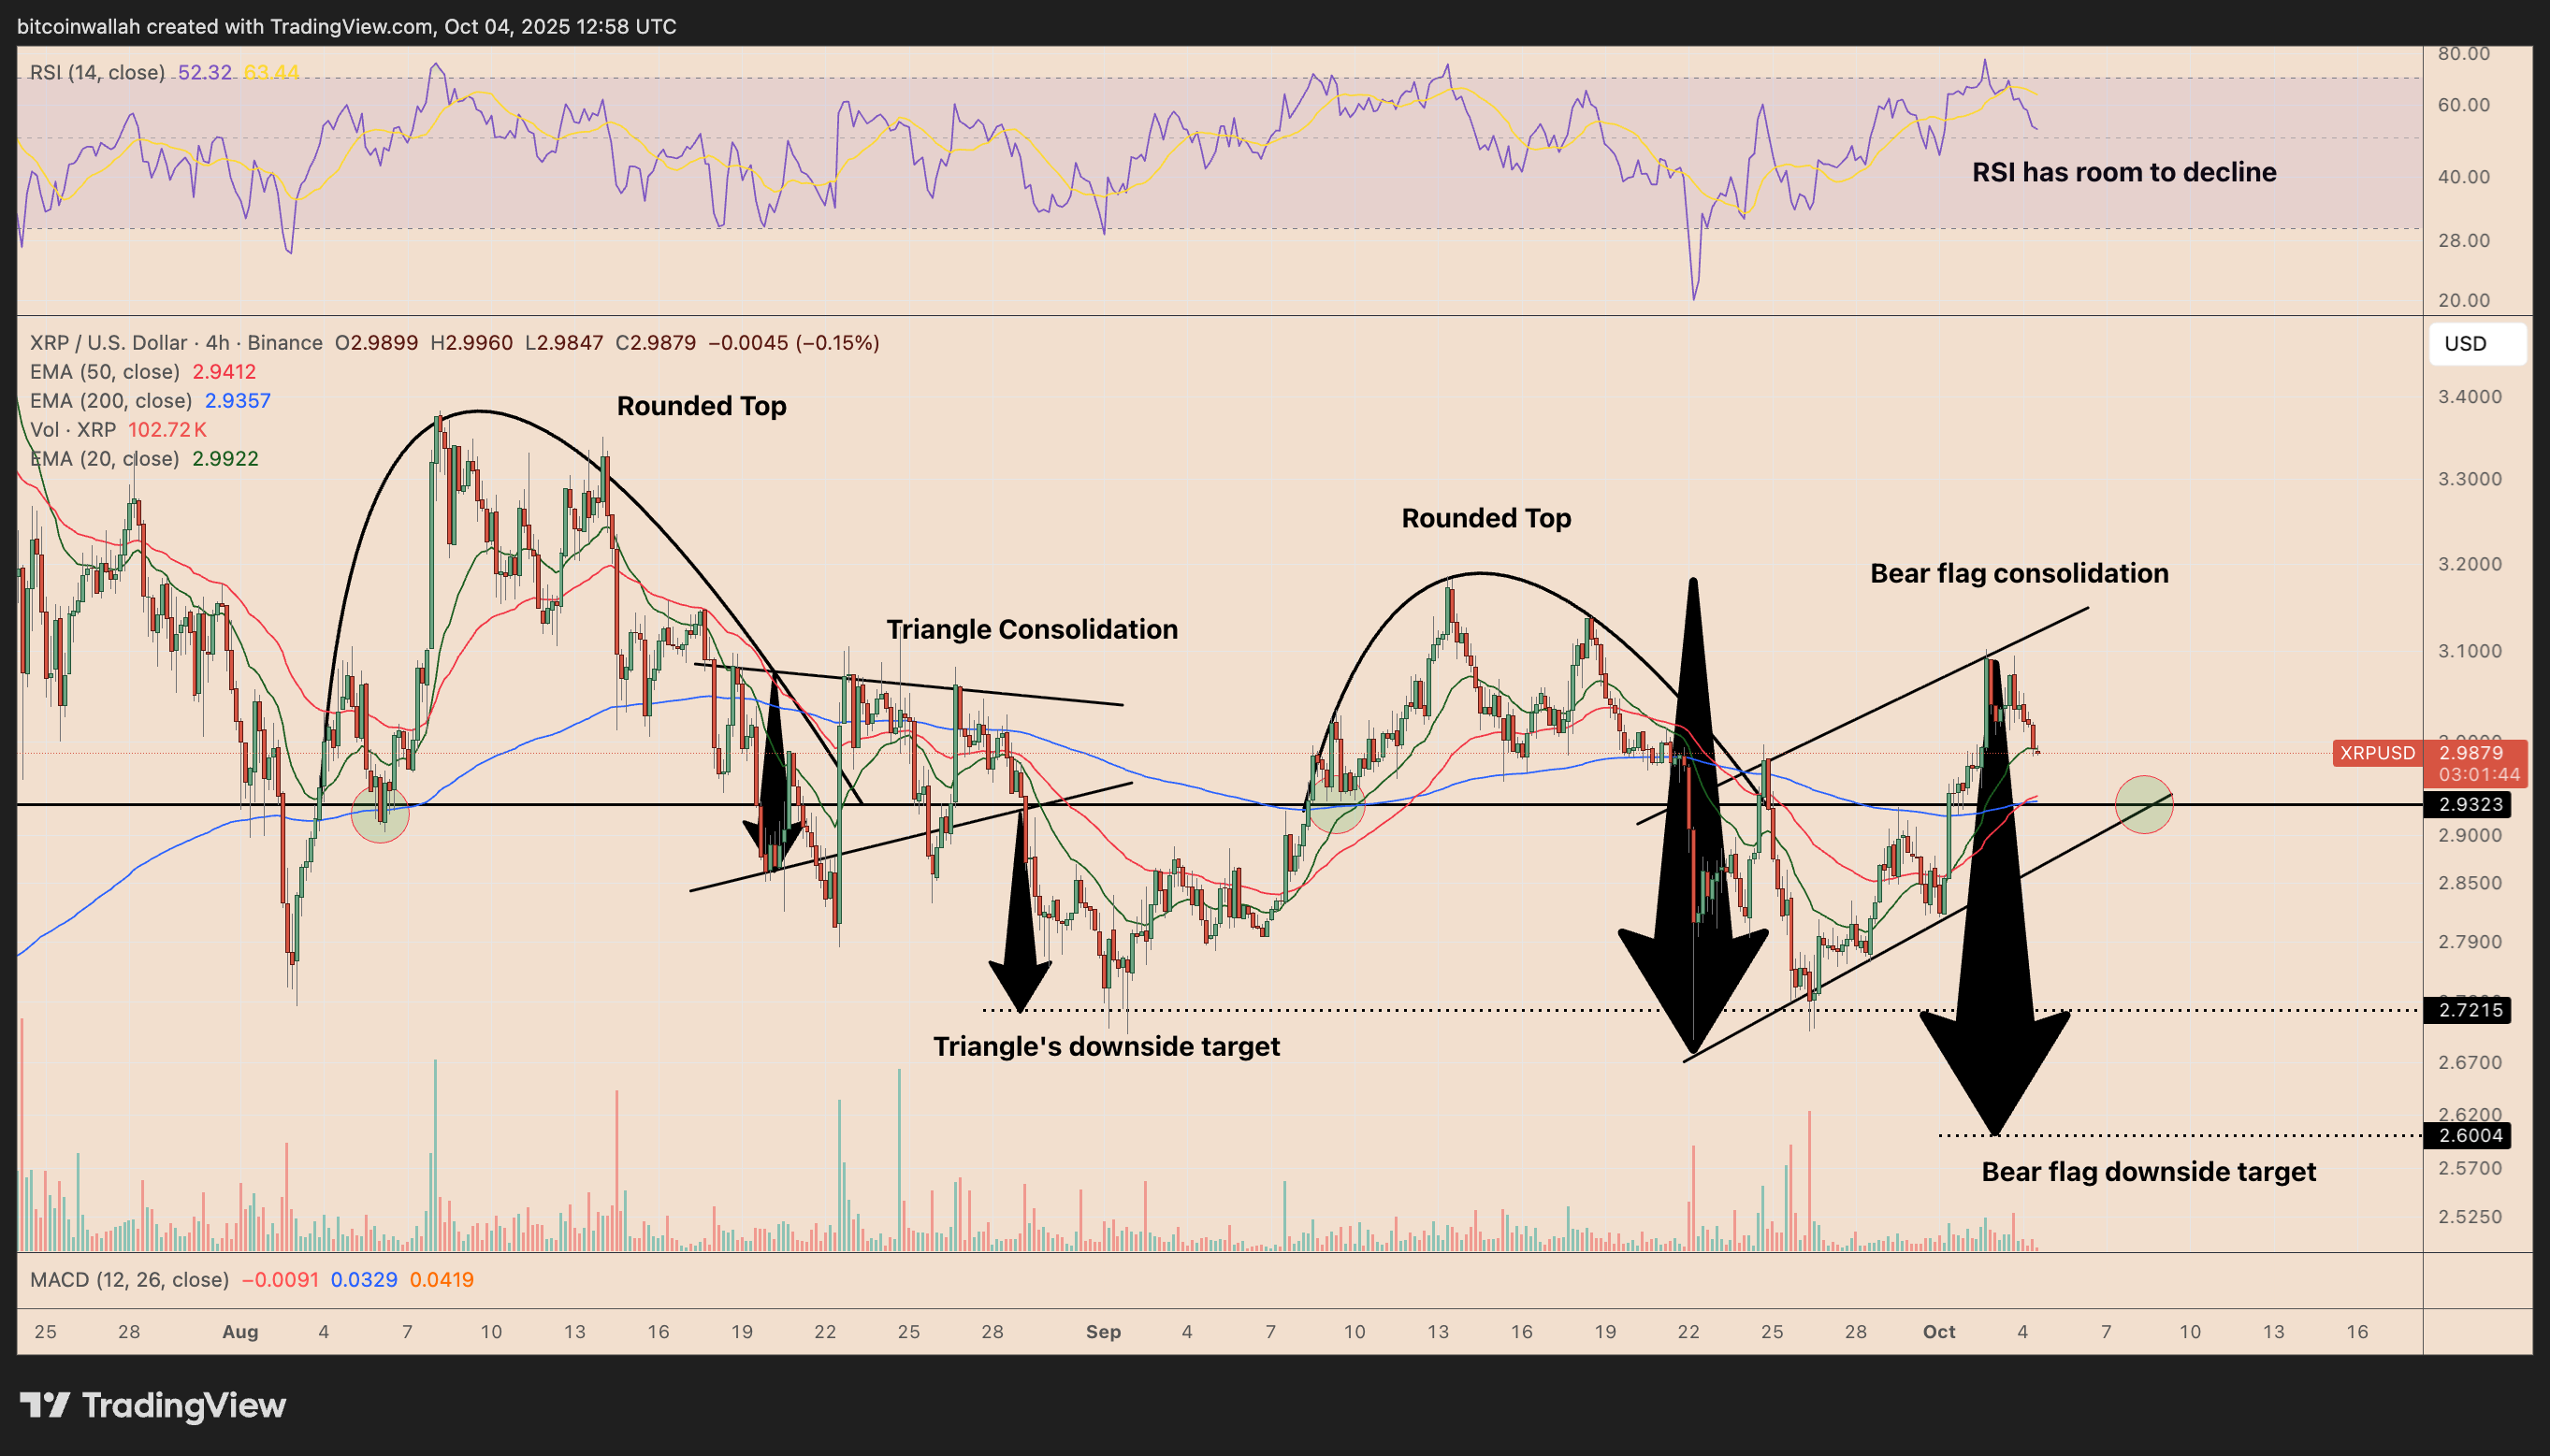
A similar sequence is playing out again in October.
On the four-hour chart, XRP has formed another rounded top and is consolidating within a bearish flag. This structure often leads to another leg lower by as much as the maximum distance between its upper and lower trendlines.
The four-hour relative strength indicator (RSI) contributes to this risk, as it has been correcting from overbought levels above 70 and still has room to decline before the oversold threshold of 30.
Related: XRP price reclaims $3, opening the way for 40% gains in October
XRP may first test flag support at $2.93. A decisive close below it could confirm a breakdown, potentially opening the way to $2.60, a decline of nearly 15% from current prices.
That downside target aligns with XRP’s 200-day EMA (the blue wave in the chart below).
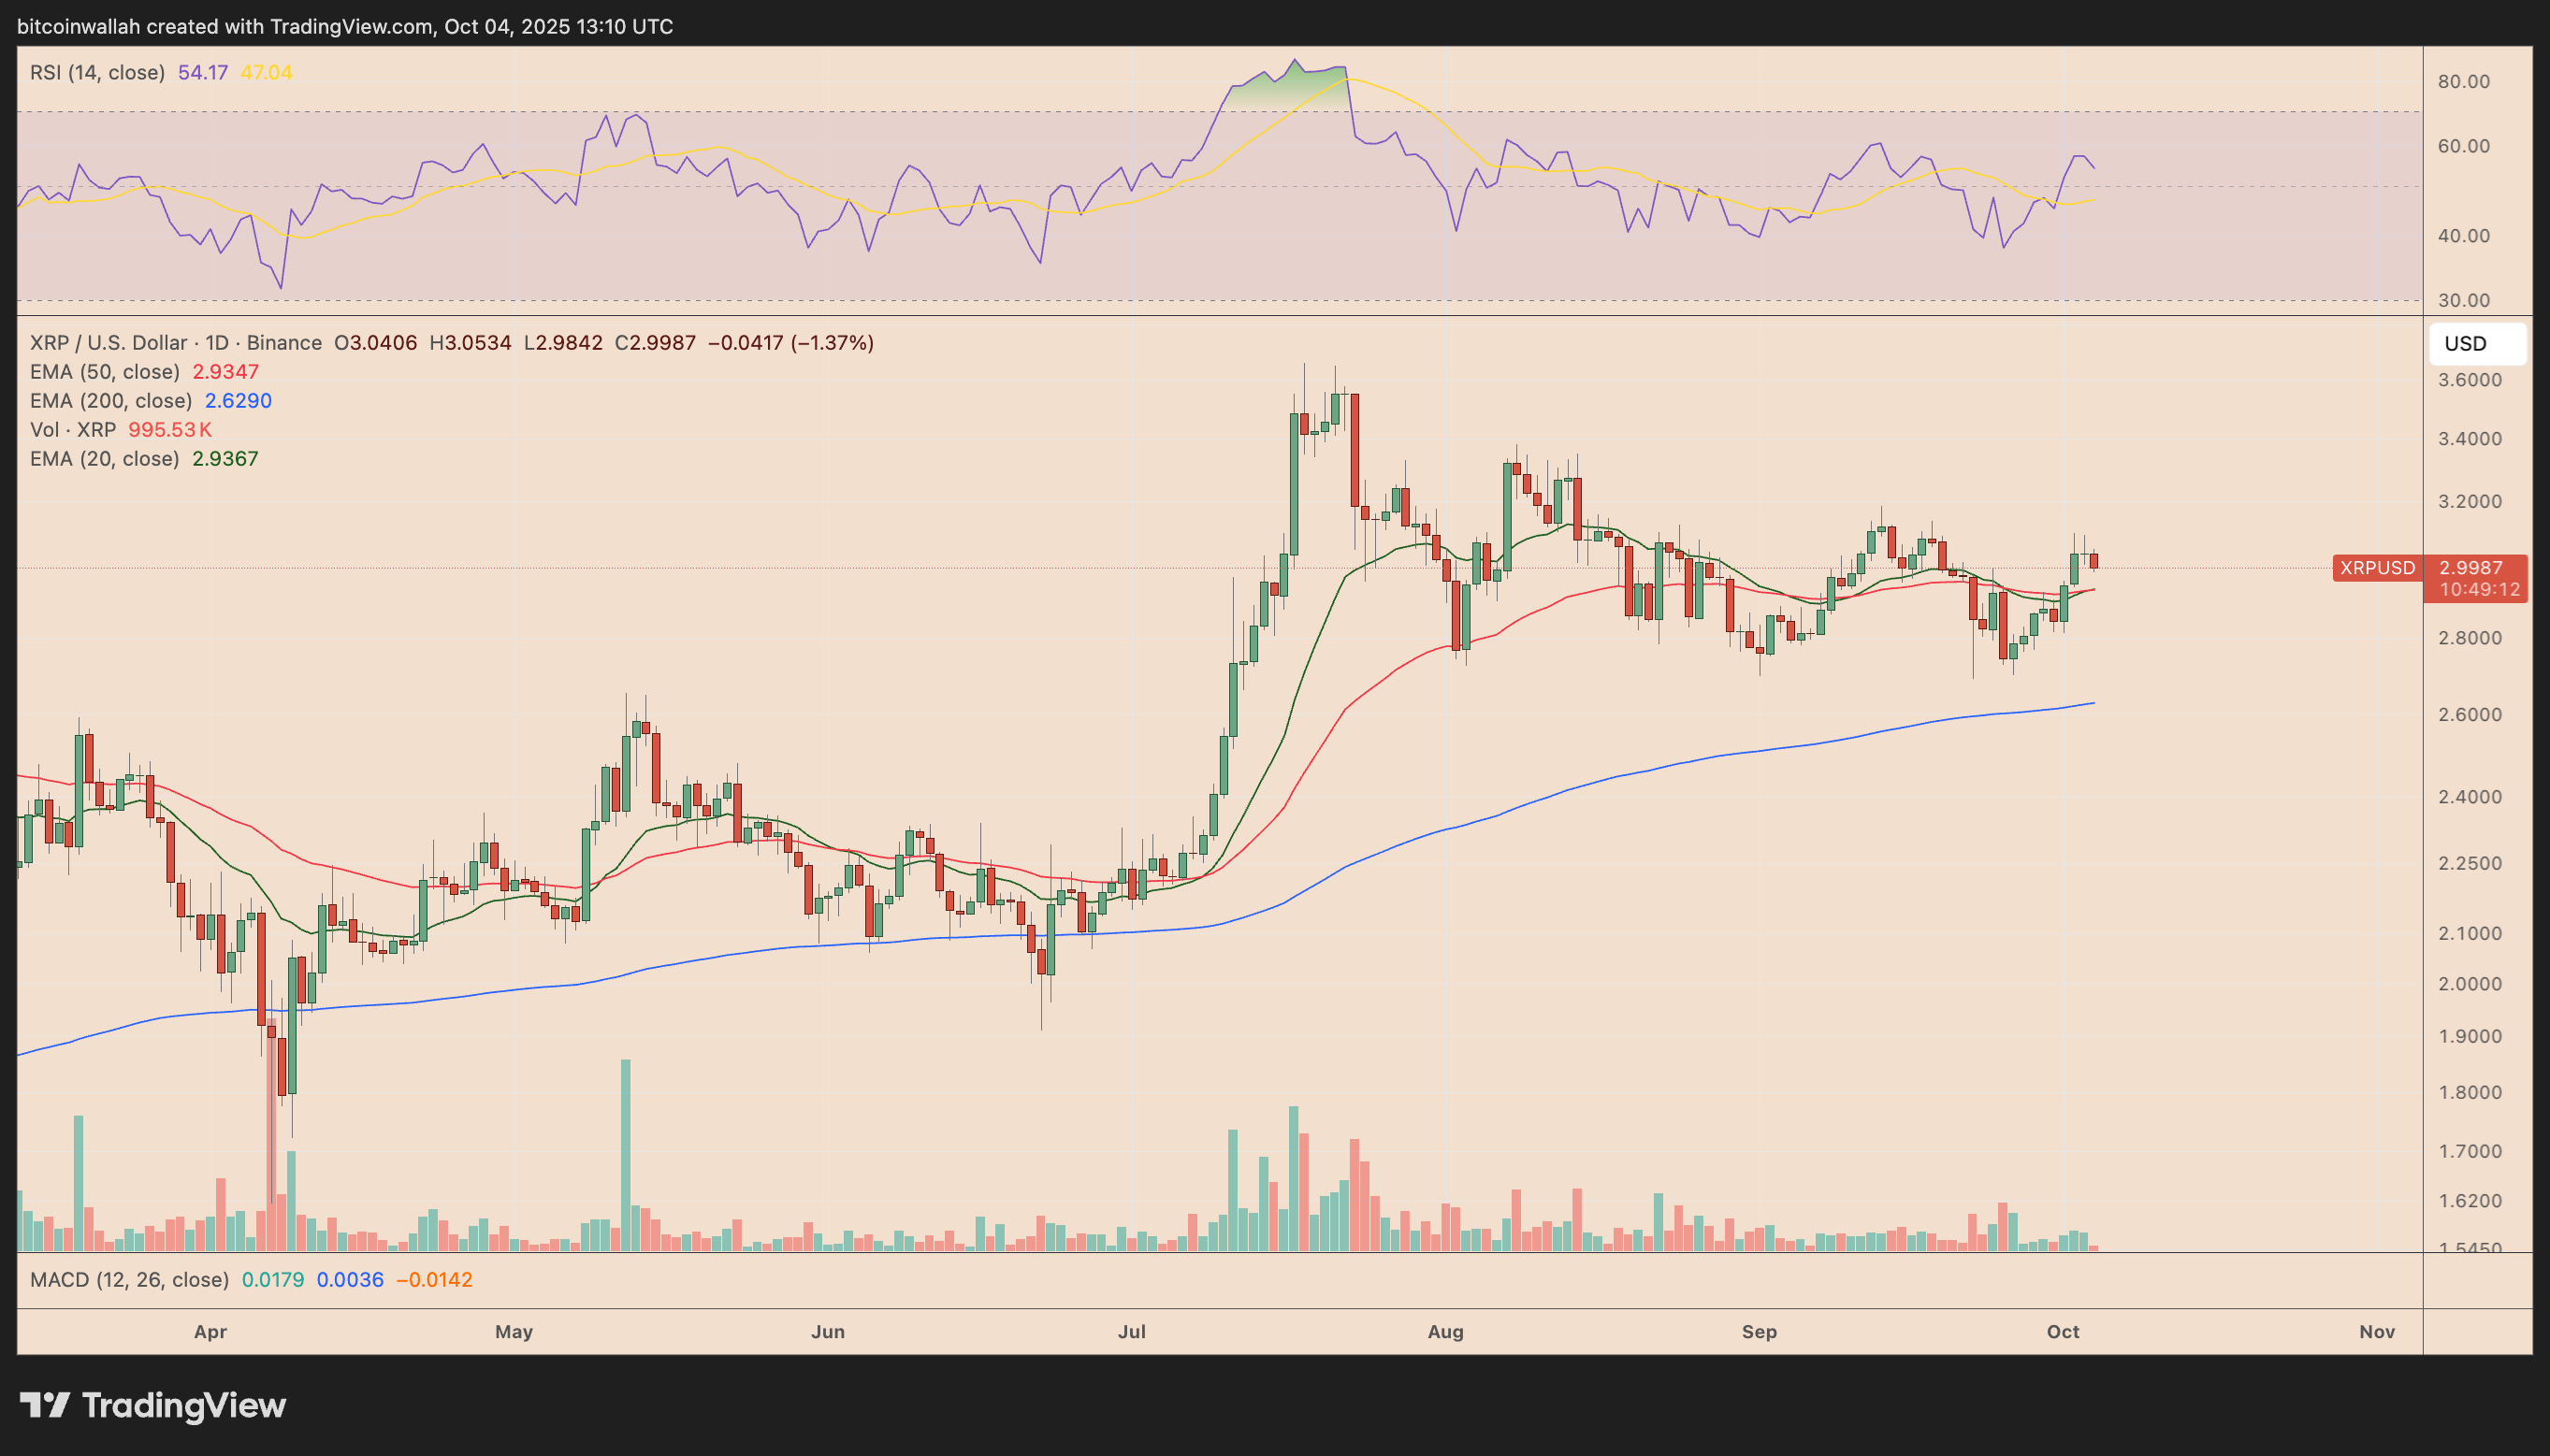
A bounce from 20- ($2.93) or 50-day ($2.52) EMAs may invalidate the bearish outlook, prompting a rebound toward $3 again.
$500 million long squeeze can fuel the XRP sell-off
XRP’s $3 level sits right in between two heavy liquidity pockets, according to data resource CoinGlass.
On the upside, there are thick clusters of long liquidation levels between $3.18 and $3.40.
For instance, at $3.18, the cumulative short leverage is approximately $33.81 million, suggesting the market could move upward to trigger stop orders if bulls regain control.
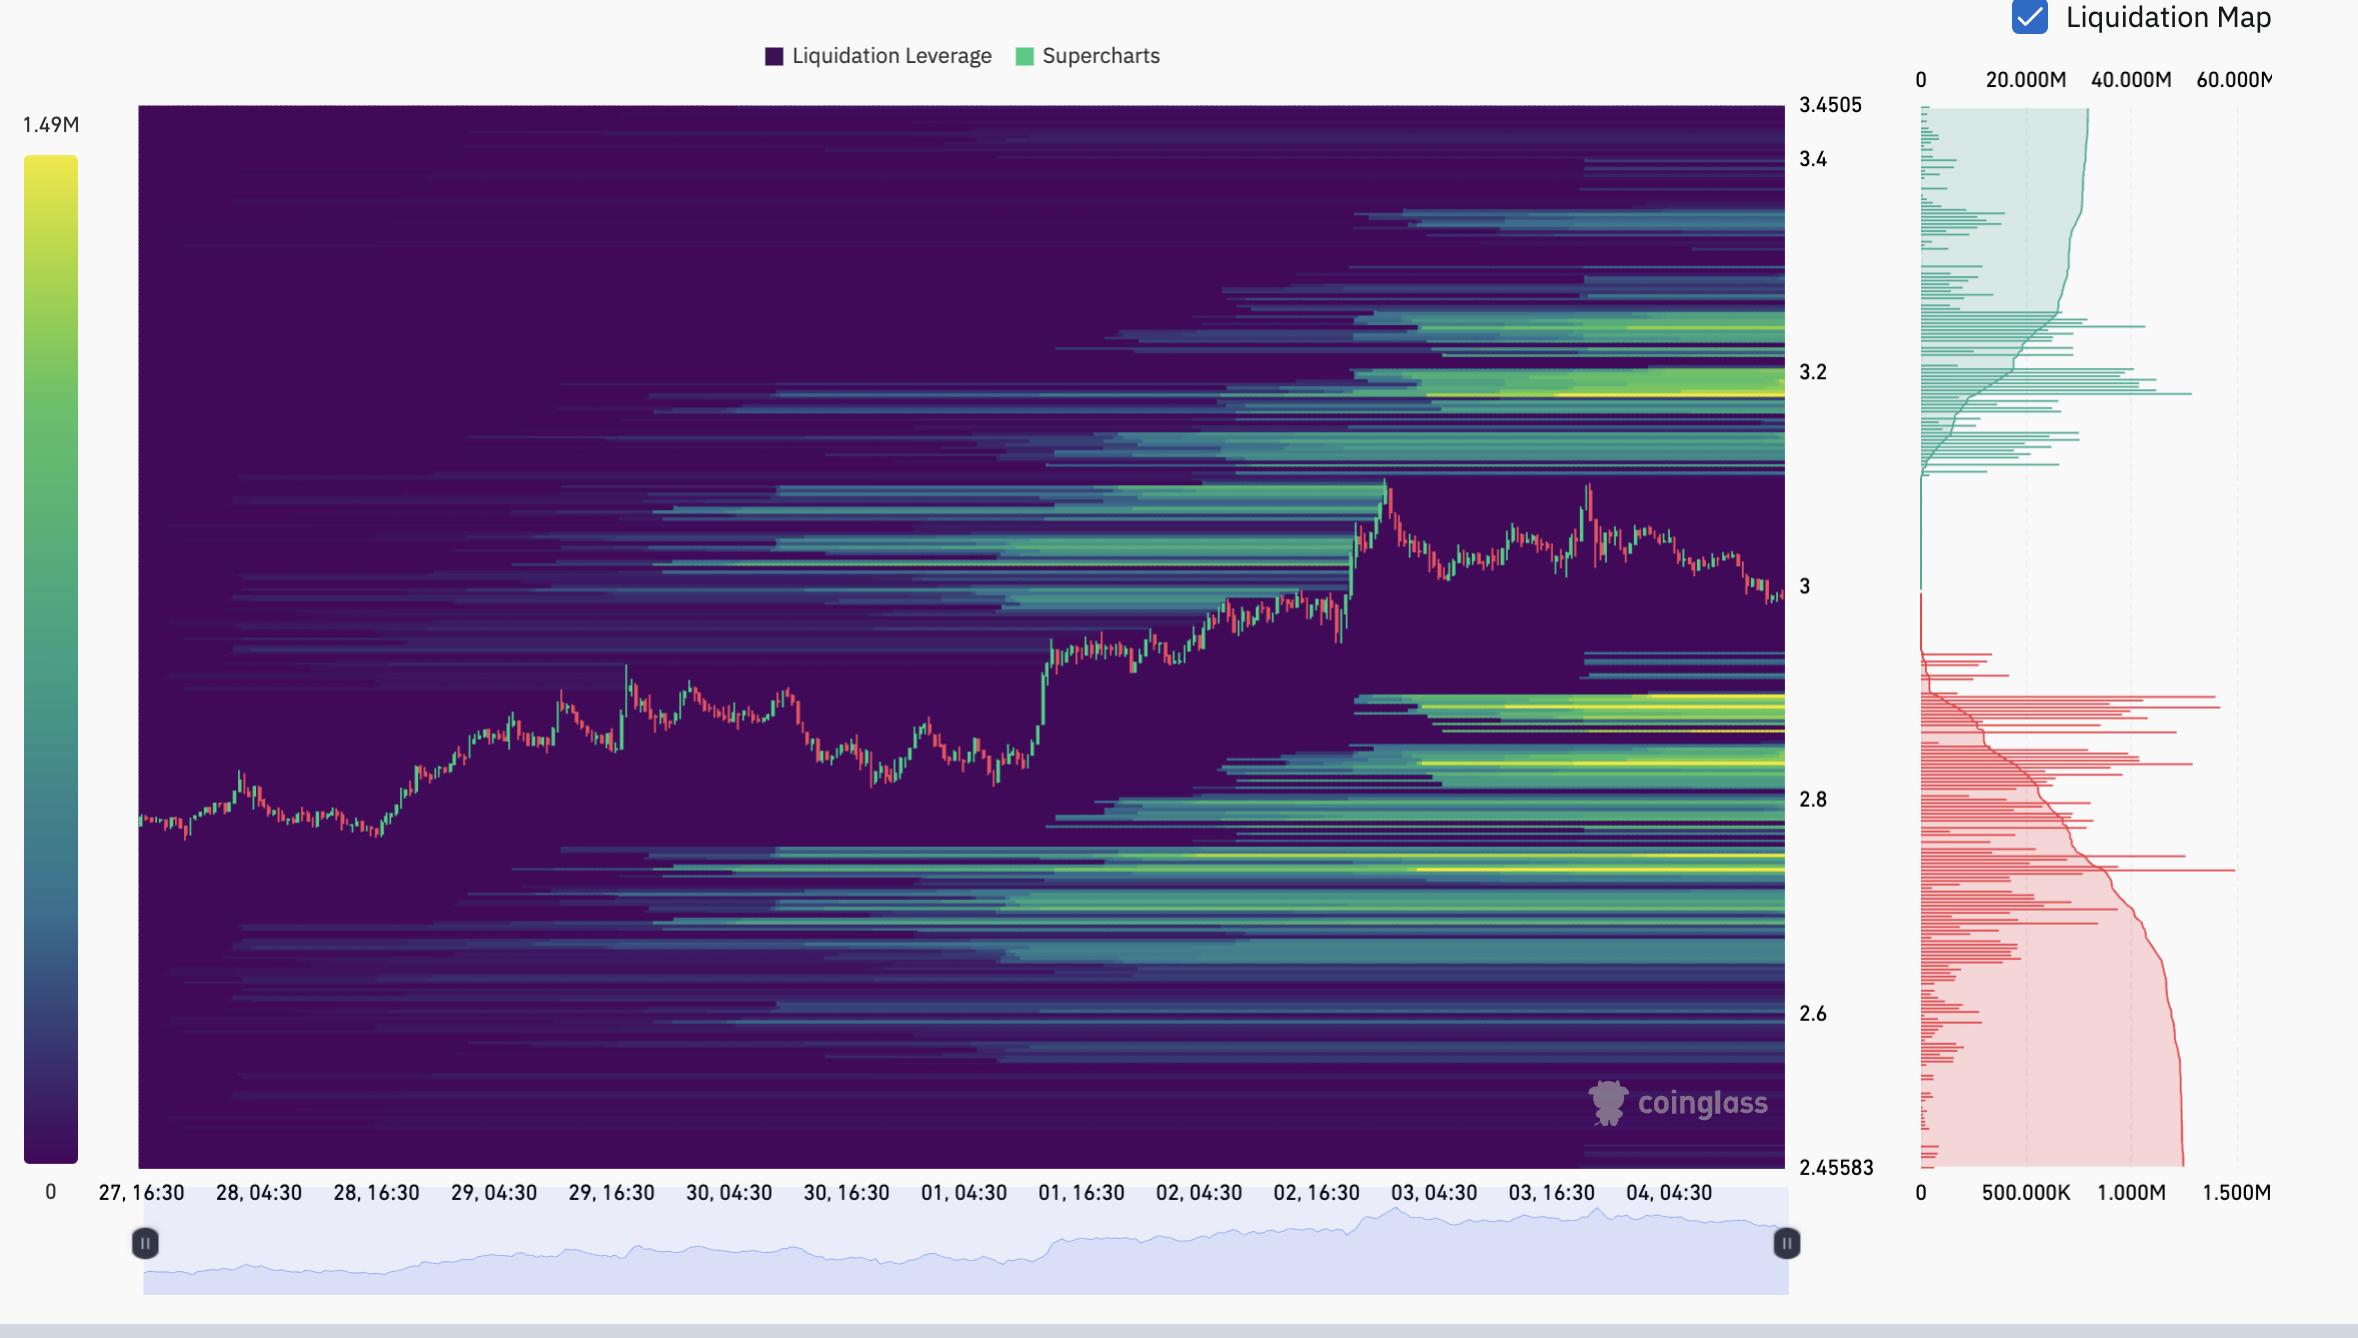
On the downside, however, the heatmap highlights even larger liquidation pools stacked between $2.89 and $2.73, of over $500 million.
XRP’s decisive close below $3 could trigger a cascade of long liquidations toward $2.89–$2.73. Holding above $3, however, leaves room for a stop-run to $3.20–$3.40.
This article does not contain investment advice or recommendations. Every investment and trading move involves risk, and readers should conduct their own research when making a decision.
