


Key points:
-
Solid inflows into spot Bitcoin ETFs show that bulls are back in the driver’s seat and a rally to a new all-time high is likely.
-
BNB is leading the altcoin recovery, with several altcoins poised to break above their overhead resistance levels.
Bitcoin (BTC) rose close to $123,900 on Friday, continuing its march toward the all-time high of $124,474. BTC’s recovery is backed by solid demand from the bulls, and the US spot BTC exchange-traded funds recorded $2.25 billion in inflows since Monday, according to Farside Investors data.
Analysts expect BTC to surge to a new all-time high. Capriole Investments founder Charles Edwards told Cointelegraph that BTC could skyrocket to $150,000 before the end of the year as investors seek safe-haven investments alongside gold.
While all signs point to a possible continuation of the uptrend, some analysts are cautious. Trader Roman said in a post on X that the relative strength index (RSI) indicator on BTC’s chart is exhibiting a bearish divergence on both the weekly and monthly time frames. Roman cautioned traders to be “careful holding here.”
Could BTC soar to a new all-time high, triggering a rally in altcoins? Let’s analyze the charts of the top 10 cryptocurrencies to find out.
Bitcoin price prediction
BTC surged above the $117,500 overhead resistance on Wednesday, indicating that the buyers are back in command.
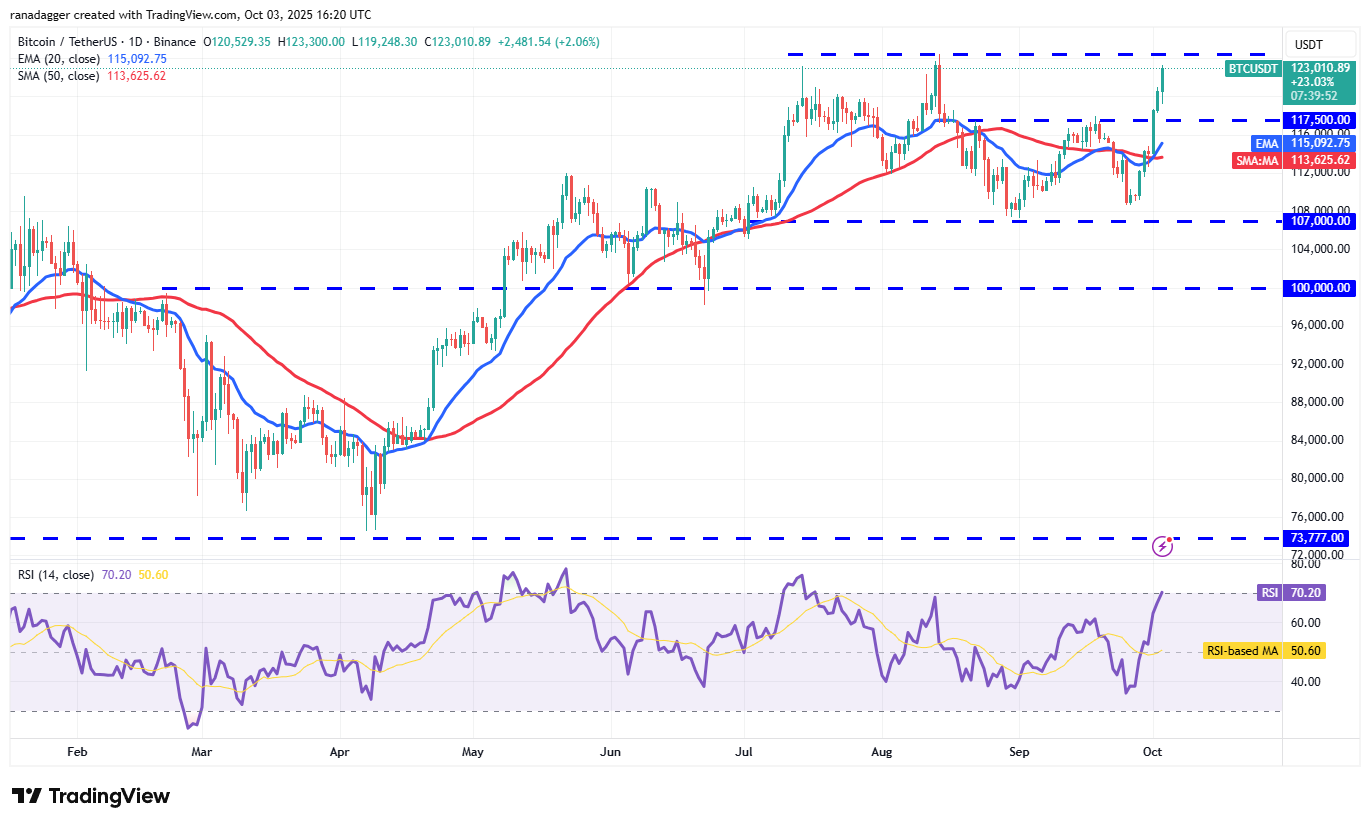
The BTC/USDT pair has reached near the all-time high of $124,474, where the bears are expected to mount a strong defense. If the price turns down sharply from the current level of $124,474 and breaks below $117,500, it signals that the bears are active at higher levels. The Bitcoin price may then remain between $107,000 and $124,474 for a while longer.
Instead, if buyers drive the price above $124,474, it signals the resumption of the uptrend. The pair may then rally to $141,948.
Ether price prediction
Ether (ETH) closed above the 20-day exponential moving average ($4,309) on Wednesday and reached the resistance line on Friday.
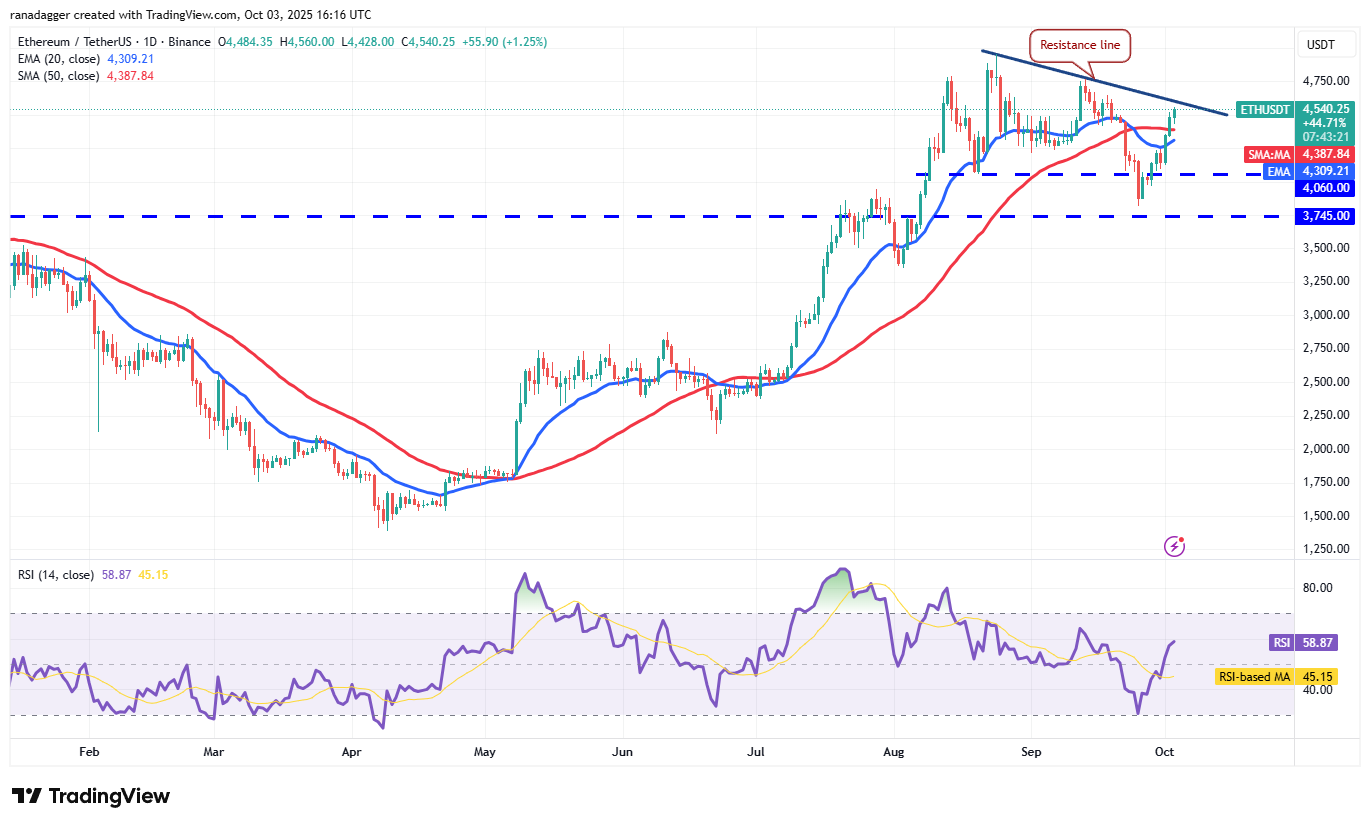
The 20-day EMA has started to turn up gradually, and the RSI has risen into the positive territory, signaling a slight edge to the bulls. Sellers will attempt to halt the recovery at the resistance line, but if the buyers prevail, the ETH/USDT pair could retest the all-time high at $4,957.
The bears will have to pull the price below the 20-day EMA to weaken the bullish momentum. The Ether price could then drop to $4,060.
XRP price prediction
Buyers pushed XRP (XRP) above the downtrend line on Thursday but were unable to achieve a close above it.
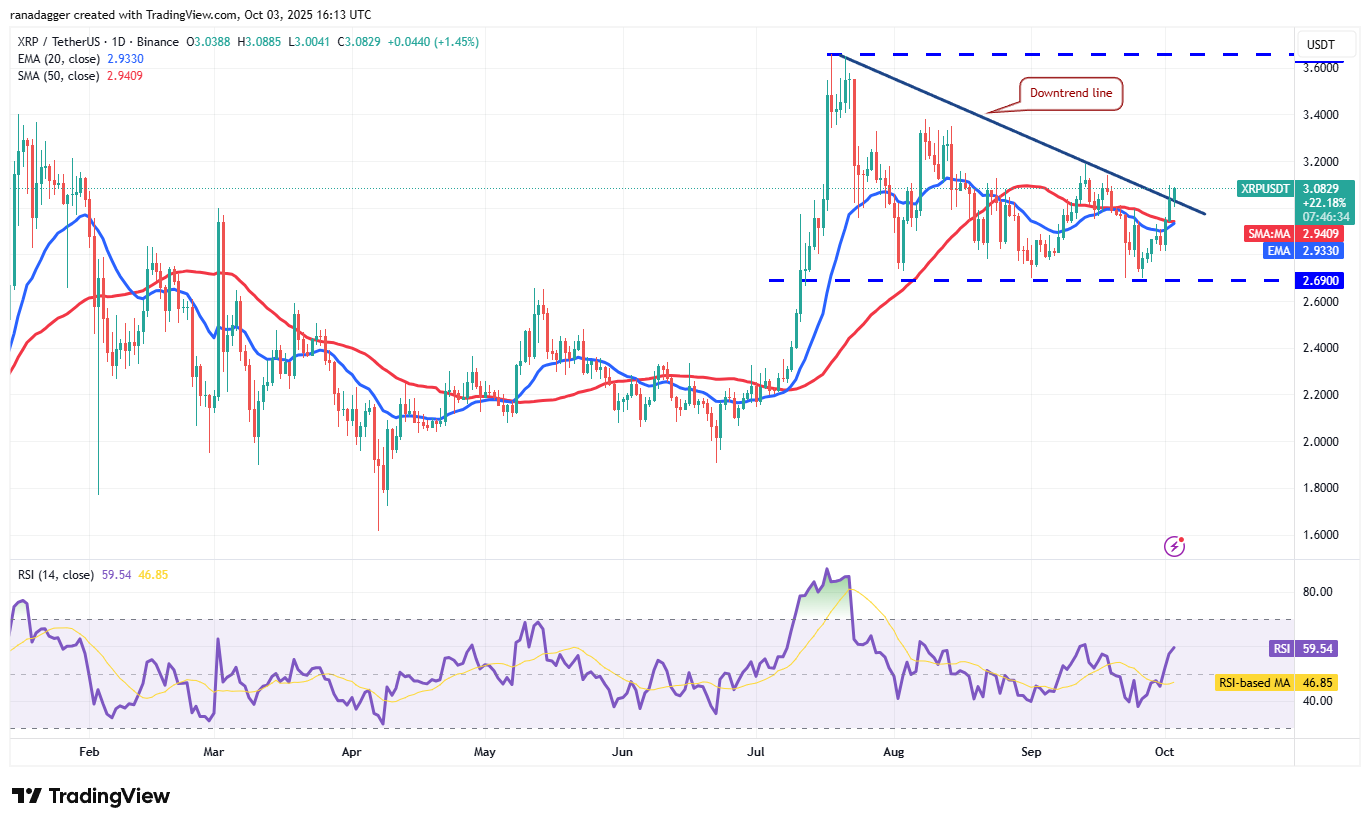
Buyers are again attempting to maintain the XRP price above the downtrend line. If they succeed, the bearish descending triangle pattern will be invalidated. The XRP/USDT pair may then climb to $3.20 and later to $3.38.
This optimistic view will be negated in the near term if the price turns down and breaks below the moving averages. That suggests the breakout above the downtrend line may have been a bull trap.
BNB price prediction
BNB (BNB) skyrocketed to a new all-time high above $1,084 on Thursday and extended the up move on Friday.
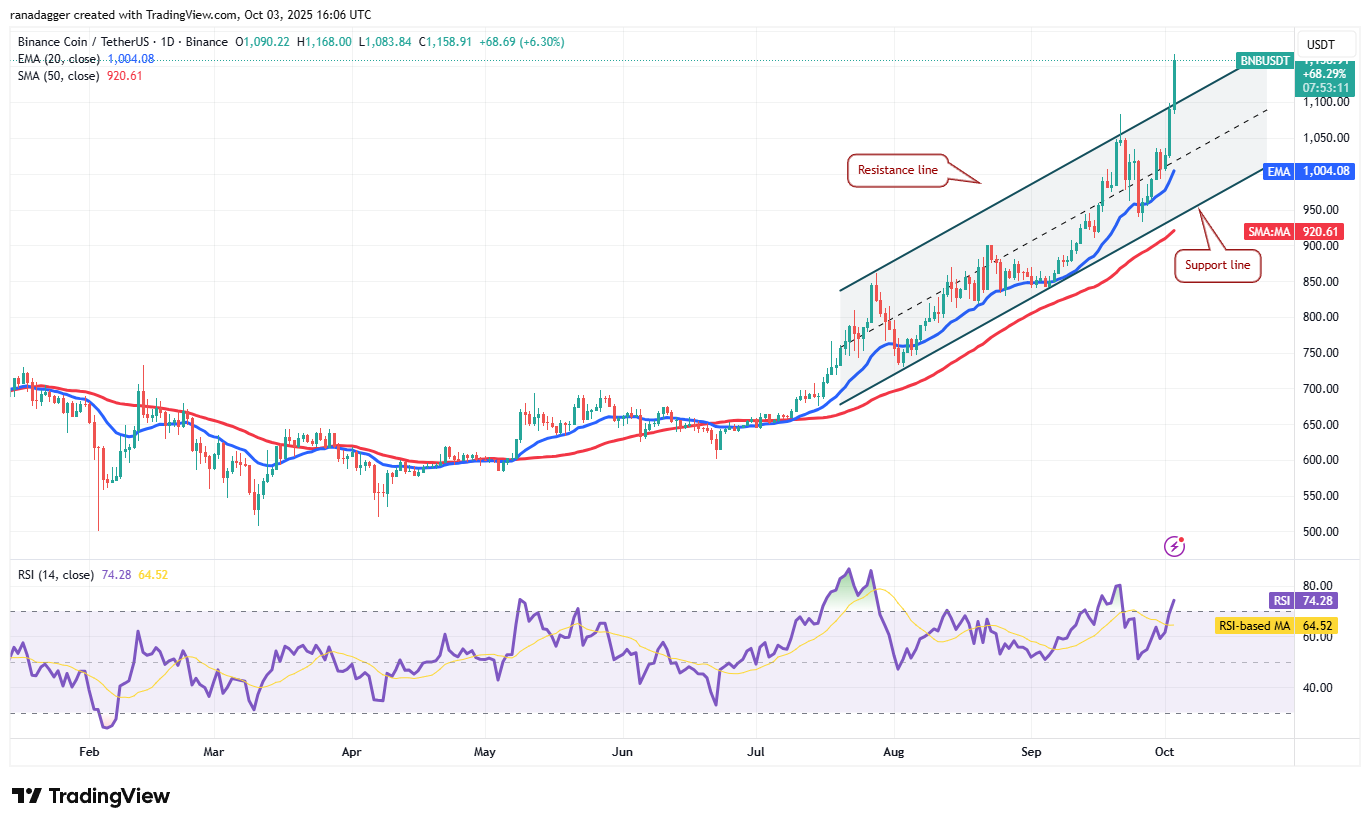
The BNB/USDT pair has broken above the ascending channel pattern, signaling a pickup in bullish momentum. There is minor resistance at $1,173, but if this level is crossed, the rally could extend to $1,252.
The breakout level from the channel and the 20-day EMA ($1,004) are likely to act as strong supports on the downside. Sellers will have to drag the BNB price below $930 to suggest that the pair may have topped out in the short term.
Solana price prediction
Buyers pushed Solana (SOL) back above the uptrend line on Wednesday, suggesting that the corrective phase may be over.
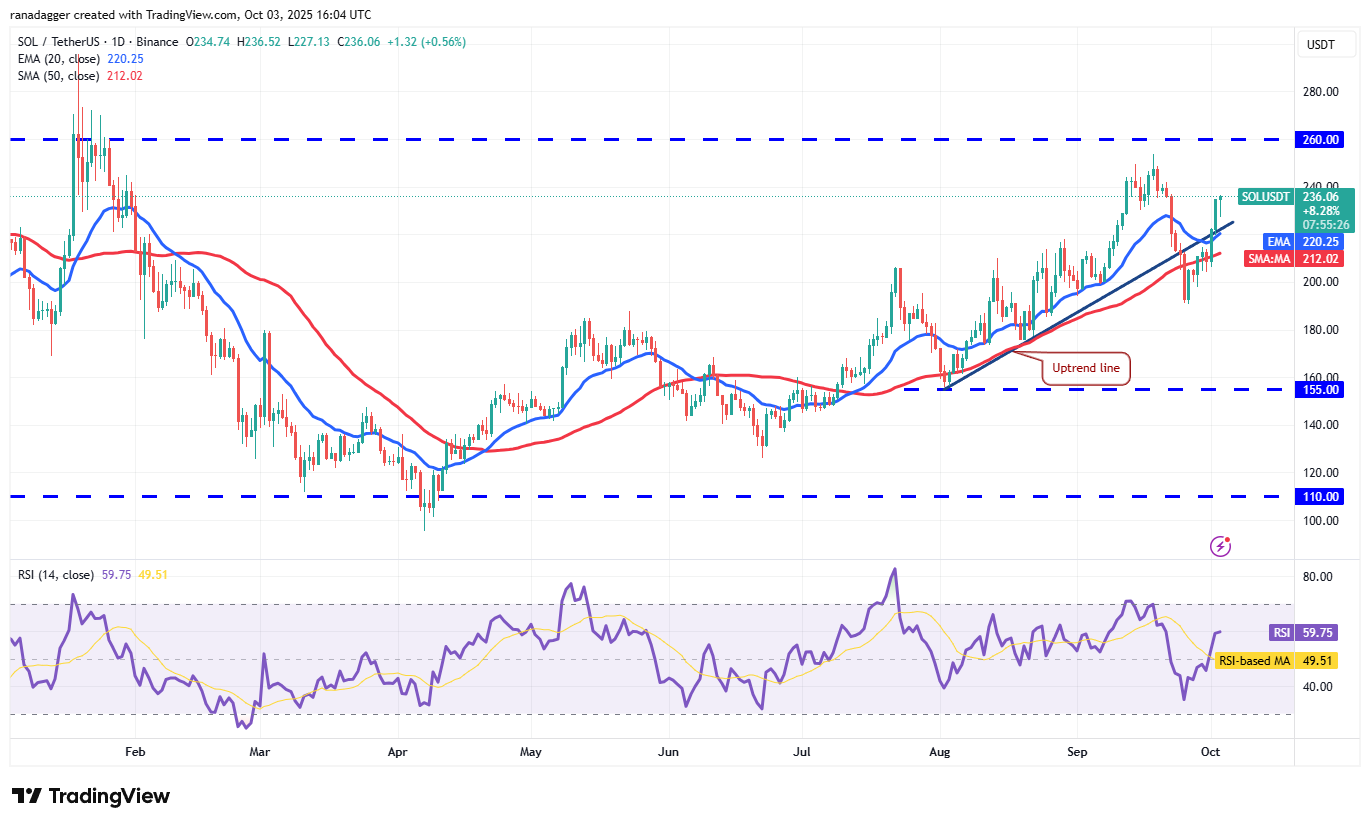
Any pullback from the current level is likely to find support at the 20-day EMA ($220). If that happens, the SOL/USDT pair could rally to the overhead resistance of $260. Sellers are expected to defend the $260 level with all their might because a close above it could catapult the Solana price to $295.
Sellers will have to tug the price below the 50-day simple moving average ($212) to make a comeback.
Dogecoin price prediction
Dogecoin (DOGE) closed above the 20-day EMA ($0.24) on Wednesday, indicating a slight edge to the bulls.
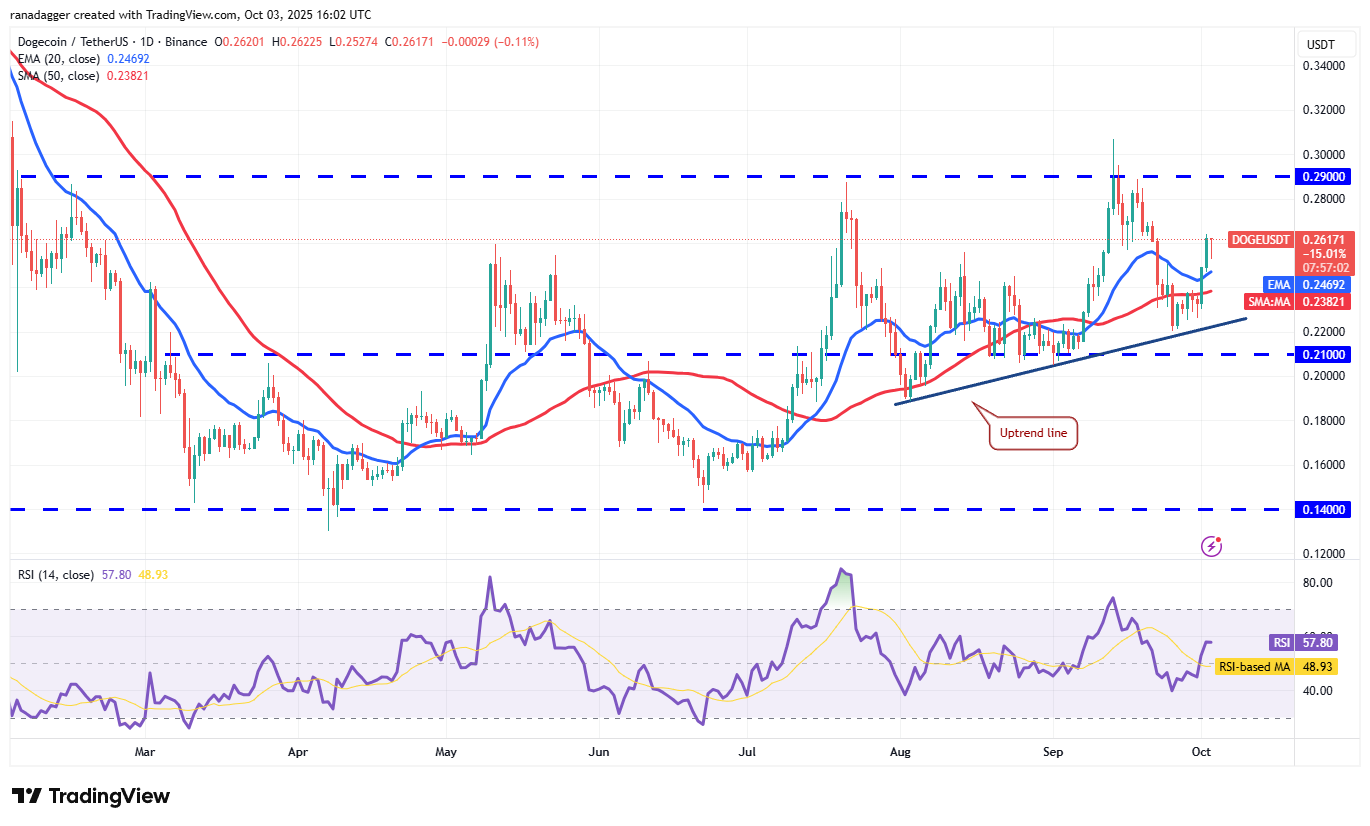
Although the DOGE/USDT pair remains stuck inside a large range between $0.14 and $0.29, the price action is forming an ascending triangle pattern. Buyers will have to achieve a close above $0.29 to complete the bullish setup. DOGE may then rally to the pattern target of $0.39.
The bullish pattern will be invalidated if the bears pull the price below the uptrend line. That suggests the pair may extend its consolidation for some more time.
Cardano price prediction
Cardano’s (ADA) recovery rose above the 50-day SMA ($0.86) on Thursday, indicating that the selling pressure is reducing.
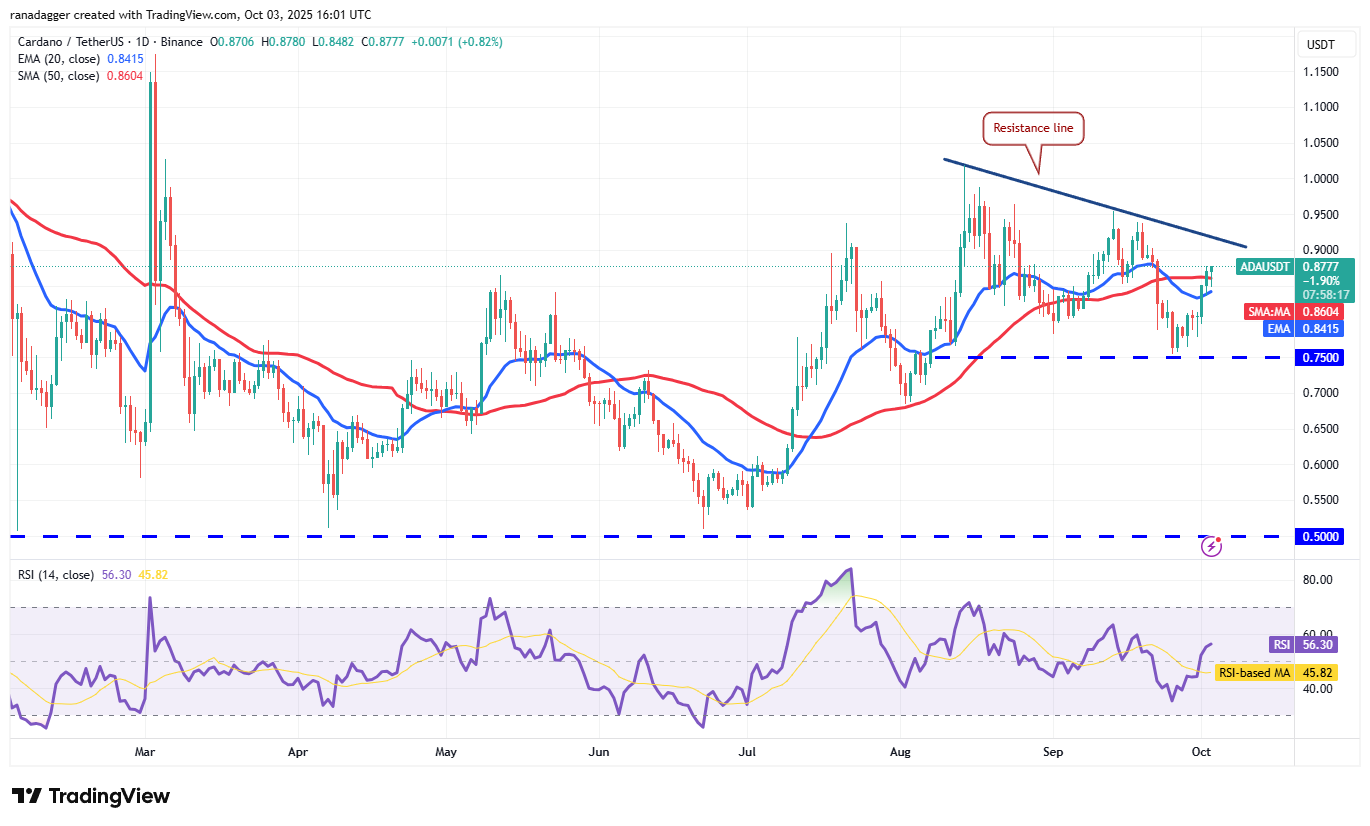
Buyers will have to propel the Cardano price above the resistance line to suggest that the correction may be over. The ADA/USDT pair could then attempt a rally to $1.02, where the bears are expected to step in.
Contrarily, if the price turns down from the current level or the resistance line and breaks below the 20-day EMA ($0.84), it suggests that the bears are selling on rallies. The pair may then slump to the $0.75 support.
Related: XRP price reclaims $3, opening the way for 40% gains in October
Hyperliquid price prediction
Hyperliquid (HYPE) surged above the moving averages on Thursday, indicating solid buying at lower levels.
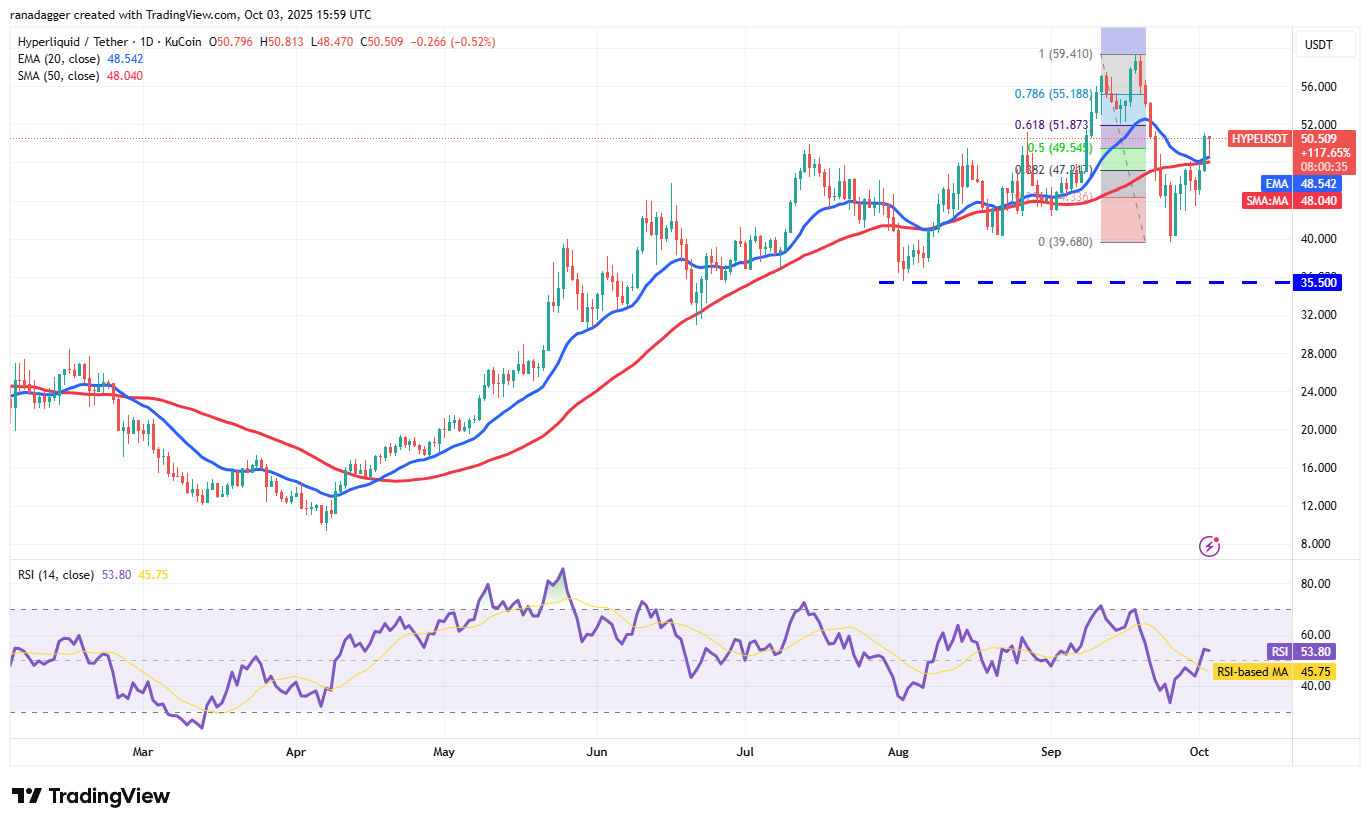
The relief rally is expected to face selling at the 61.8% Fibonacci retracement level of $51.87. If the price turns down from $51.87 but bounces off the moving averages, it suggests that the sentiment has turned bullish. The HYPE/USDT pair could then ascend to $59.41.
On the contrary, if the price turns down and breaks below the moving averages, it signals that the bears are active at higher levels. The Hyperliquid price could then tumble to $43 and thereafter to $39.68.
Chainlink price prediction
Chainlink (LINK) rose above the 20-day EMA ($22.35) on Wednesday, but the bulls are facing resistance near the downtrend line.
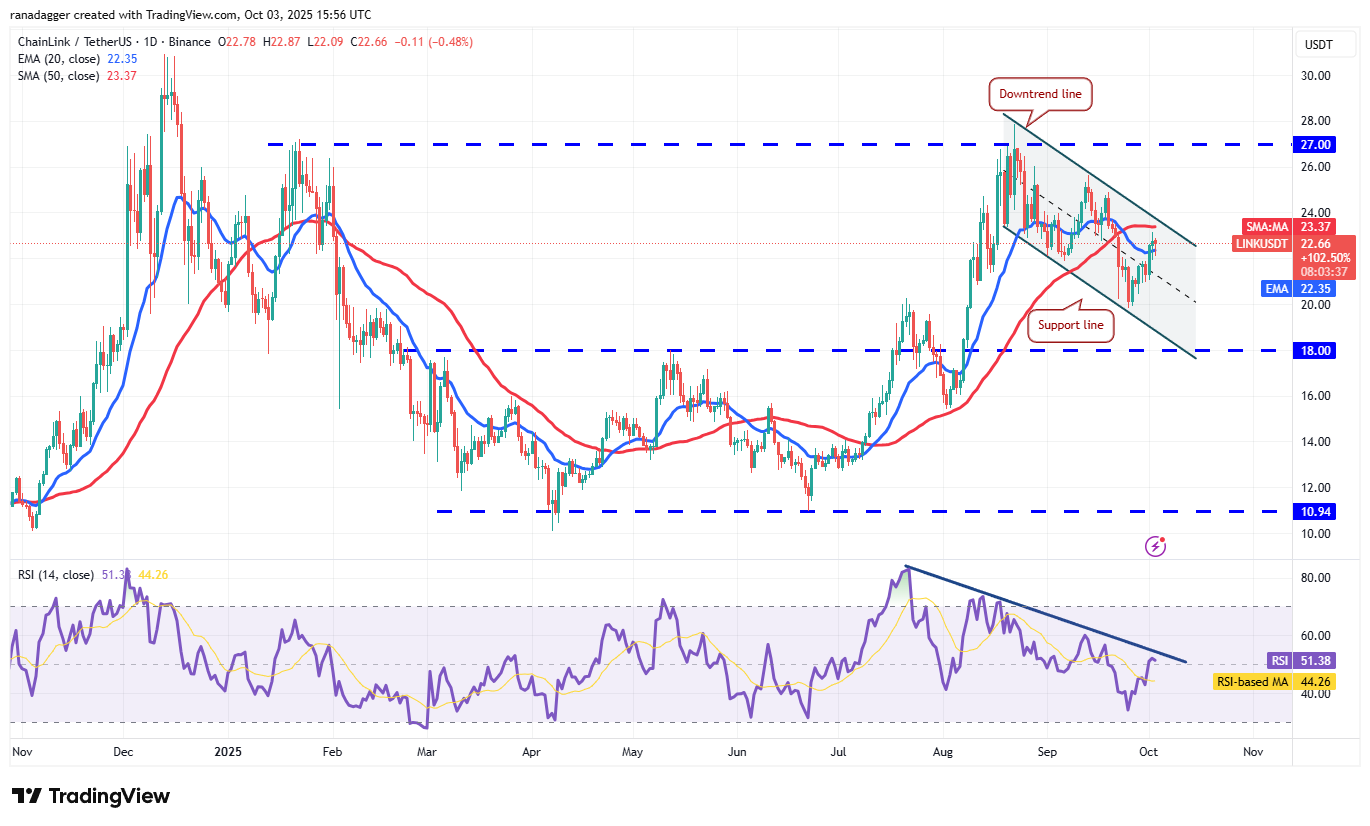
If the price skids and remains below the 20-day EMA, it suggests that the LINK/USDT pair could stay inside the descending channel pattern for a few more days.
The first sign of strength will be a break and close above the downtrend line. If that happens, the Chainlink price could rally to $26 and, after that, to $27. Sellers will attempt to halt the up move at $27, but if the bulls prevail, the rally could reach $30.94.
Sui price prediction
Sui (SUI) climbed above the moving averages on Wednesday, indicating that the selling pressure is reducing.
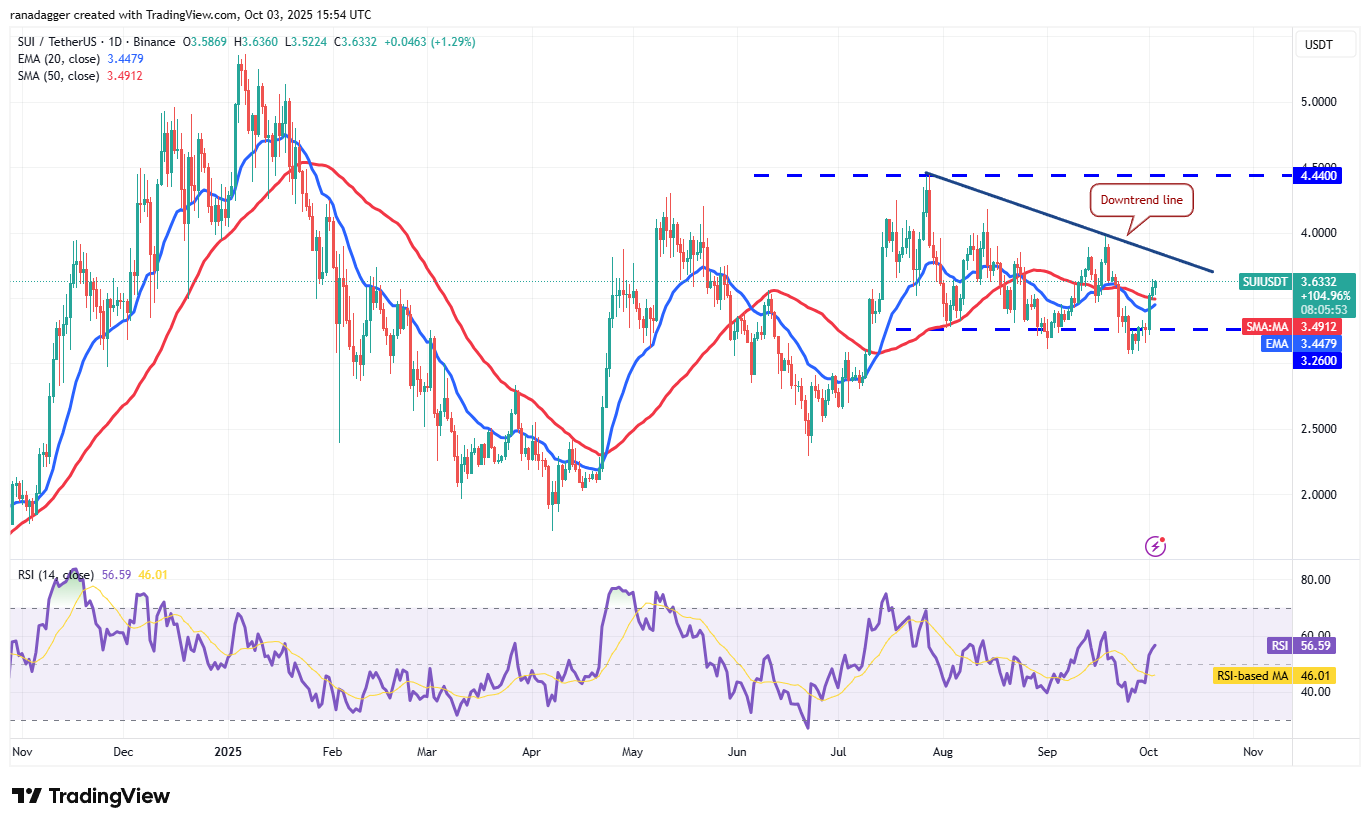
If buyers maintain the price above the moving averages, the SUI/USDT pair could climb to the downtrend line. Sellers are expected to defend the downtrend line aggressively because a break above it could propel the Sui price to $4.20 and subsequently to $4.44.
On the contrary, if the price turns down and breaks below the moving averages, it suggests that the bears have not given up. The pair may then tumble to the $3.26 to $3.06 support zone.
This article does not contain investment advice or recommendations. Every investment and trading move involves risk, and readers should conduct their own research when making a decision.
