


Key takeaways:
-
Ethereum may have found a floor at $3,900, signaling a local bottom.
-
A rare Power of 3 pattern suggests a potential 80% to 100% breakout in Q4.
Ether (ETH) may have signaled a local bottom at $3,900, with a key technical pattern pointing to the possibility of another large-scale breakout. As identified in the daily chart, traders could be closely watching the return of the Power of 3 (PO3) model, also known as the Accumulation-Manipulation-Distribution setup, which previously drove ETH to $4,900 from $2,000 between May and June.
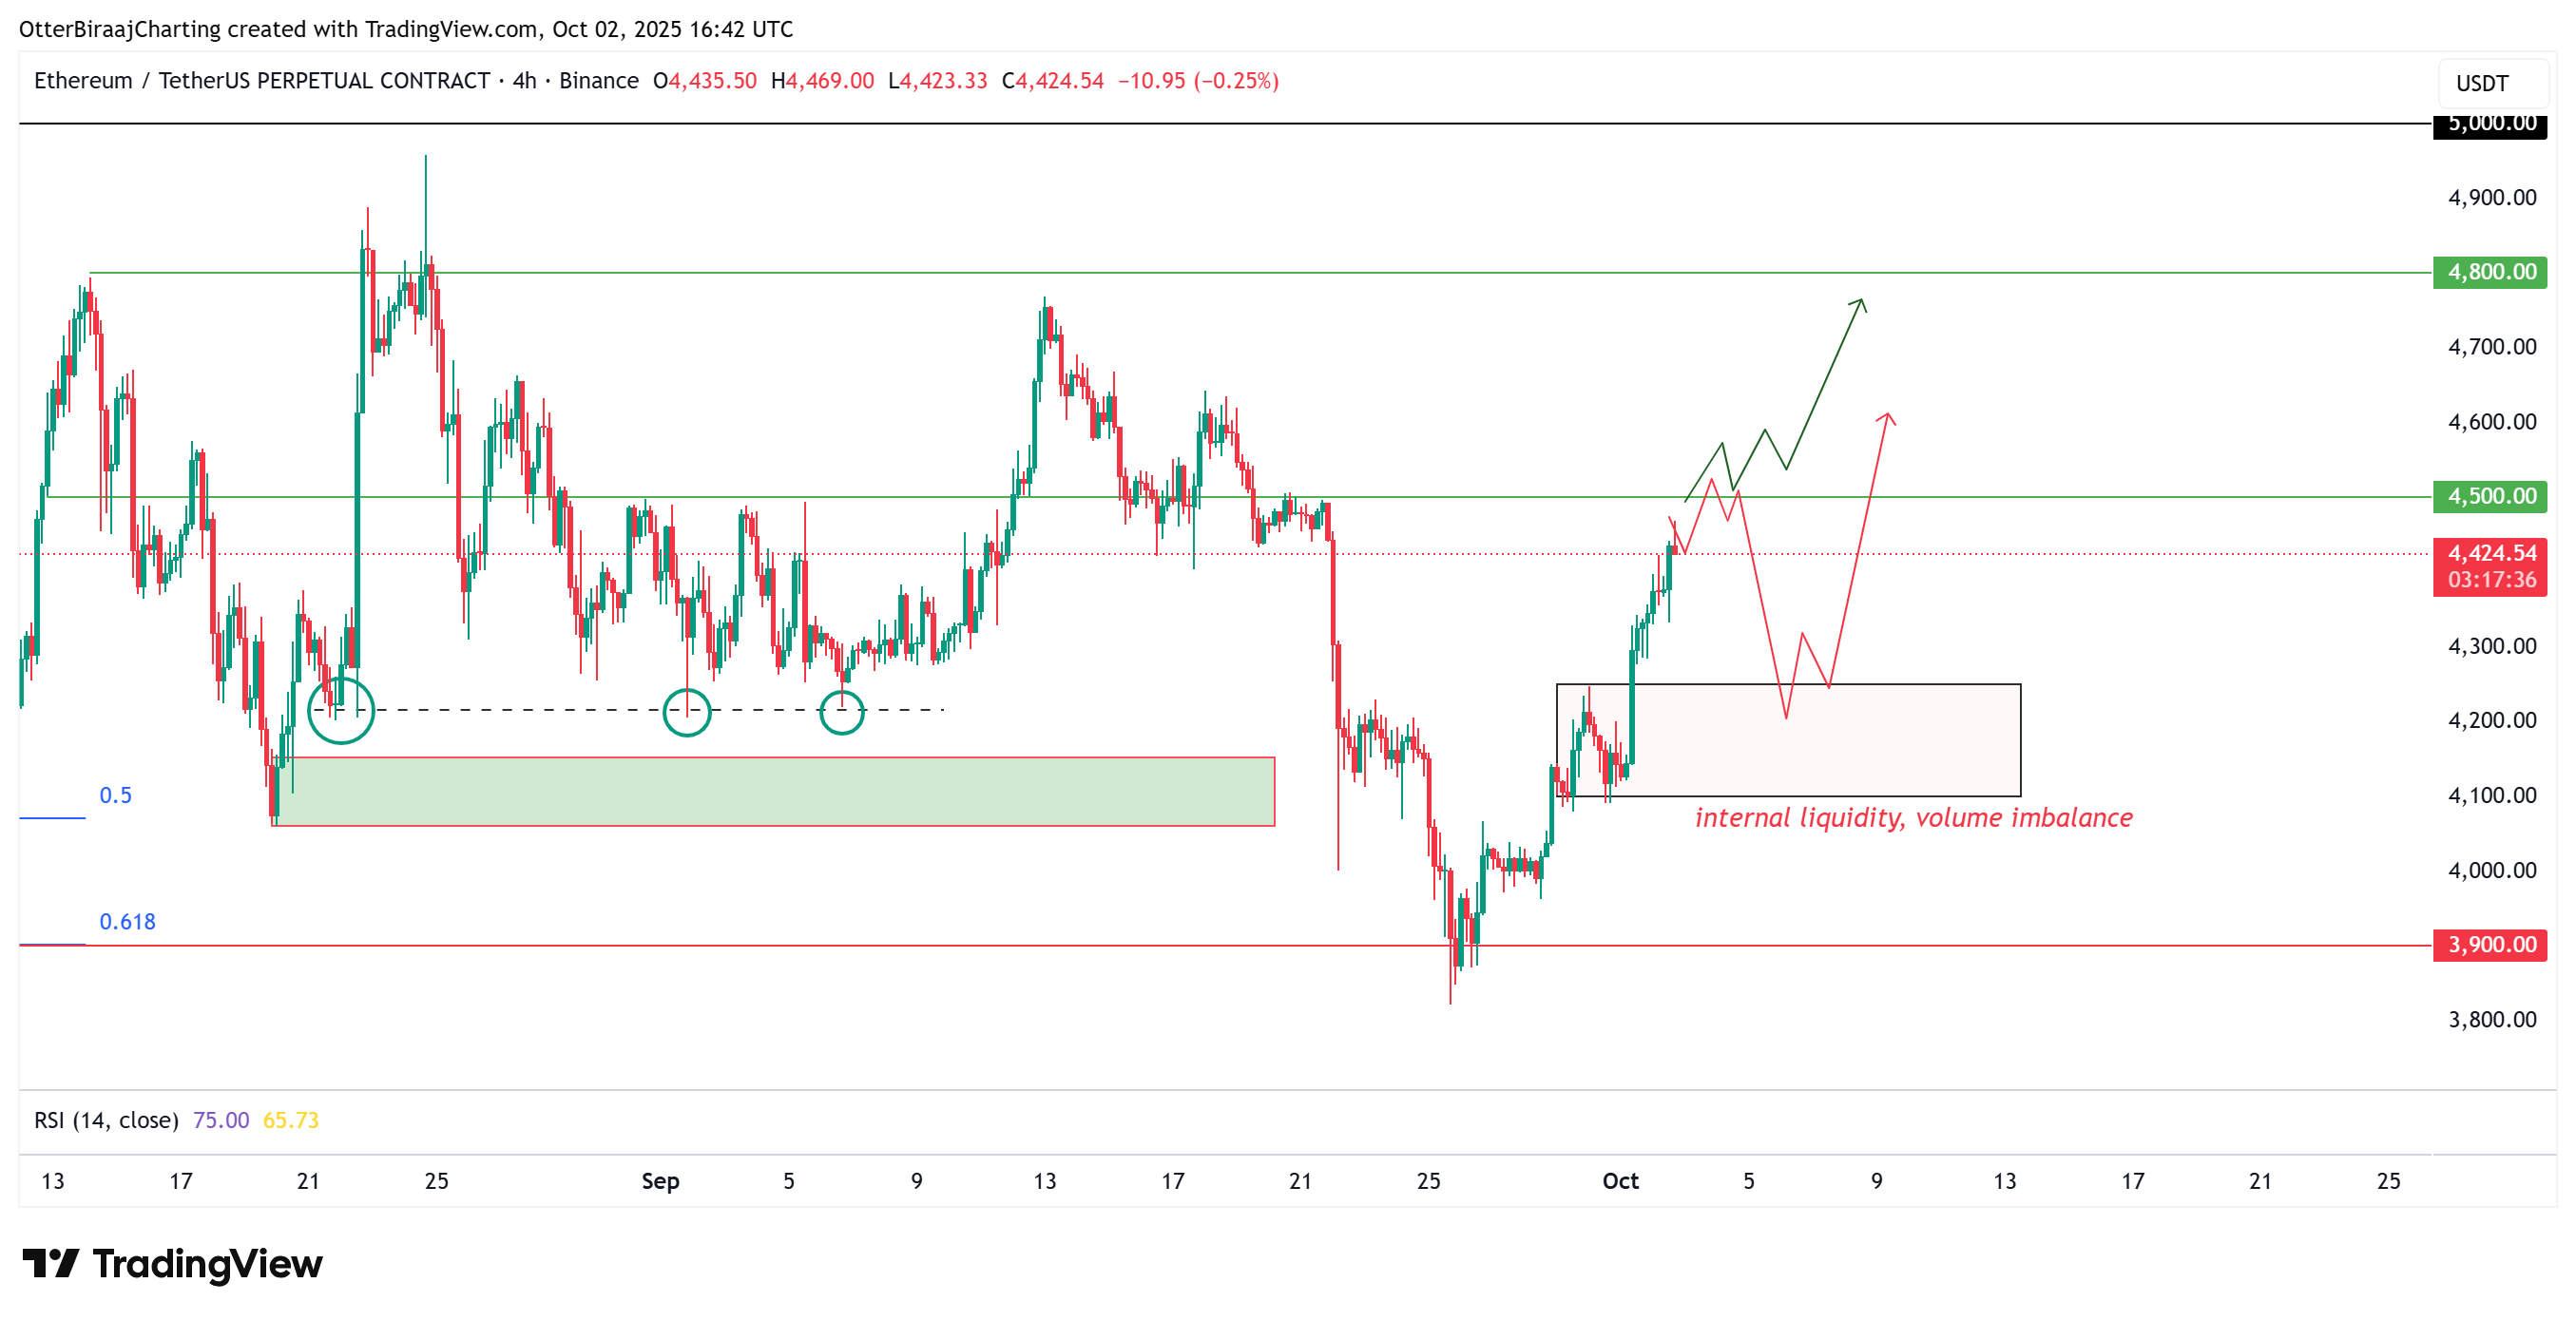
The latest structure exhibited a similar trajectory. Ether buyers accumulated between $4,800 and $4,200 before a swift drop pushed the price briefly below $4,000. Market analysis interprets this move as a deliberate liquidity sweep or stop-hunt, clearing external liquidity around $4,180, a level already flagged in earlier analysis.
The retracement, which aligned with a daily fair value gap (FVG), has reinforced the bullish narrative rather than undermining it, with the move possibly a repeat of the Q2 setup.
Momentum indicators are also lending strength to this outlook. Both the 25-day and 50-day simple moving averages are acting as near-term resistance, with the next critical step being a decisive daily close above $4,500. Securing this level would provide Ether with a solid base for its next advance.
From here, analysts expect a potential 80–100% breakout as Q4 unfolds, echoing the magnitude of gains seen earlier in the year. With its recent low below $3,900 looking increasingly like a floor price, Ether may be preparing to test new highs in the coming weeks.
Related: Ethereum’s ‘bull flag’ targets $10K as ETF demand returns
Ether derivatives and spot flows
Ether’s open interest (OI) and futures cumulative volume delta (CVD) have risen only marginally while price gained roughly 15% in a week, implying the advance is not yet leverage-driven and reducing the risk of forced-long liquidations if momentum stalls, but also suggesting room for OI expansion to fuel a secondary leg should spot demand persist.
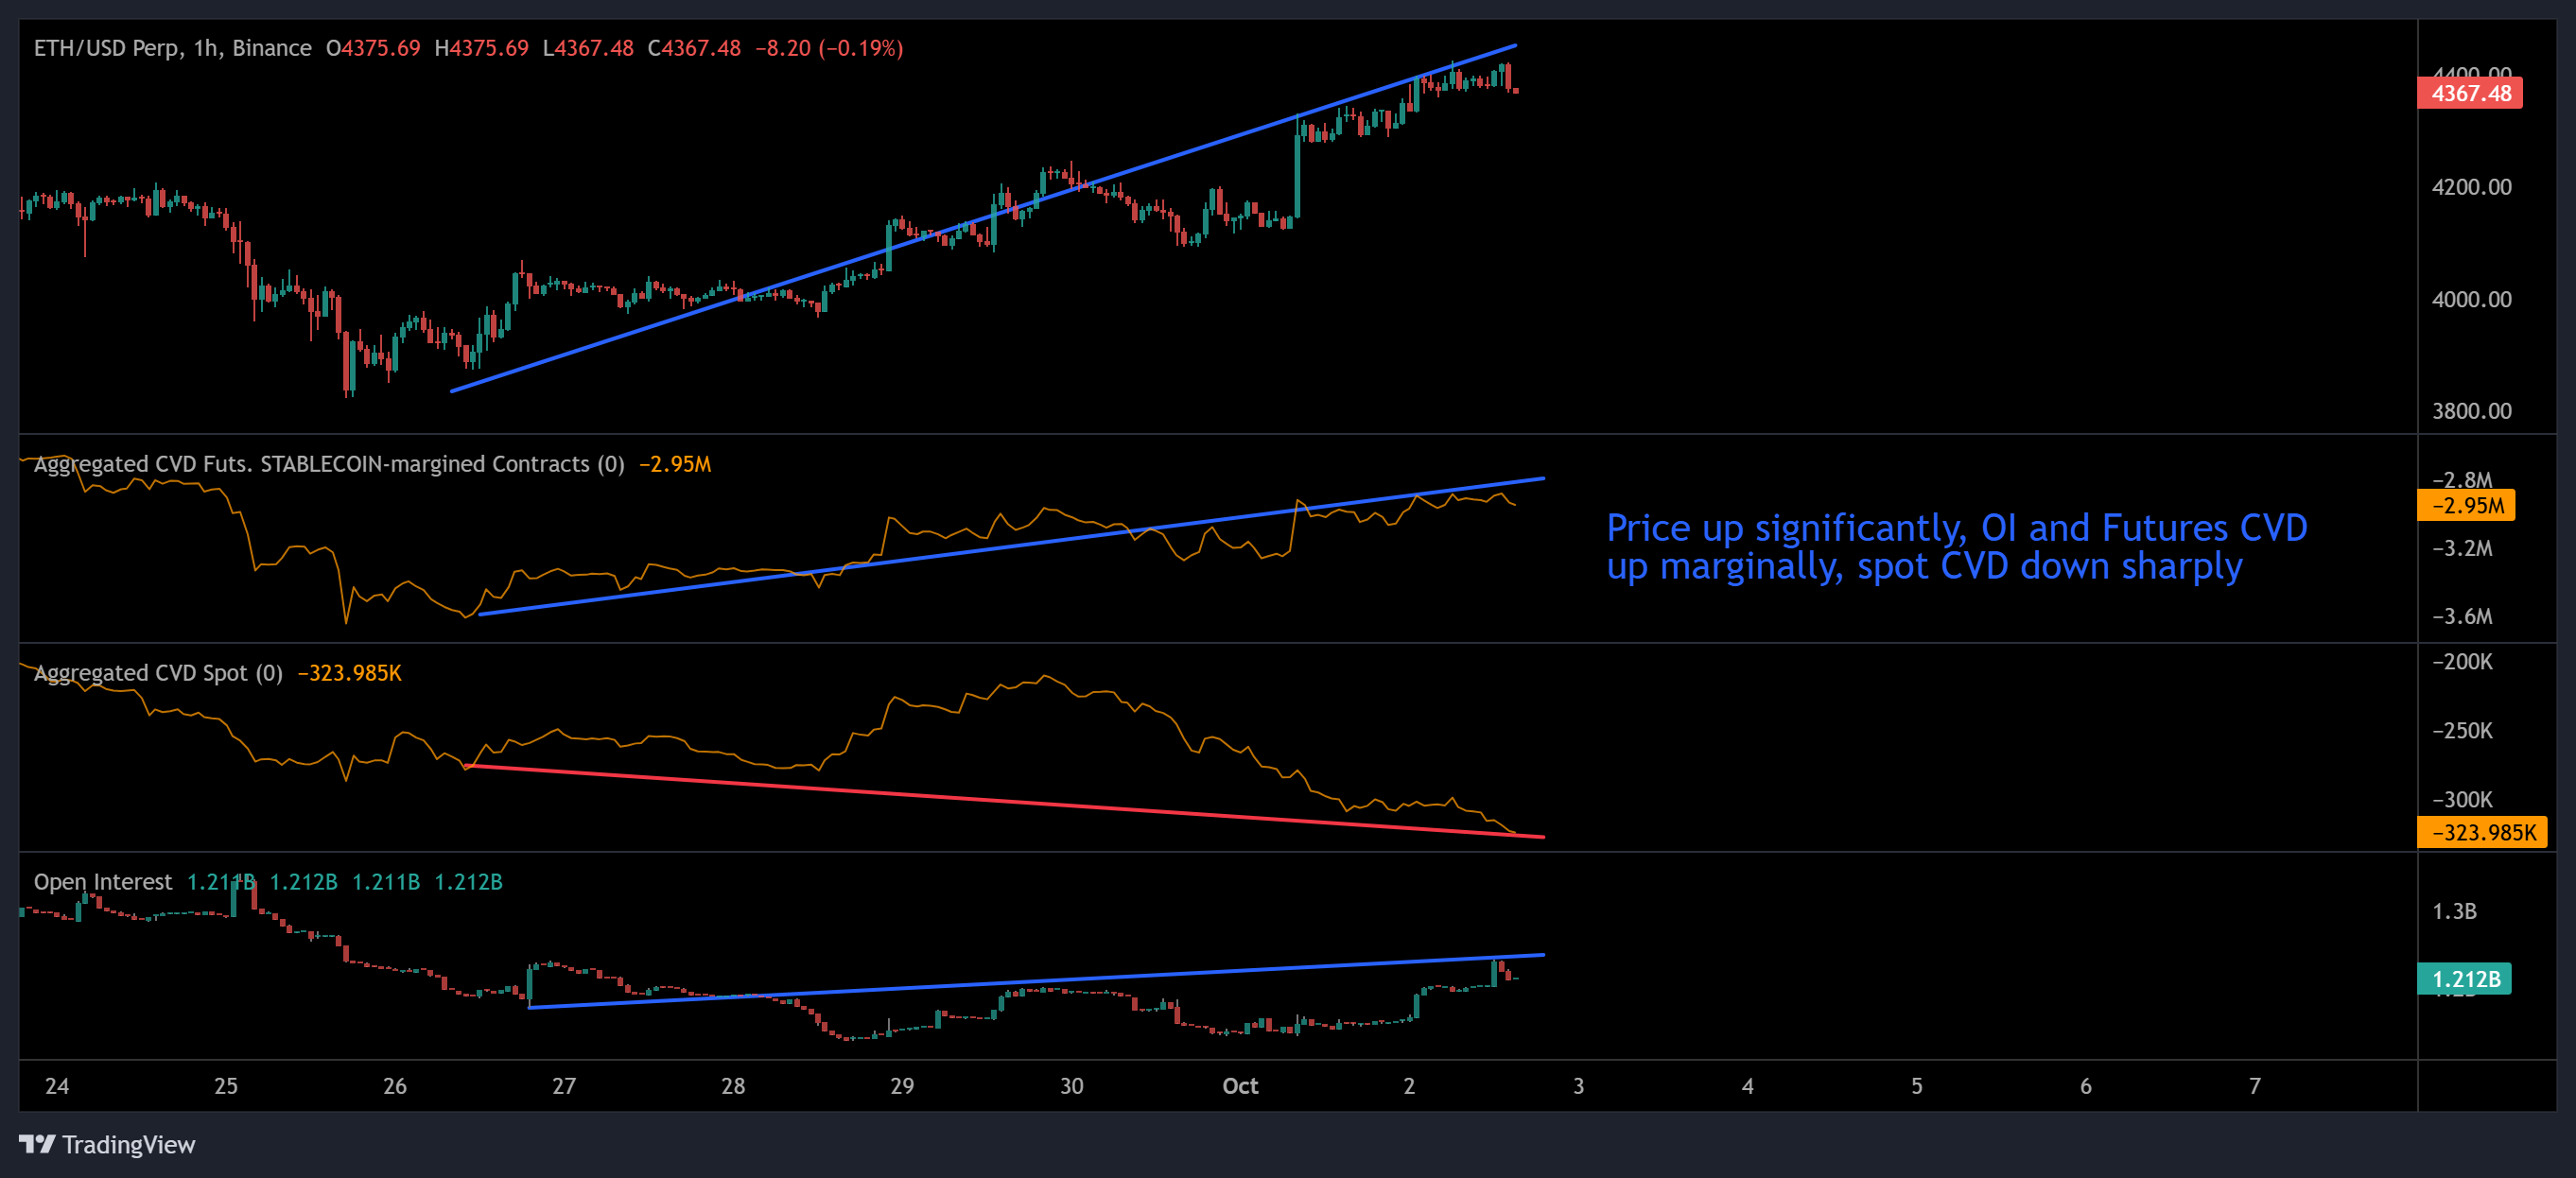
Contrarily, a significant drop in spot CVD during the rise indicated net aggressive sellers on spot into strength, a classic bearish divergence that can reflect absorption by passive bids or distribution from larger holders, often preceding whipsaw volatility if support is tested. If absorption continues and price holds above reclaim levels between $4,200 to $4,400, sidelined leveraged traders could re-enter and extend the trend with controlled volatility.
However, if bullish absorption fades, the divergence raises pullback risk and the probability of sharp mean-reversion dips as liquidity pockets get swept before the trend continues to move upward.
A near-term area of interest is defined between $4,100 and $4,250, where internal liquidity is densely clustered and volume inefficiencies are evident. The price previously moved sharply through this zone without achieving a balanced interaction between buyers and sellers. As such, if bullish momentum fails to sustain a push above $4,500 in the coming days, this zone could act as a key retracement target or support area for price re-entry.
Related: Solana may have an edge over Ethereum in staking ETFs, says Bitwise CEO
This article does not contain investment advice or recommendations. Every investment and trading move involves risk, and readers should conduct their own research when making a decision.
