


Ripple’s token continues to trade under pressure, but key technical levels are coming into focus. Both XRP/USDT and XRP/BTC pairs are sitting near important inflection zones that could define the next move.
Technical Analysis
By Shayan
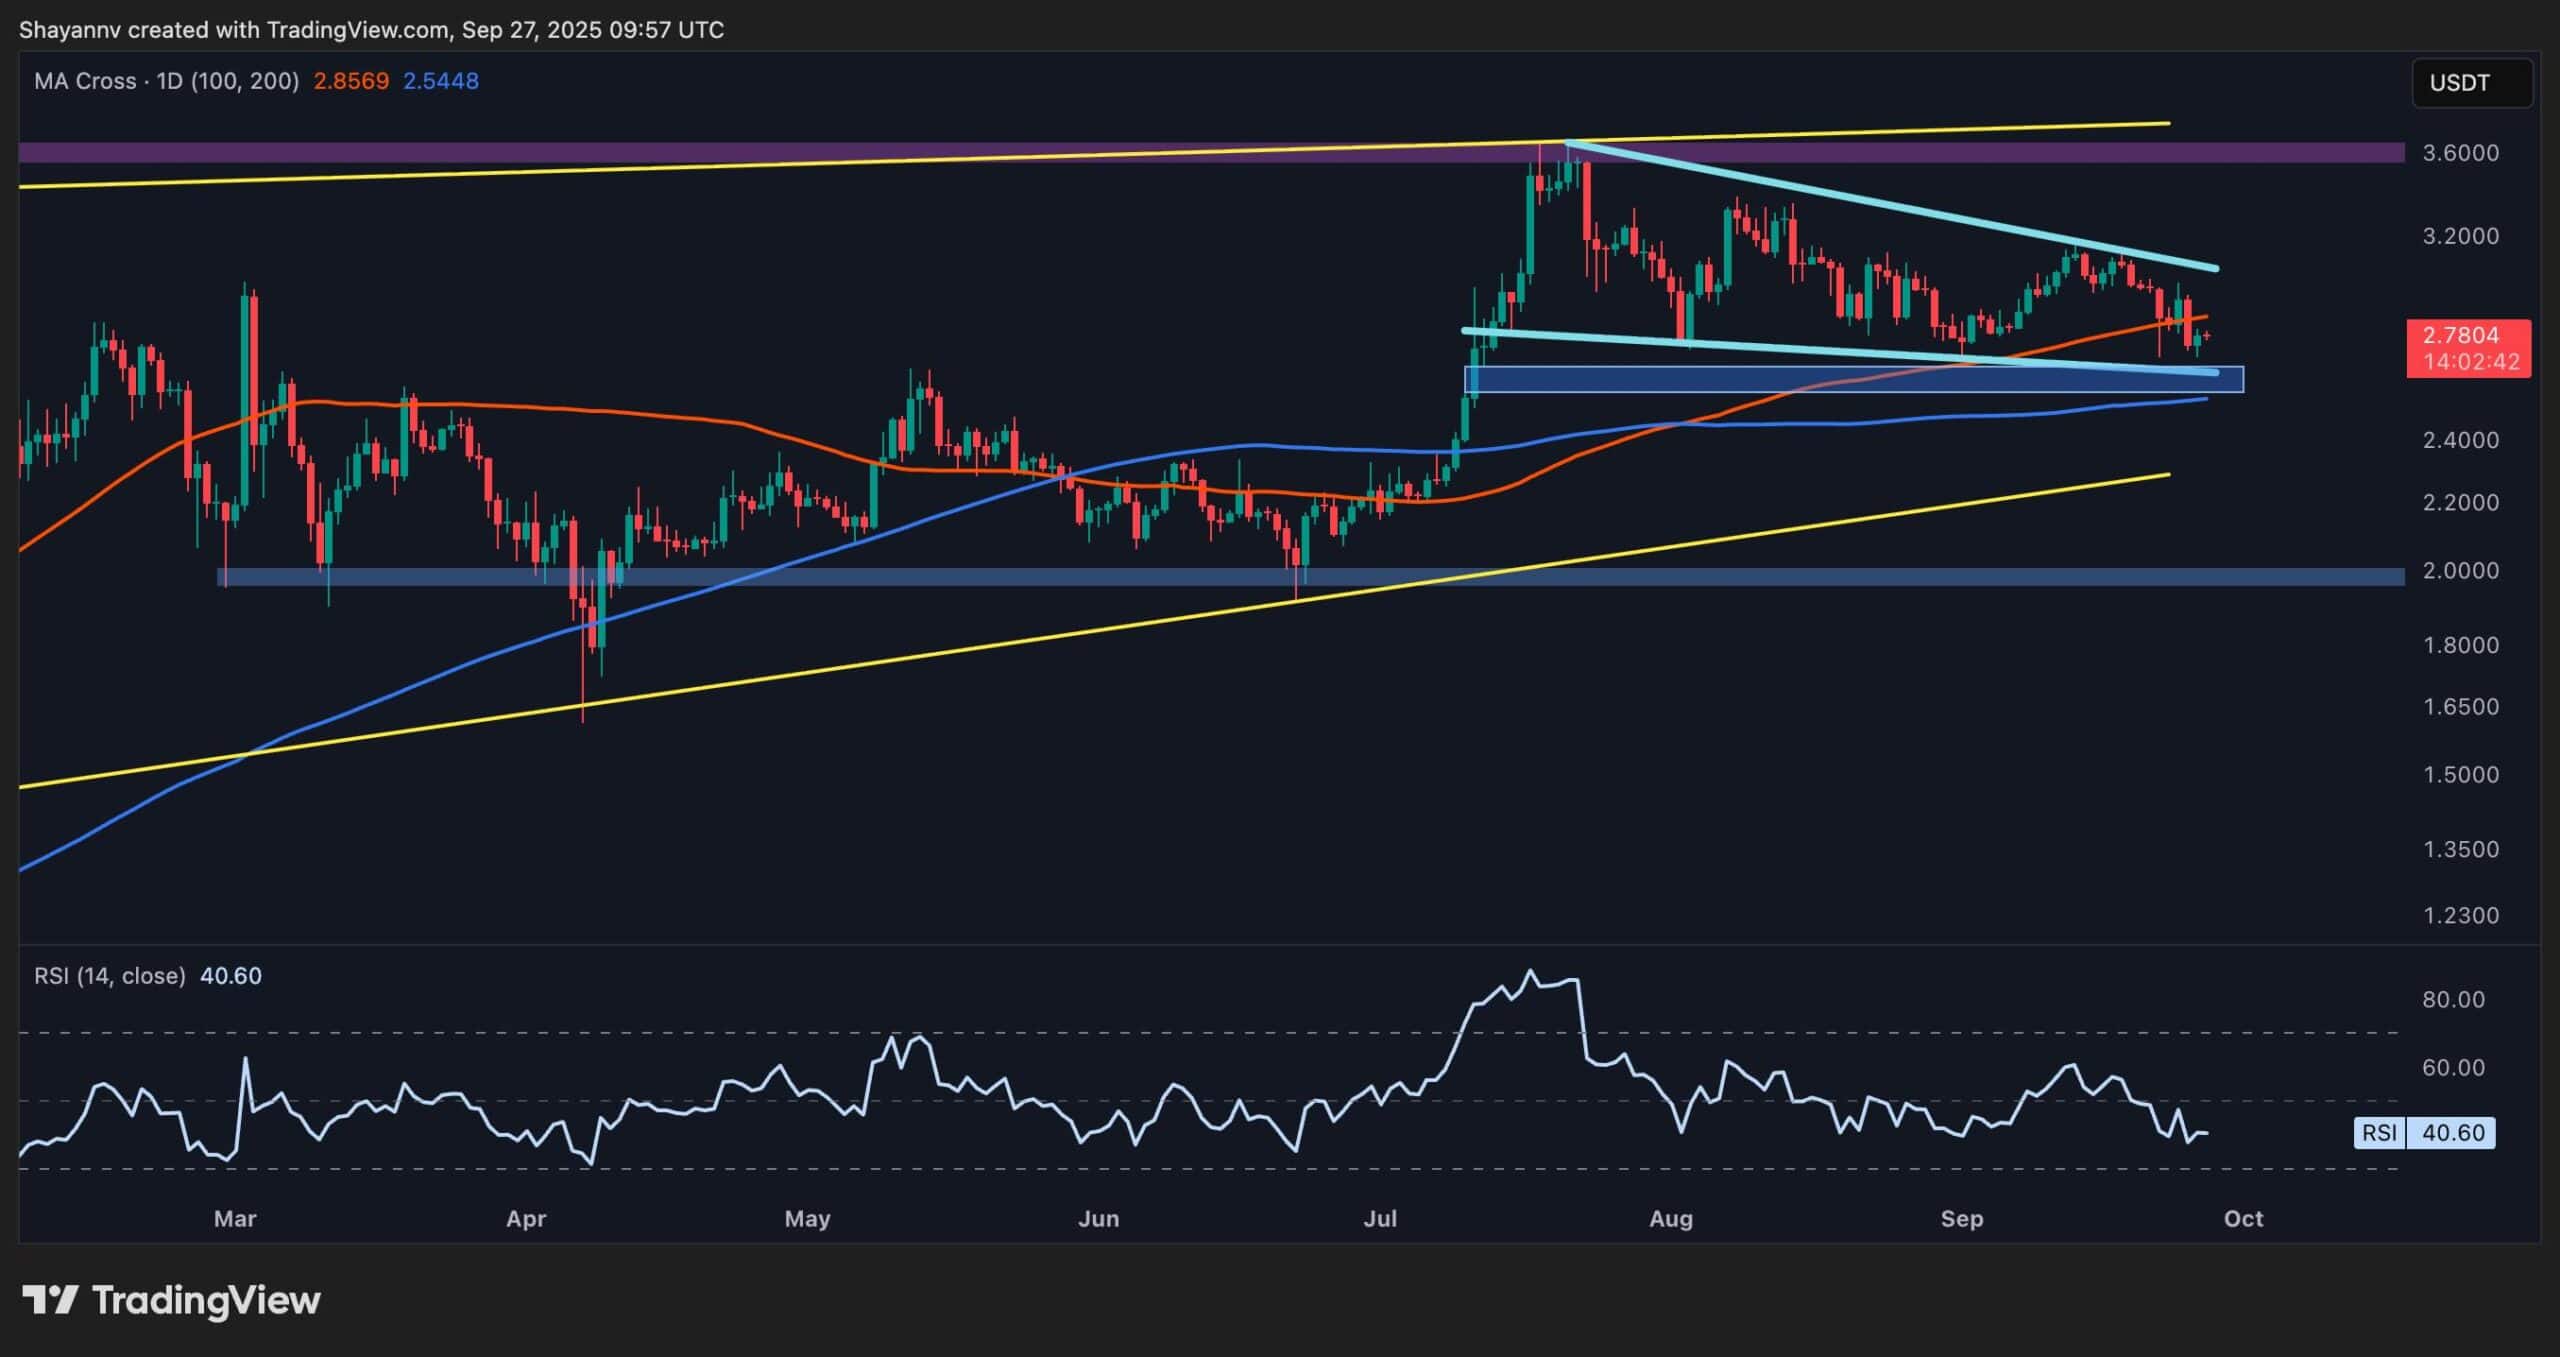
The USDT Pair
XRP has remained within a falling wedge structure, as the asset recently slipped below the 100-day moving average. The recent low at $2.75 is being tested again, and just below lies a more critical demand zone around $2.60, backed by the 200-day moving average, which is just below this area. This confluence makes it a make-or-break level for the buyers.
If this area holds, we could see a bounce and a potential challenge of the wedge’s upper boundary near $3.10. A breakout from the wedge would open the door toward the key $3.60 level. But if the support gives out, XRP could decline to the $2.20 zone, which aligns with the lower boundary of the large ascending structure.
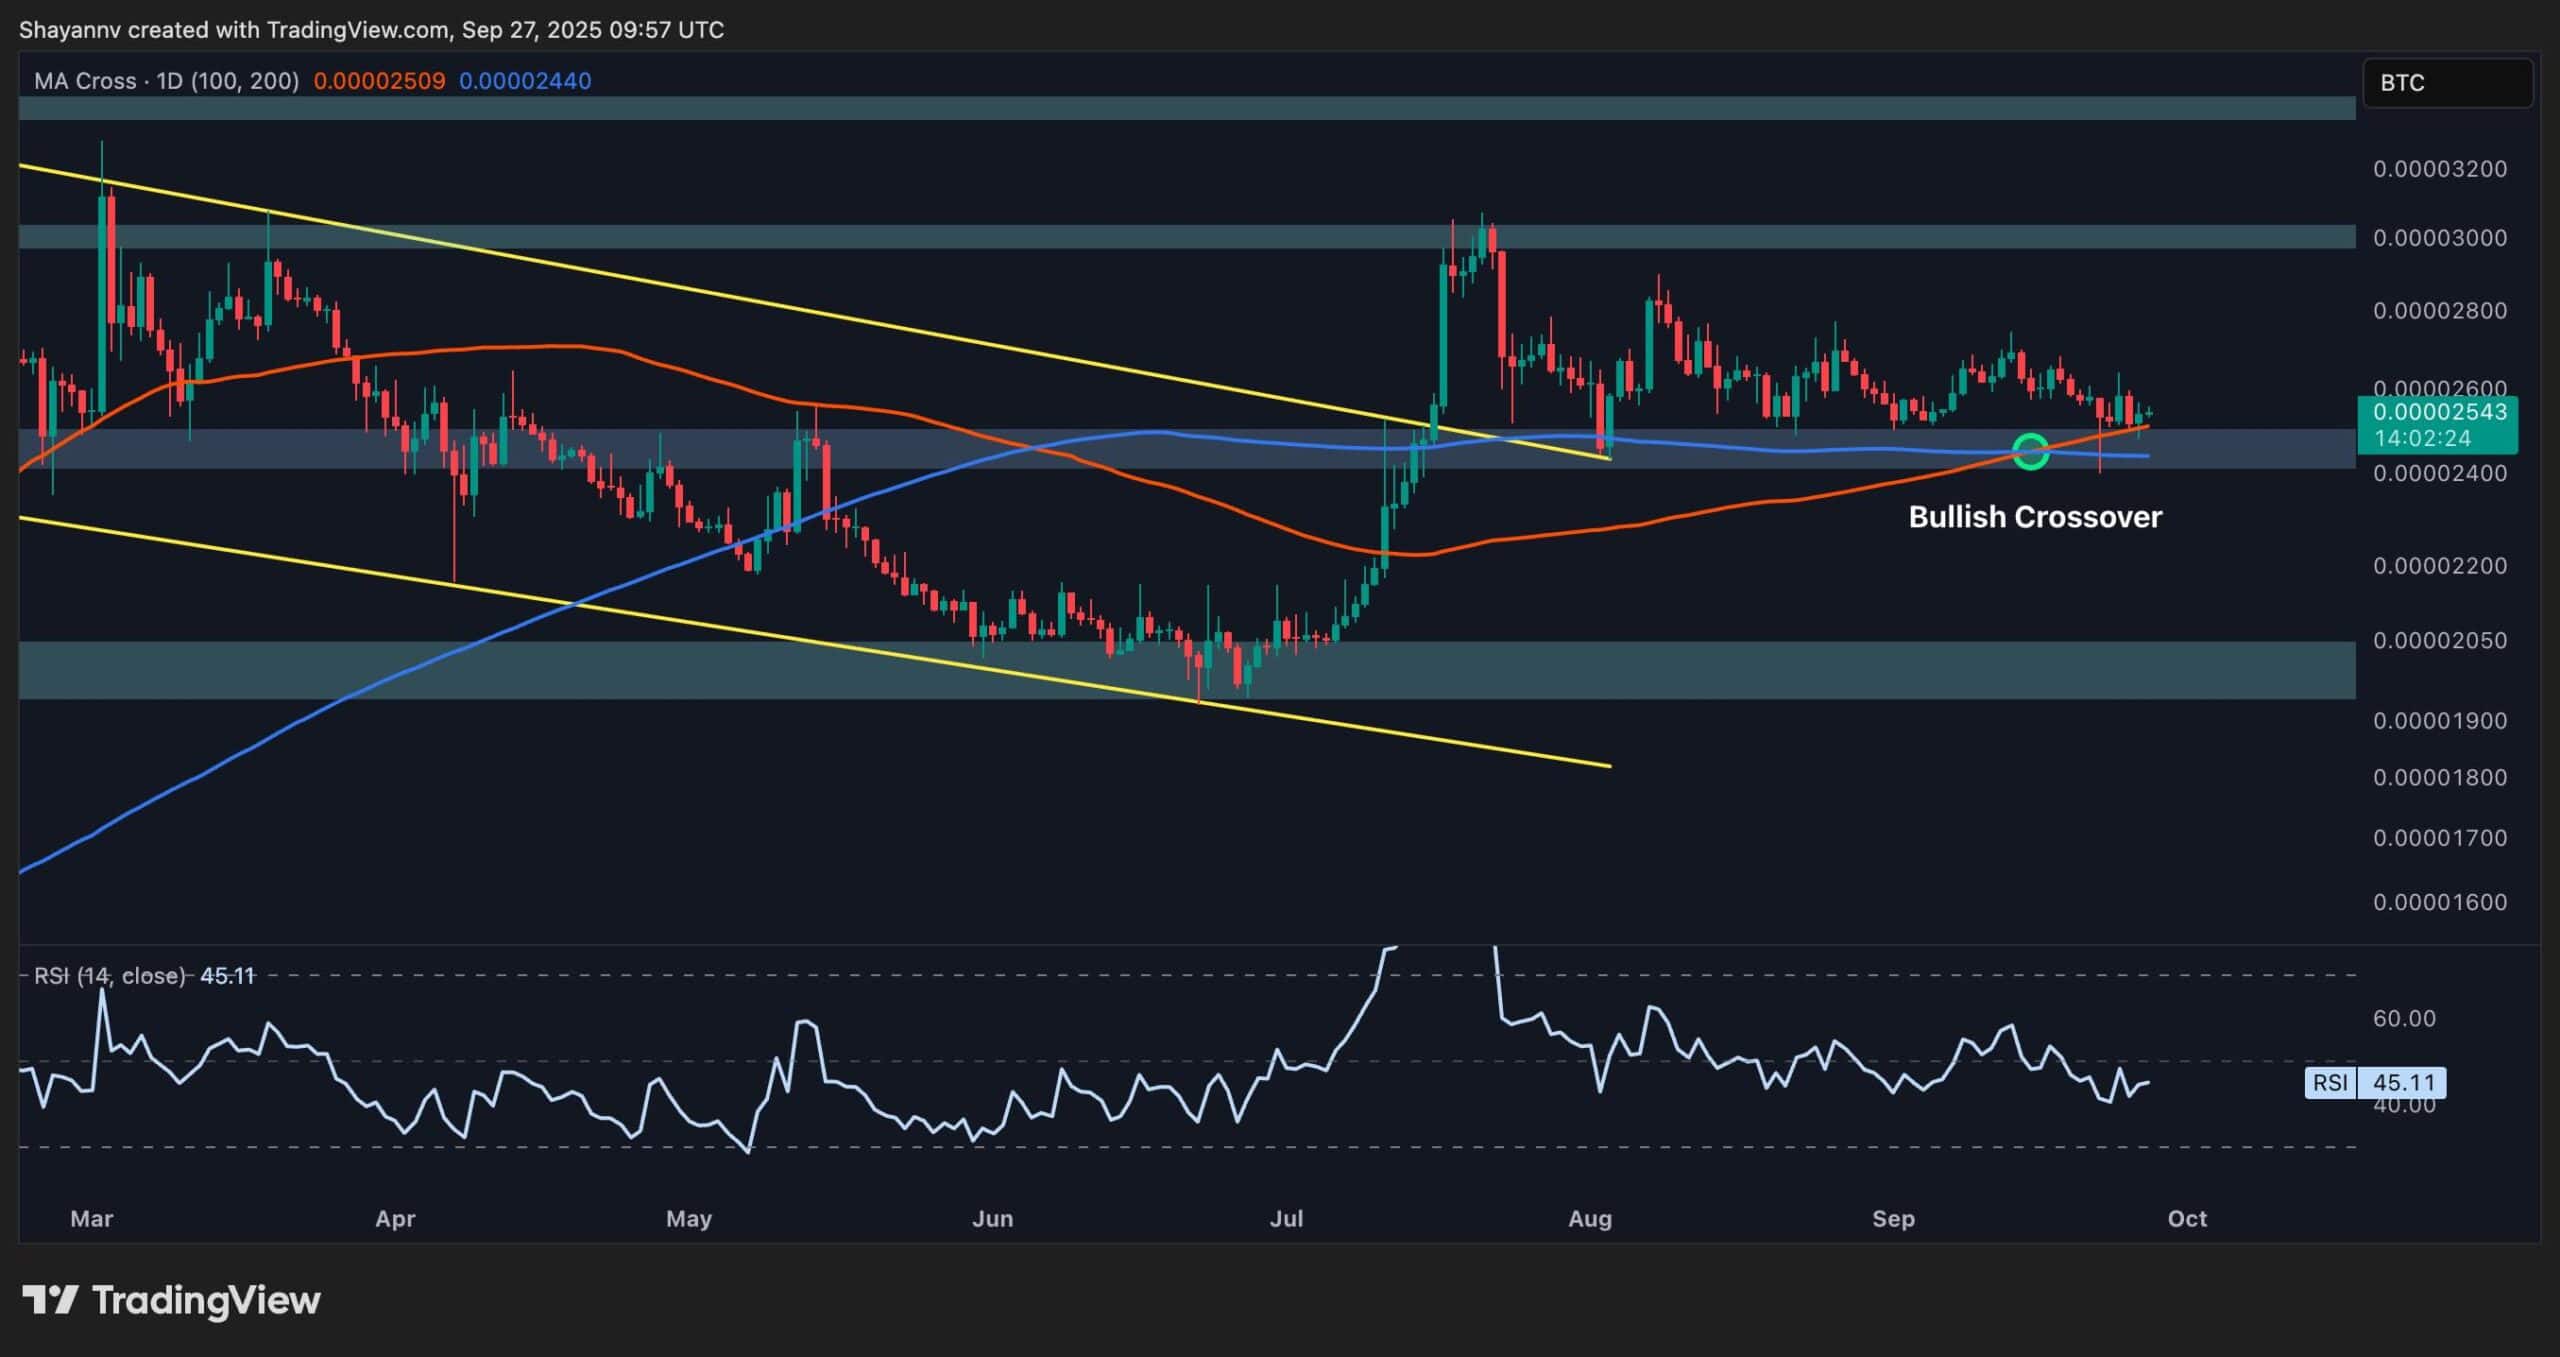
The BTC Pair
Moving on to the XRP/BTC chart, a bullish golden cross has occurred recently, as the 100-day MA pushed above the 200-day MA, but the asset hasn’t followed through yet. After a strong rally in July, the price has been moving sideways just above the 2,400 SAT support.
The consolidation above both MAs suggests underlying strength, but the buyers need to hold the 2,400 SAT zone to prevent a deeper pullback. A clean break above the 2,800 SAT zone, which aligns with recent consolidation highs, could kick off the next leg higher, targeting the 3,000 SAT region once again.
Otherwise, losing support may drag the pair toward the 2,000 SAT zone, shifting the overall market structure bearish. As a result, the 2,400 SAT zone remains a critical level for the investors to defend in the short term.
Binance Free $600 (CryptoPotato Exclusive): Use this link to register a new account and receive $600 exclusive welcome offer on Binance (full details).
LIMITED OFFER for CryptoPotato readers at Bybit: Use this link to register and open a $500 FREE position on any coin!
Disclaimer: Information found on CryptoPotato is those of writers quoted. It does not represent the opinions of CryptoPotato on whether to buy, sell, or hold any investments. You are advised to conduct your own research before making any investment decisions. Use provided information at your own risk. See Disclaimer for more information.
Cryptocurrency charts by TradingView.
