


Key points:
-
Key Bitcoin price levels above and below spot price are here as BTC is about to start a new week.
-
A quiet weekend is slated to give way to volatility as fresh macro catalysts appear.
-
A “busy week” will see the release of the Federal Reserve’s favorite US inflation gauge.
Bitcoin (BTC) kept traders guessing into Sunday’s weekly close as analysis focused on the final resistance before all-time highs.
BTC price wedged between crunch levels
Data from Cointelegraph Markets Pro and TradingView showed BTC/USD hovering below $116,000.
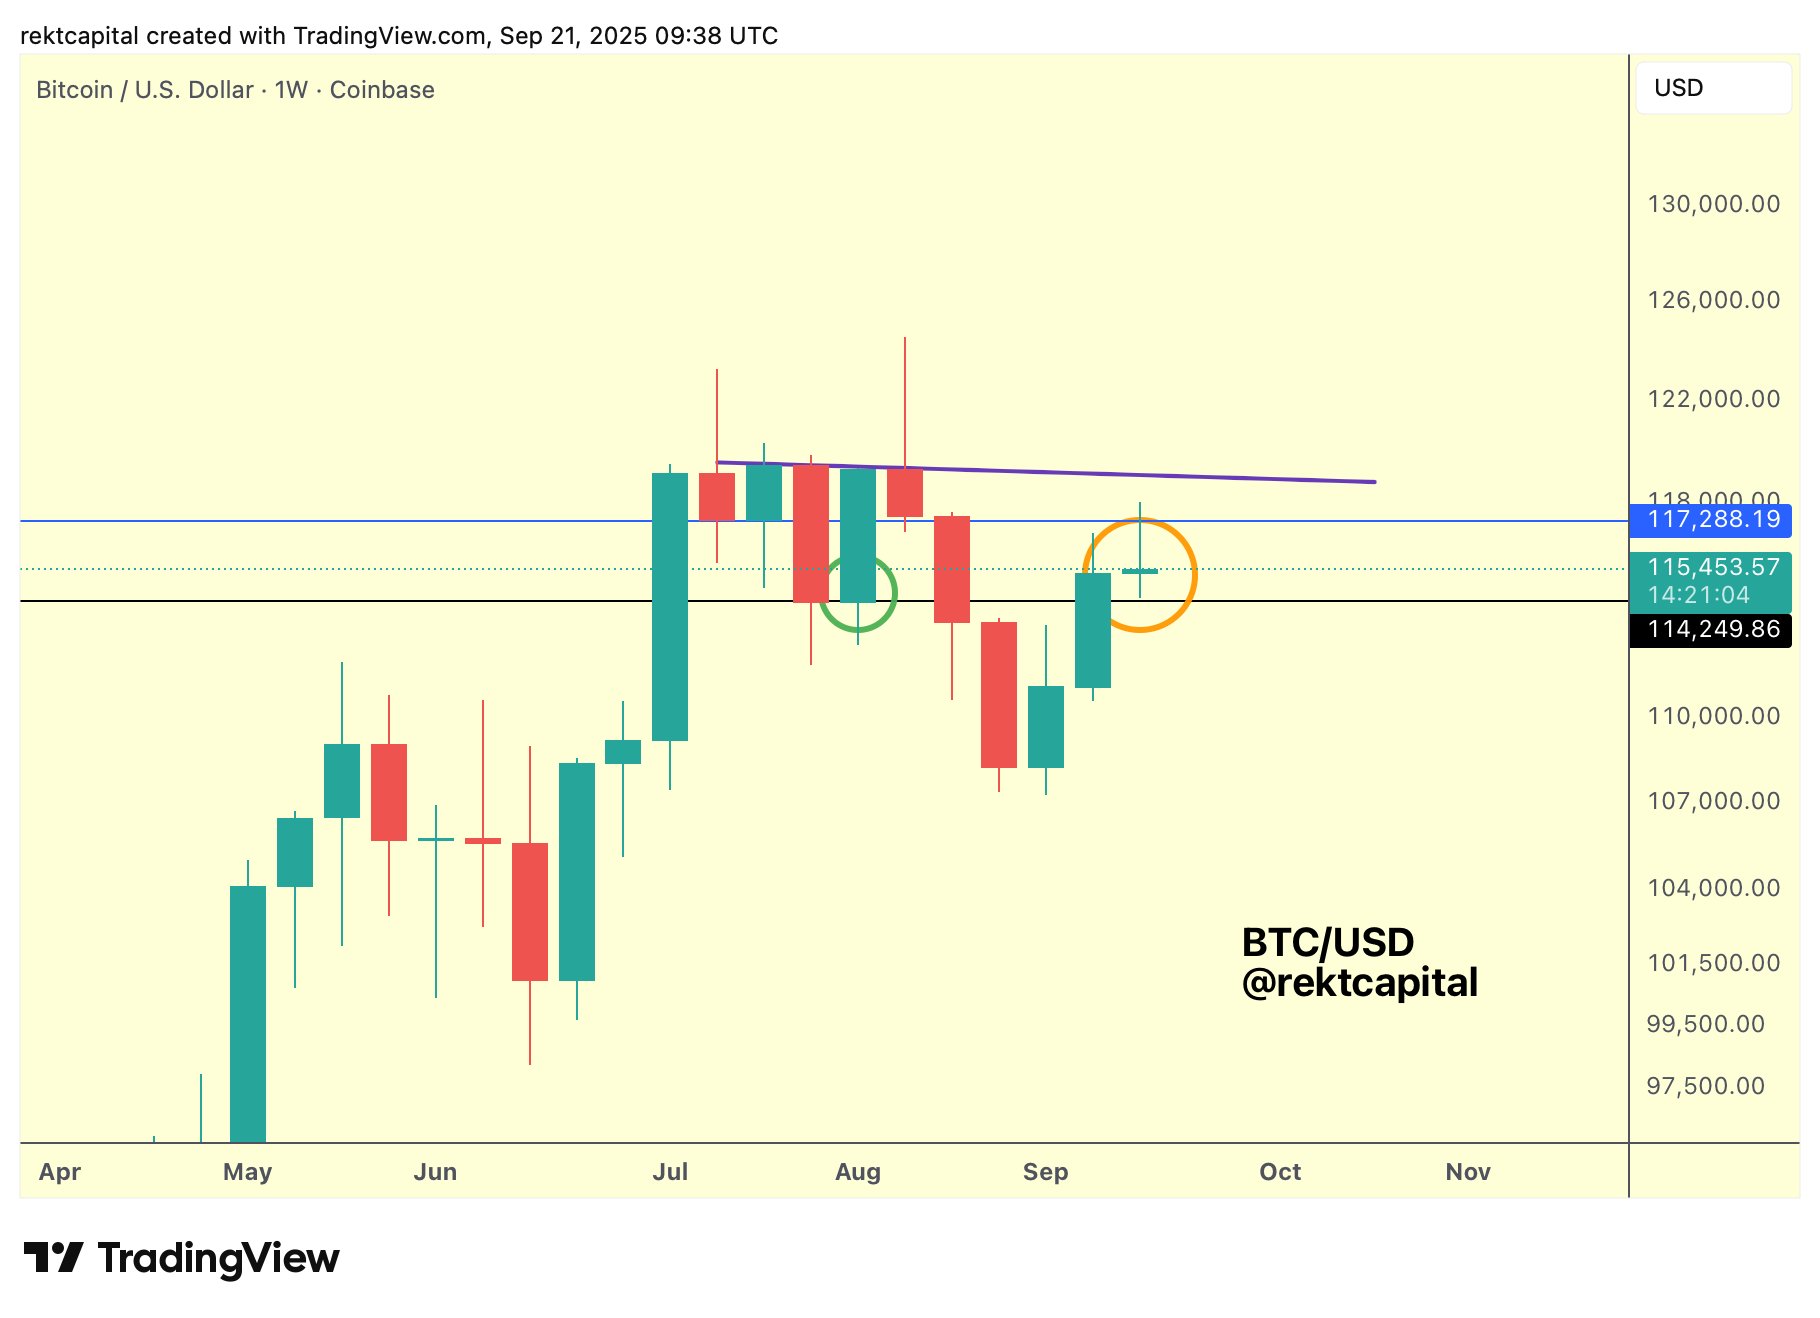
This meant that the price remained wedged between support and resistance at $114,000 and $117,200, respectively.
As Cointelegraph reported, both levels were on the radar throughout last week as price reacted to US macroeconomic volatility triggers.
“The retest of $114k (black) into support continues to be successful but there is resistance at ~$117.2k (blue),” popular trader and analyst Rekt Capital summarized while uploading a corresponding chart to X on the day.
“This makes for a range-bound construction and we’ll soon find out how weak or strong a resistance $117.2k really is.”
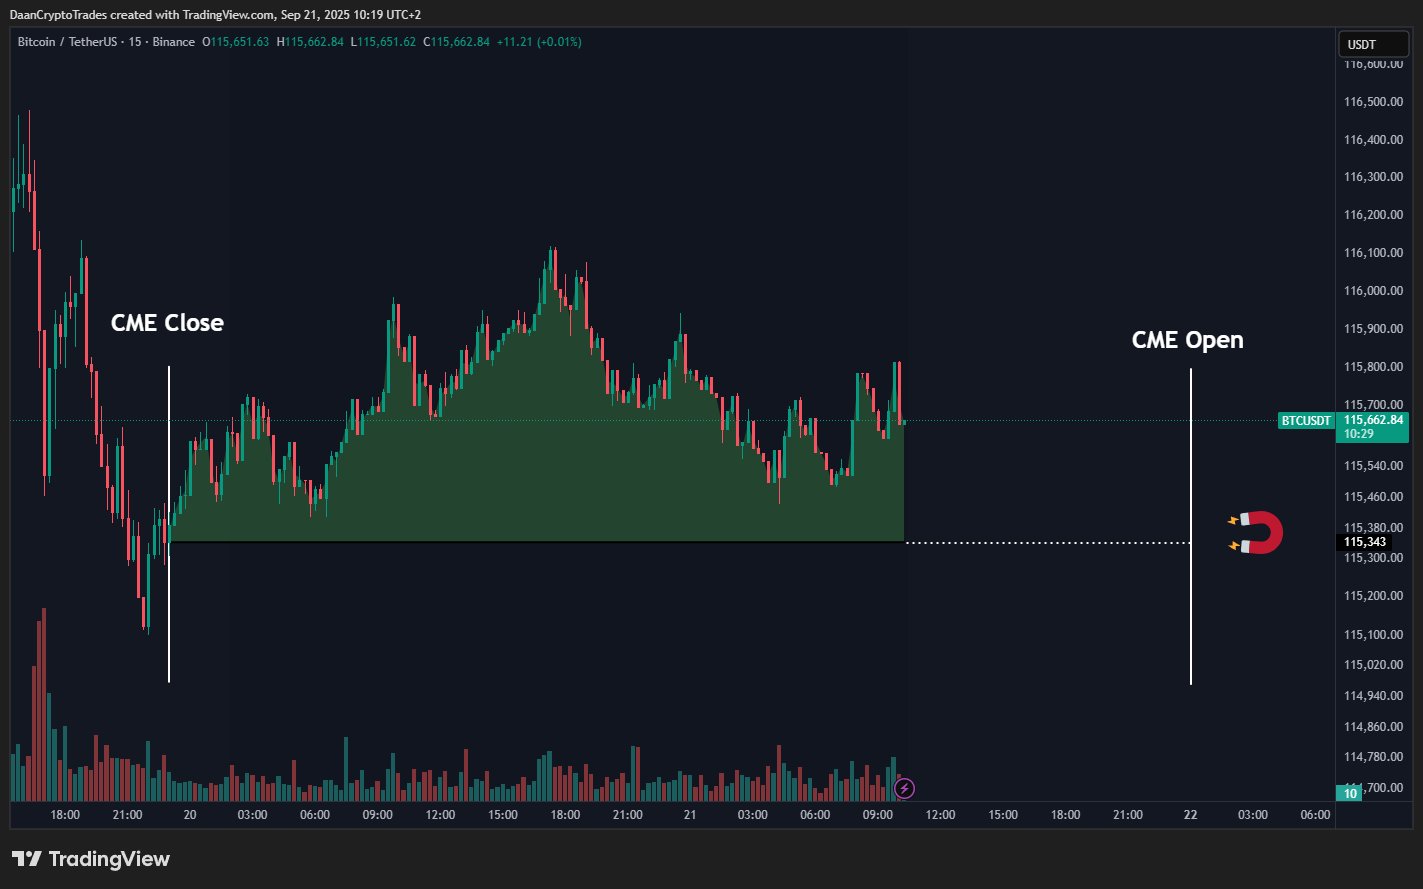
Fellow trader Daan Crypto Trades had an expanded view, focusing on $112,000 and $118,000 for market cues.
“Very little happening indeed. It’s now the 4th weekend in a row where we have seen little volatility and likely no gap being created,” he acknowledged, referring to weekend “gaps” in CME Group’s Bitcoin futures market.
“We’ll see where this wants to go next week. Main short term levels for me to watch are $112K & $118K.”
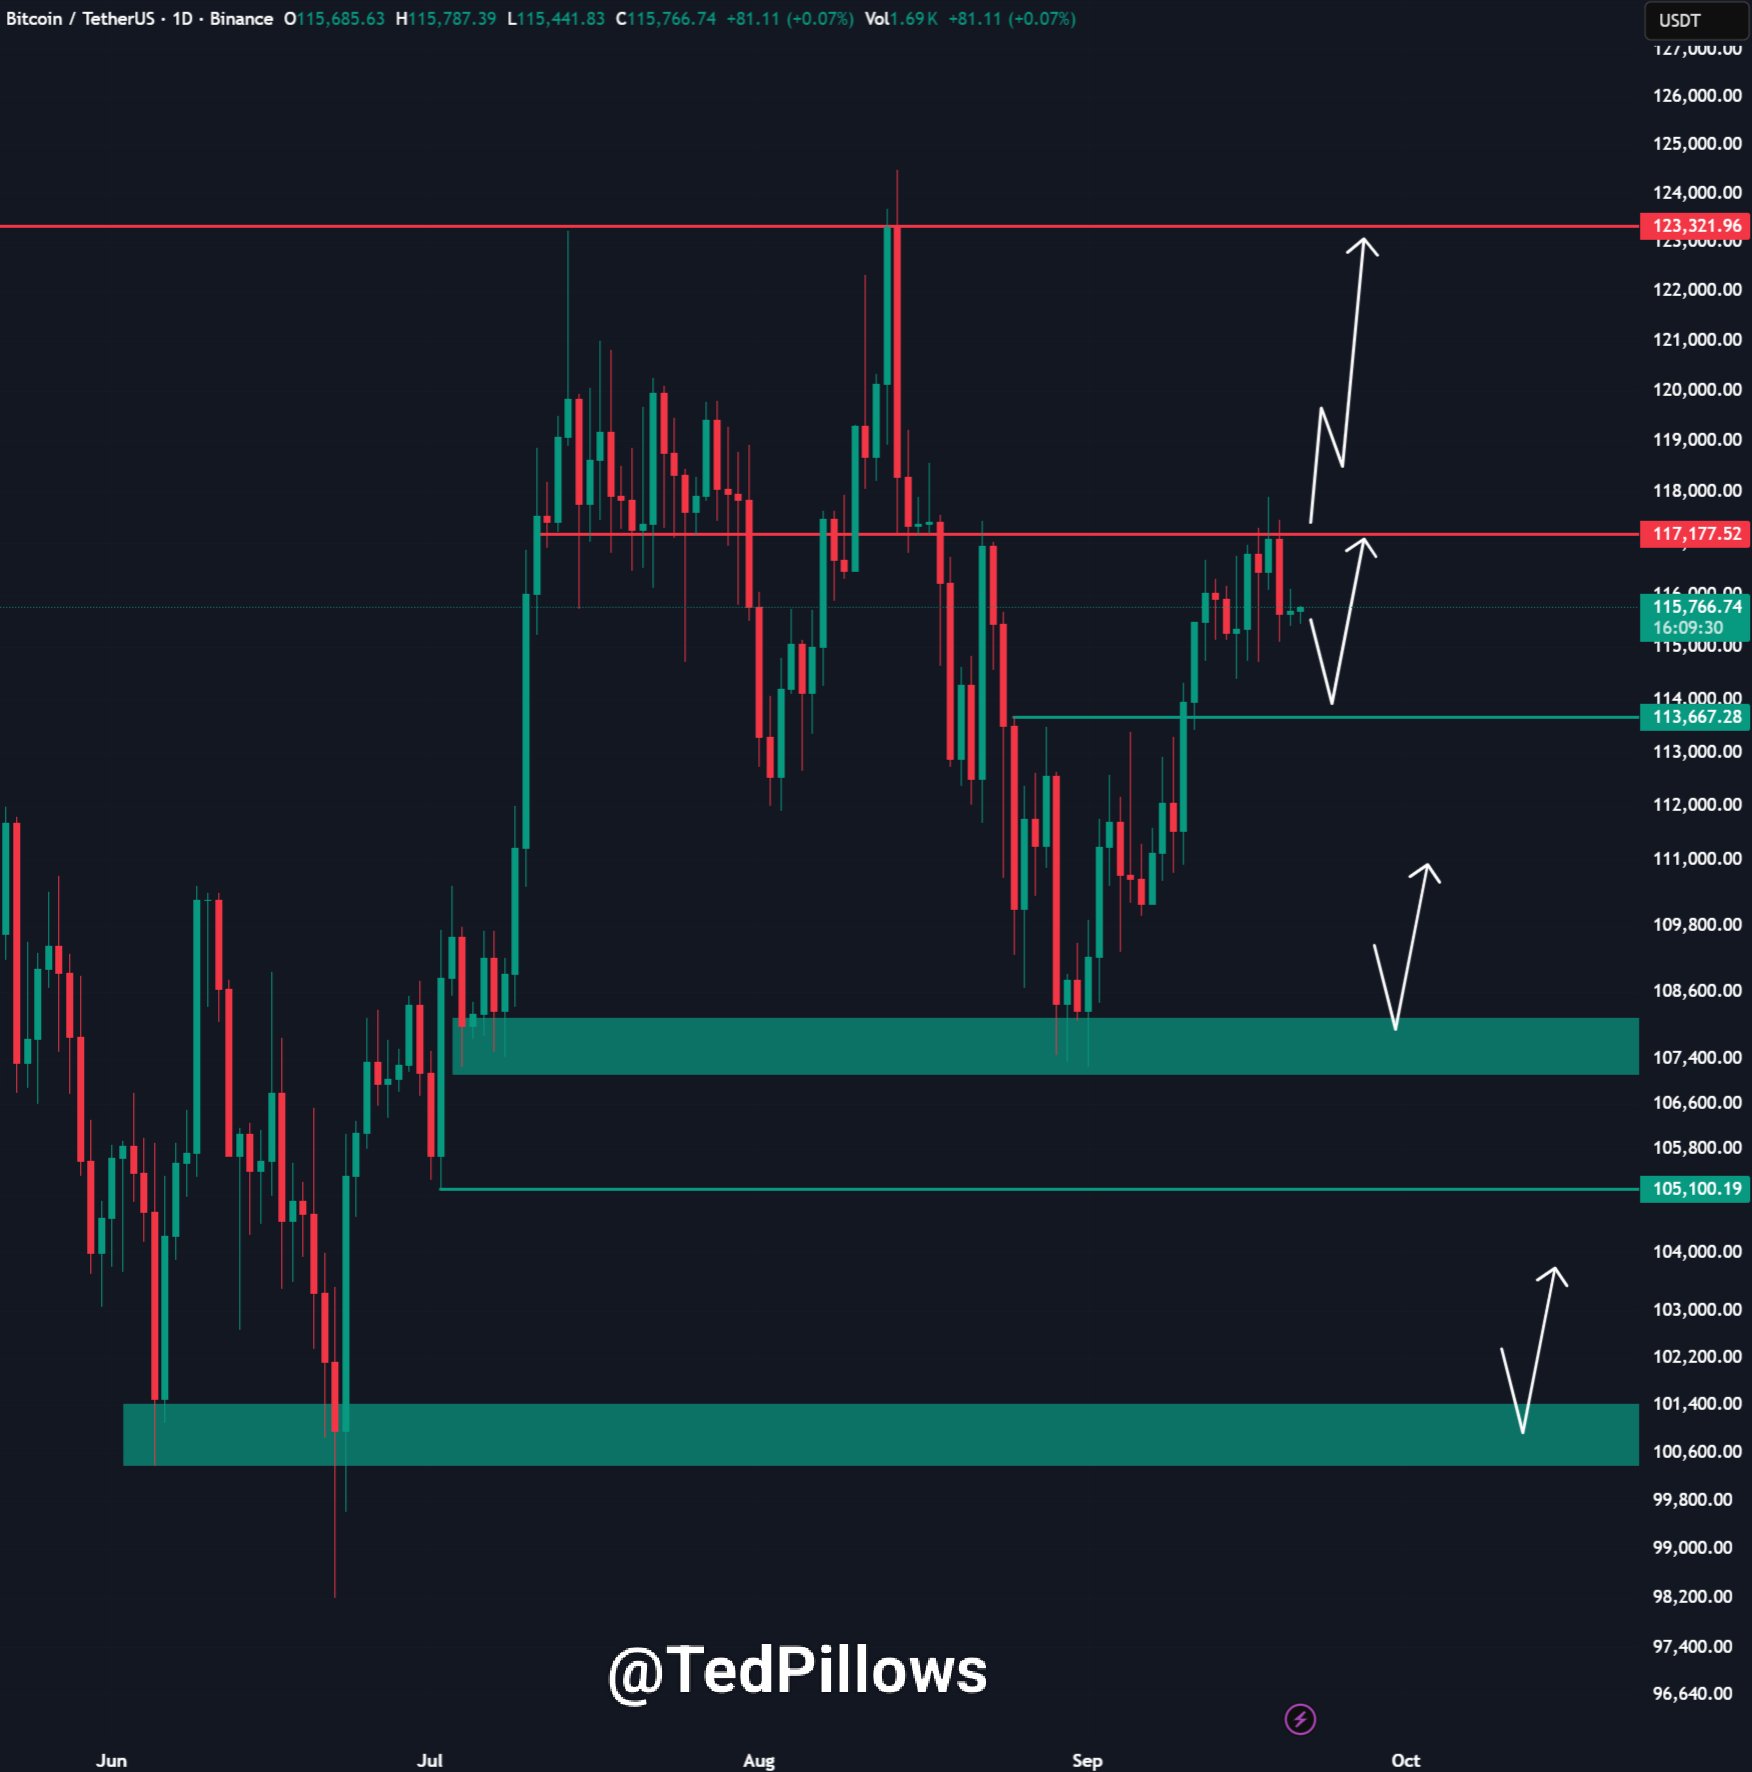
Crypto investor and entrepreneur Ted Pillows agreed on the lack of movement on BTC/USD.
“It has been consolidating around the $116,000 level for some time now,” part of an X post stated.
“If bulls are able to push Bitcoin above the $117,000 region, a rally could happen. Otherwise the plan will be a dump followed by a rally in Q4.”
Bitcoin faces new week of Fed volatility triggers
The macro outlook looked set to provide more volatility for crypto and risk assets into the end of September.
Related: Bitcoin price $150K target comes as analyst sees weeks to all-time highs
The US Federal Reserve’s “preferred” inflation gauge, the Personal Consumption Expenditures (PCE) index, was due out on Sept. 26.
Various Fed officials, including Chair Jerome Powell, were due to speak throughout the week, just days after they voted to enact the first interest-rate cut of 2025.
“We have another busy week ahead,” trading resource The Kobeissi Letter commented in an X thread on the topic.
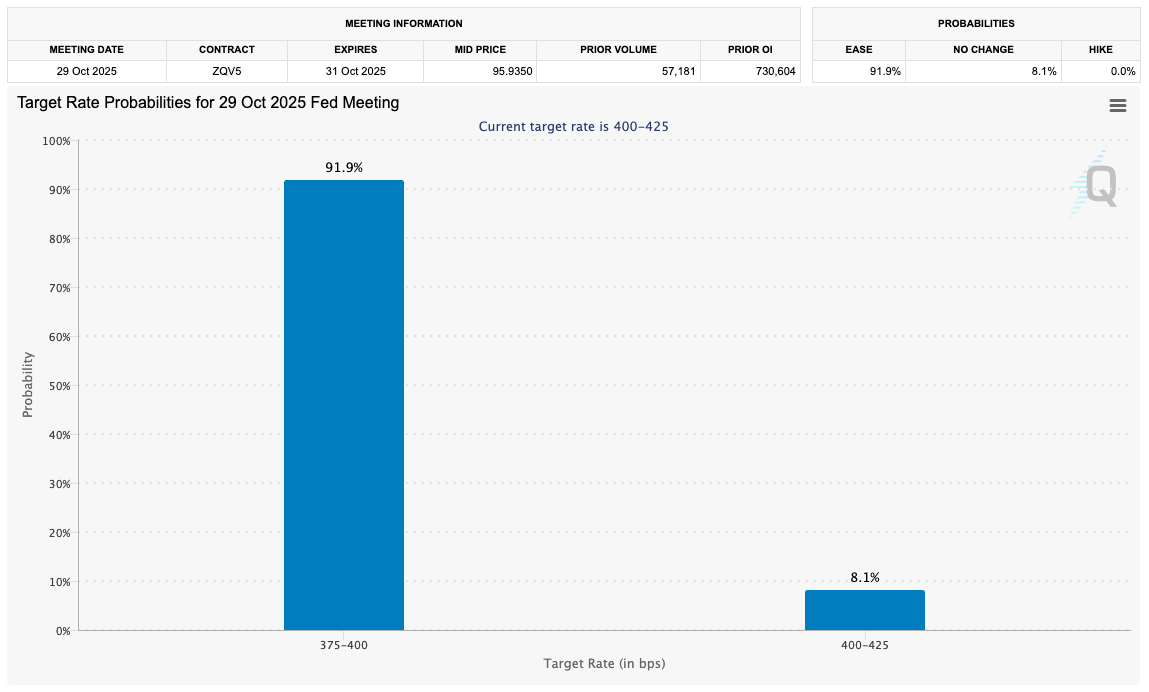
Kobeissi noted that markets would be looking for hints as to future Fed policy in the upcoming macro data, with its next interest-rate decision due on Oct. 29.
Data from CME Group’s FedWatch Tool showed markets overwhelmingly confident that another 0.25% cut would result.
This article does not contain investment advice or recommendations. Every investment and trading move involves risk, and readers should conduct their own research when making a decision.
