


Key takeaways:
-
ADA technical chart setups converge on a price target around $1.25.
-
Cardano’s open interest has rallied to a record high of $1.95 billion, signaling high speculative interest.
Cardano (ADA) is flashing multiple technical and onchain signals, suggesting that a rally to $1.25 is possible over the next few days or weeks. Here are several charts making the case for a near-term breakout.
ADA price symmetrical triangle targets $1.25
Data from Cointelegraph Markets Pro and TradingView showed Cardano’s price trading within a symmetrical triangle in the daily time frame, as seen in the chart below.
Related: Price predictions 9/15: SPX, DXY, BTC, ETH, XRP, SOL, BNB, DOGE, ADA, HYPE
The price needs to close above the upper trendline of the triangle at $0.925 to continue the upward trajectory, with a measured target of $1.25.
Such a move would bring the total gains to 38% from the current level.
The relative strength index has increased from 40 to 55 since early August, suggesting a steady build-up in bullish momentum.
Cardano’s cup-and-handle aims for $1.20
ADA’s price is also seeking a breakout from a cup-and-handle pattern on the four-hour chart, as shown below. Bulls will now attempt to push the price above the pattern’s neckline at $0.96, confirming a bullish breakout.
If this happens, Cardano could rise toward the measured target of the prevailing chart pattern at $1.20, representing a 32% rally from the current price.
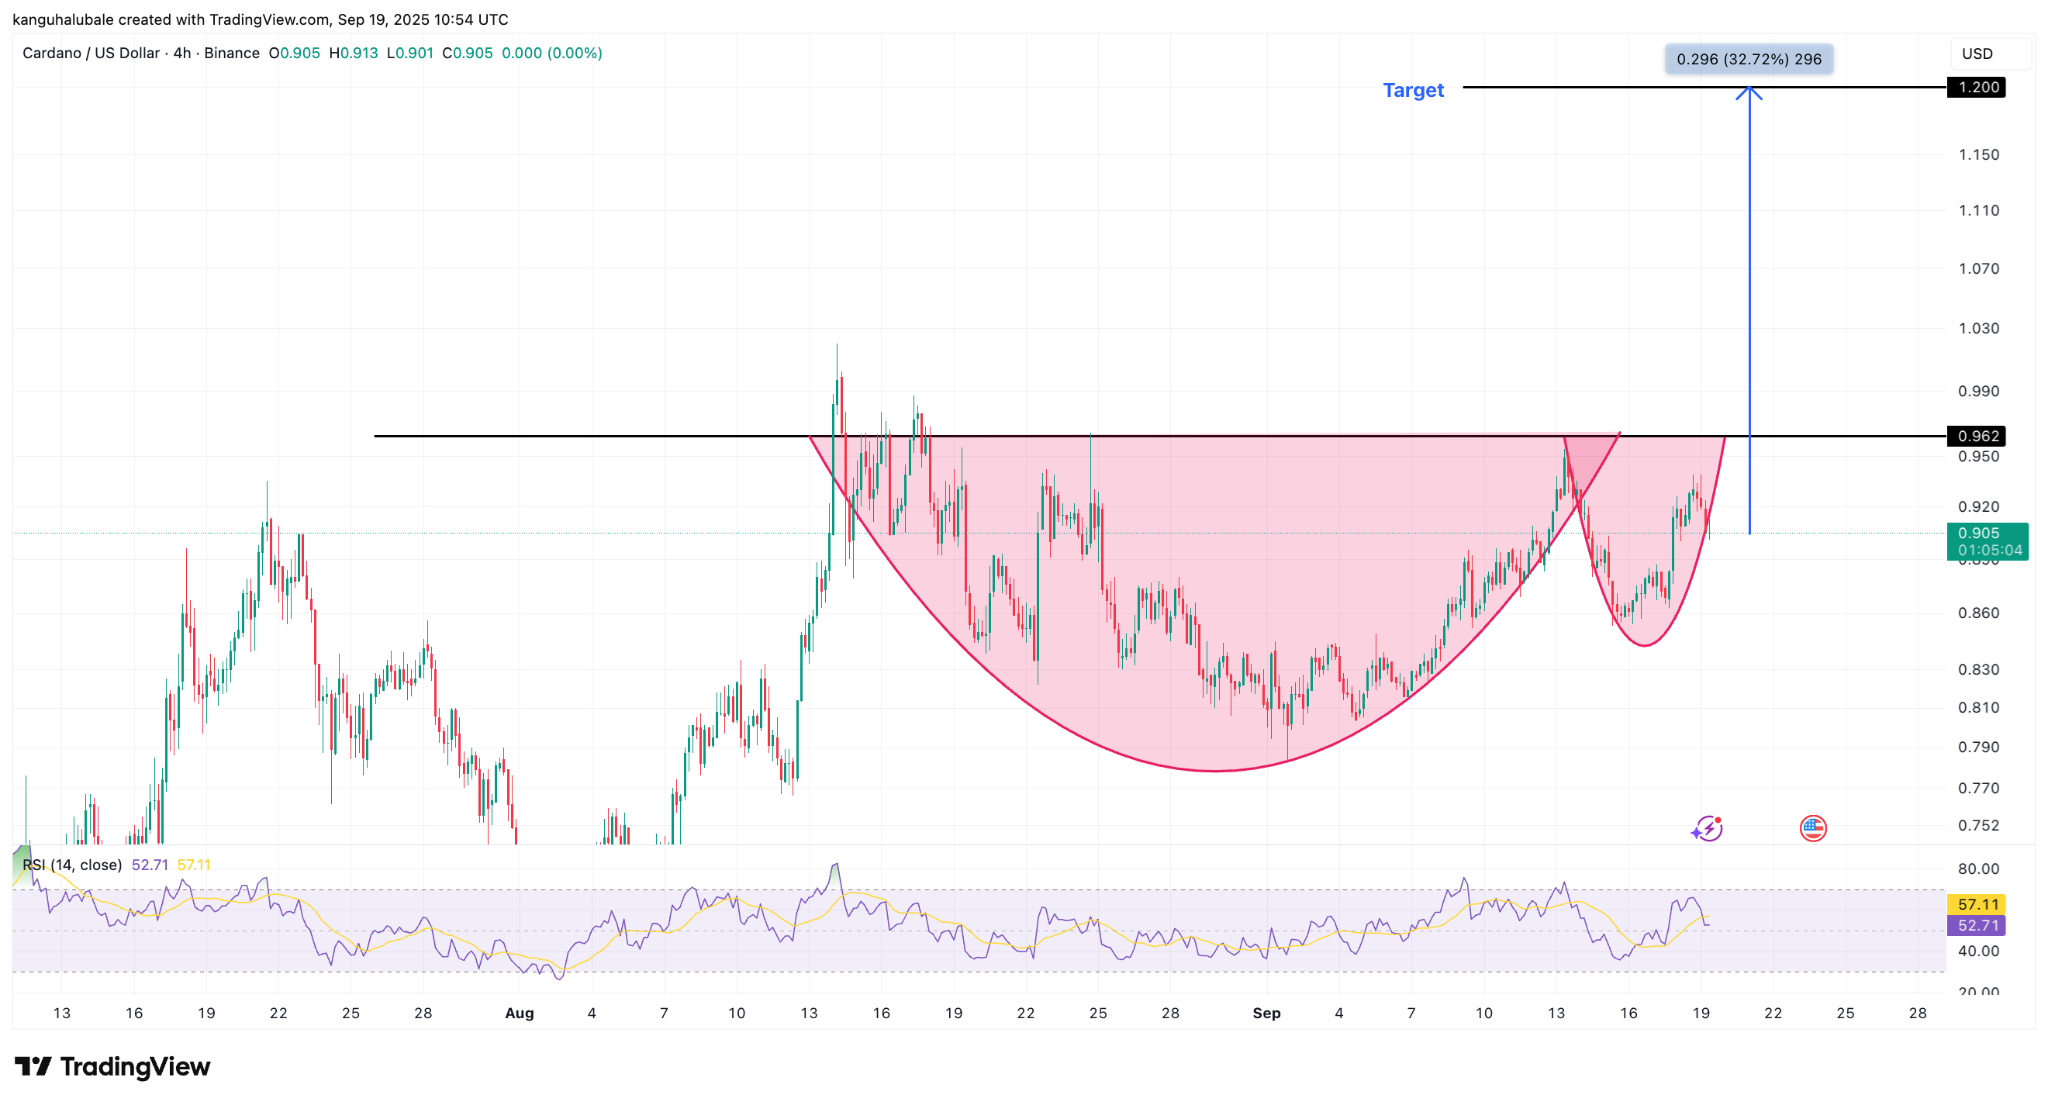
As Cointelegraph reported, ADA needs a decisive break above $0.94 to gain momentum for a push toward $1.25.
Cardano’s open interest hits new highs
Cardano’s open interest (OI) in futures markets hit an all-time high of $1.95 billion on Sunday, signaling strong speculative interest in the derivatives market.
Such high demand suggests that more traders are betting on ADA’s upward trajectory, potentially amplified by ETF speculation.
The chart above shows that Cardano’s OI has jumped 22% in the past 12 days, suggesting increased demand for leveraged ADA positions.
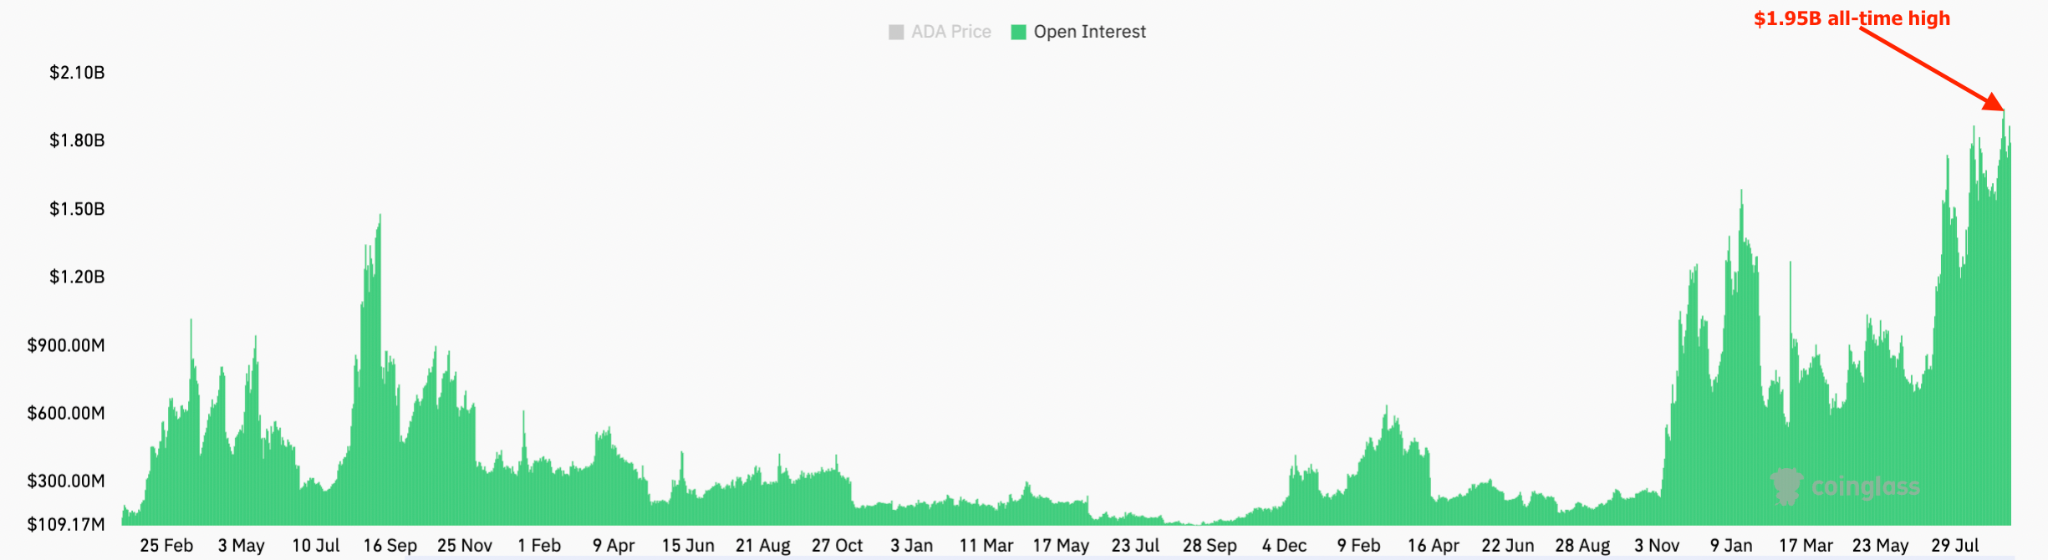
A surge in OI often precedes significant price moves, as seen between June and mid-August when ADA price nearly doubled following a 150% rise in OI.
A spot Cardano ETF is also looking more likely, with approval odds rising to 90% on Friday from 59% on Aug. 6, according to Polymarket.
As Cointelegraph reported, multiple technicals and onchain indicators make a strong case for an ADA price rally toward $2 or even higher, once the $1 psychological resistance level is decisively broken.
This article does not contain investment advice or recommendations. Every investment and trading move involves risk, and readers should conduct their own research when making a decision.
